
lucasantunes27
@t_lucasantunes27

What symbols does the trader recommend buying?
Purchase History
پیام های تریدر
Filter
Signal Type
lucasantunes27
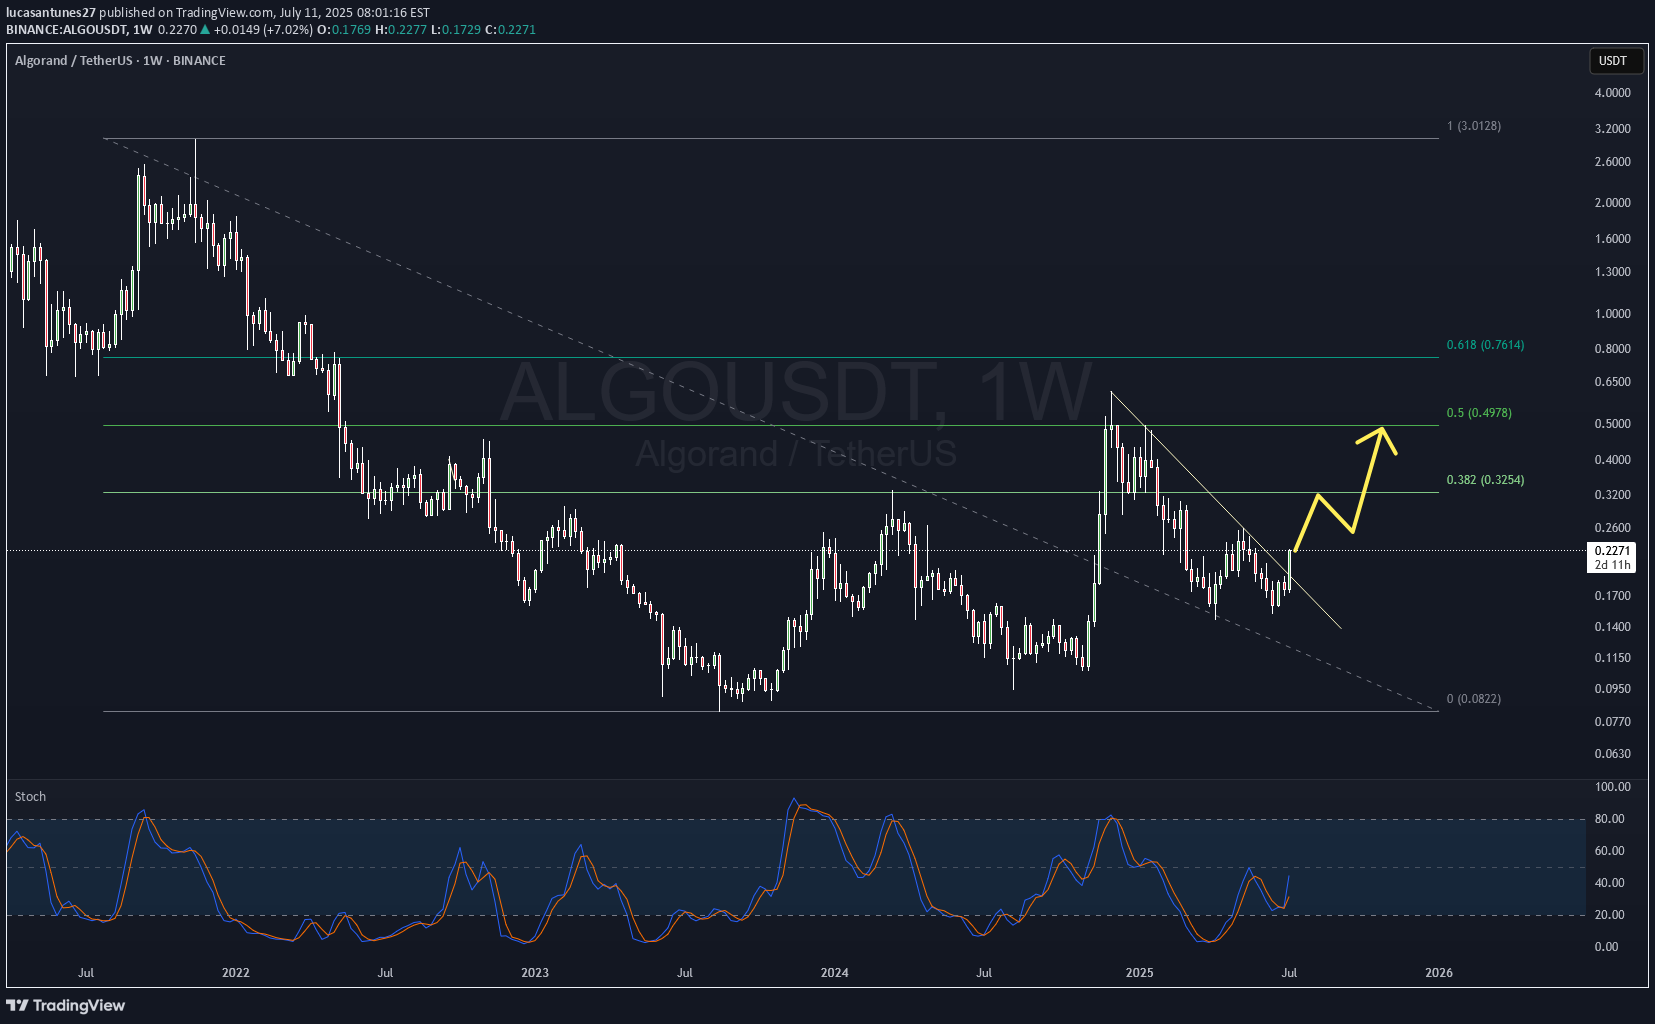
Considering the Fibonacci levels from the November 2021 decline to the August 2023 low, the current movement suggests a test of the last high, which coincides with the 0.5 Fibo level. This suggests that ALGORAND is likely to test resistance at $0.50 before seeking higher moves to $0.75 (0.618 Fibo). If it overcomes this level, the sky's the limit, and resistance should only be found above $2.00.
lucasantunes27

TRX positioned at the base of the weekly ascending channel, forming an inverted head-shoulder above the EMA 80, suggesting continuation of the movement with potential up to US$0.17
lucasantunes27

TRX is at the base of the bullish channel, with the previous top having broken as support, with Stochastic oversold, above the 80-period exponential moving average. Potential of 50% appreciation.
lucasantunes27

Bearish divergences in the RSI indicate a correction of around 15%, seeking to test the previous top near $30,500. It would also be a 0.618 Fibonacci zone on the daily chart since the rally that began on October 15th.
lucasantunes27

Megaphone pattern, indicating complete market indecision and volatility. High trading volume at the top, demonstrating possible exhaustion of the buying force.
lucasantunes27

Breaking the 0.618 Fibonacci ($5.19) level, high chances to retest the top of the previous move: $6.00 - $6.10.
lucasantunes27

Historically the crossover of the 34-period and 72-period weekly moving averages have represented BTC's majority bottom. Coincidentally (or not), it is also the point where the weekly RSI is below 30 points. A retest of $20,000 is increasingly likely to be the main resistance of the bearish cycle!
lucasantunes27

Bitcoin chasing the weekly EMA 305, targeting near the all-time high of 2017 ($20,000).
lucasantunes27

The 305-period weekly moving average has already hit the Bitcoin majority bottom on at least 4 occasions. Coincidentally (or not), it is currently lining up to the all-time high of 2017 ($20,000).
Disclaimer
Any content and materials included in Sahmeto's website and official communication channels are a compilation of personal opinions and analyses and are not binding. They do not constitute any recommendation for buying, selling, entering or exiting the stock market and cryptocurrency market. Also, all news and analyses included in the website and channels are merely republished information from official and unofficial domestic and foreign sources, and it is obvious that users of the said content are responsible for following up and ensuring the authenticity and accuracy of the materials. Therefore, while disclaiming responsibility, it is declared that the responsibility for any decision-making, action, and potential profit and loss in the capital market and cryptocurrency market lies with the trader.