
limitissky77
@t_limitissky77

What symbols does the trader recommend buying?
Purchase History
پیام های تریدر
Filter
limitissky77
BTC Rejection can touch 100K.......
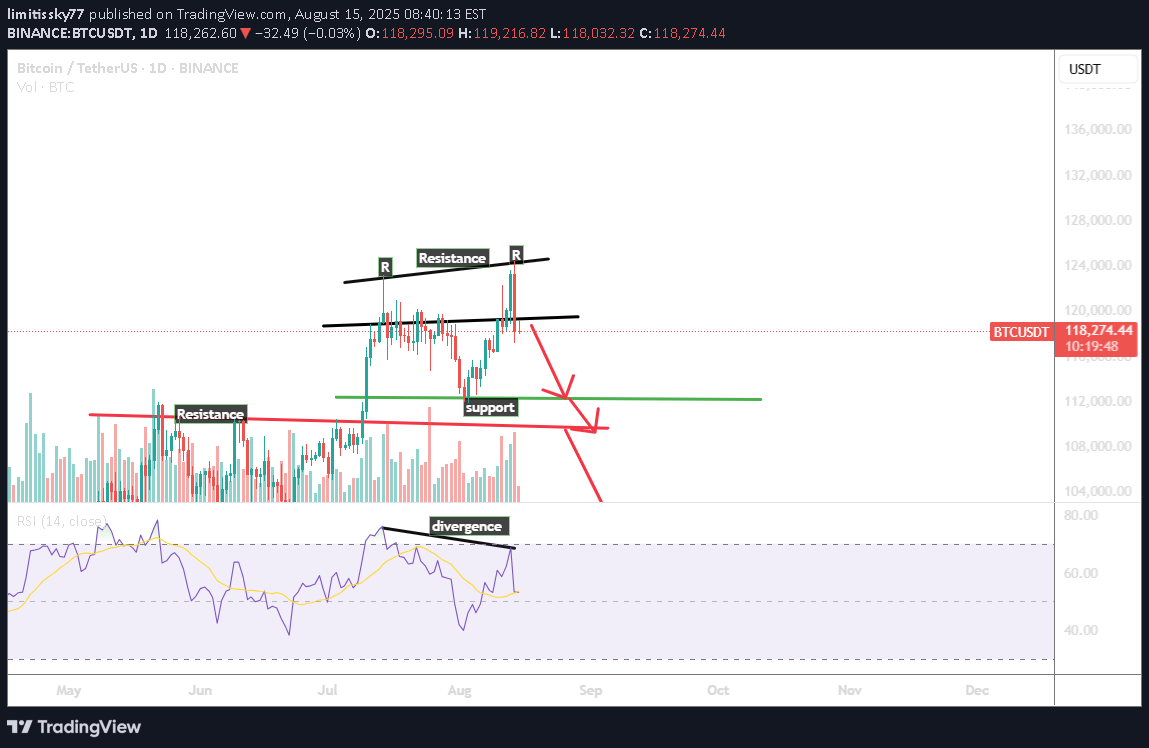
The chart is showing what looks like a double top pattern at the recent highs (~118k–120k USDT), marked by two "R" resistance points. The neckline is roughly around the 112k zone (green support line). A confirmed breakdown below this neckline could activate the double top target, pushing price lower. 2. RSI Divergence There’s a bearish divergence — price made a higher high, but RSI made a lower high. This signals weakening bullish momentum and increases the probability of a pullback. 3. Support & Resistance Zones Immediate resistance: 118k–120k Immediate support: 112k (neckline) Next major support: ~104k (previous range support), and then ~96k if selling intensifies. 4 Possible Scenarios Bearish: If BTC closes below 112k with volume, it may head toward 104k, possibly even 96k. Bullish invalidation: A strong daily close above 120k with increasing volume could negate the bearish setup and lead to new highs. The second push to resistance faced a strong rejection, completing a double top pattern. This rejection, combined with high bearish volume, strongly signals downside momentum. The setup confirms a likely move to lower price levels in the near term.As i have analysed BTC has Hit the target-1 at 108K
limitissky77
OFFICIAL TRUMP Updated : Can take off from here.....

Trend History Initial Pump and Dump: Price had a huge spike in the early phase (January), followed by a sharp sell-off. Descending Channel: From late January to early April, the price was moving in a falling wedge/descending channel . Market Bottom: Found around 7 April 2025, near the $7.15 level (highlighted as “Market bottom”). Breakout from Wedge: After hitting the bottom, the price broke above the wedge, signaling a reversal attempt. 2. Consolidation Phase Sideways Period: The market moved sideways for about 126 bars (~4 months) between roughly $7.5 – $12.5. Higher Low: The recent low is slightly higher than the market bottom, indicating bullish pressure. Key Technical Signals Accumulation: Long sideways action after a bottom often signals accumulation by big players. Breakout Potential: If price breaks above the $12.5–$13 zone with volume, it could trigger a strong rally. Volume: Needs to see a surge in buy volume for confirmation of any breakout. If price loses $7.15 support, it could retest much lower levels. Market sentiment & news will play a big role here, not just technicals. ✅ Bullish Scenario: Hold above $9 and break $13 with volume → next targets $34.7 → $51.7. ❌ Bearish Scenario: Break below $7.15 → risk of extended downtrend.
limitissky77
BTC Trading in a Range.

Support & Resistance Levels: R1: ~106,300 R2: ~109,000 R3: ~111,600 S1: ~102,800 S2: ~100,000 Bearish RSI Divergence Price made higher highs earlier (around June 10-11). RSI made lower highs, indicating bearish divergence. Price Action BTC bounced back from below S1 (~102,800) and is now hovering around R1 (~106,300). If it breaks and sustains above R1, we could see a move toward R2 (109k). However, failure at R1 can lead to a pullback to S1 or S2 levels. Strategy Suggestions: 📌 If Bullish: Wait for a clean breakout above R1 (~106,300) with volume. Potential targets: R2 (109k) and R3 (111.6k). 📌 If Bearish: If price fails to hold R1 and rejects, consider short opportunities. Targets would be: S1 (102.8k) and S2 (100k). Keep an eye on RSI — if it forms another divergence or crosses down the MA, bearish bias increases. ⚠️ Risk Factors: BTC is still within a consolidation range between R1 and S1. No clear breakout yet; be cautious with position sizing. Watch for macroeconomic news/events, as they can spike volatility.
limitissky77
BTC short term correction

A rectangle consolidation near recent highs (potential distribution or continuation) trading in sideways Volume is Declining (red arrow), which during consolidation usually suggests weakening momentum. RSI Divergence: RSI is forming lower highs while price is forming equal highs → This is a bearish divergence. Trade Setup: Looks like a short position has been taken with: Entry: Nears support(~110,200) Stop-loss: Just above resistance (111,840) Target: Lower zone of support (~108,700) Key Signals B earish Divergence on RSI: Indicates weakening bullish momentum . F alling Volume: Suggests lack of conviction from bulls at the high s. Equal Highs on Price: While RSI declines, this adds weight to the short bias. Tight stop-loss (risk-managed) ⚠️ Watch for fakeouts: If price breaks above the rectangle with volume, your stop might get triggered, but it would invalidate the bearish setup anyway. Thanks,
limitissky77
HIGHUSDT is making HH and HL

As per DOw analysis HIGH usdt is in bullish phase and can increase in future TP: :0.9
limitissky77
FIL Confirms Reversal!!!!!!

FIL/USDT (1H Chart) Technical Analysis 1. Market Structure & Trend Analysis The chart indicates higher highs (HH) and higher lows (HL) forming, which is a bullish structure. A double bottom pattern is visible multiple times, signaling a potential trend reversal. The price is currently near key support levels (around 3.35-3.36). 2. RSI (Relative Strength Index) – Neutral to Bullish RSI is at 57.62, which is in a neutral zone (not overbought or oversold). A move above 60-65 could indicate stronger bullish momentum. 3. Volume Analysis Volume is relatively low (44.64K), meaning the price needs more buying pressure to push higher. A volume spike could confirm the breakout. 4. Key Levels to Watch Support: 3.35-3.36 (Immediate support) 2.97 (Major support & invalidation level) Resistance: 3.50-3.55 (Short-term resistance) 4.33-4.50 (Major target if breakout occurs) 5. Possible Scenarios ✅ Bullish Case: If price holds above 3.35 and breaks the recent lower high (LH), it could push towards 4.33-4.50. Increased volume would confirm this move. ❌ Bearish Case: If price breaks below 3.35, it may retest the 2.97 support area. A breakdown below 2.97 would invalidate the bullish setup. 6. Trade Plan Idea (Based on Chart) 📌 Entry: Around 3.35-3.40 if support holds. 🎯 Targets (TP): TP-1: 3.90 TP-2: 4.33 TP-3: 4.50 🛑 Stop-Loss (SL): Below 2.97 (to avoid deep drawdown). Conclusion FIL/USDT is showing bullish signs with higher lows and a double bottom. A breakout above 3.50 with strong volume could confirm an uptrend. Watch the 3.35-3.36 support level closely for validation.
limitissky77
TRUMP/USDT (4H) Analysis ,, Reversal from here

TRUMP/USDT (4H) Analysis Key Observations: ✅ Double Bottom Formation – A strong reversal pattern, suggesting that the downtrend might be over and a new uptrend could be forming. ✅ Breakout Above Downtrend Line – The price has successfully broken out of the falling wedge pattern, a bullish signal. ✅ Higher High (HH) and Higher Low (HL) – Confirming a potential trend reversal to the upside. ✅ RSI at 57 – RSI is in a neutral zone, meaning there is still room for price growth before becoming overbought. Key Levels: 🔹 Support: ~$19 (recent breakout retest zone) 🔹 Resistance: $21.50 - $22 (next key area to break for bullish continuation) 🔹 Major Upside Target: $30 - $40 if the breakout sustains Potential Trade Plan: 📌 Entry: If price holds above $19-$20, it's a strong buy zone for continuation. 📌 Stop-Loss: Below $18 to manage risk. 📌 Target: $25 - $30 in the short term, with higher potential if market momentum stays bullish. 🚀 Final Thoughts: This setup is bullish, and if momentum sustains, TRUMPUSDT could see significant upside. However, watch for confirmation with volume and a retest of the breakout zone before entering aggressively. Key Observations: ✅ Double Bottom Formation – A strong reversal pattern, suggesting that the downtrend might be over and a new uptrend could be forming. ✅ Breakout Above Downtrend Line – The price has successfully broken out of the falling wedge pattern, a bullish signal. ✅ Higher High (HH) and Higher Low (HL) – Confirming a potential trend reversal to the upside. ✅ RSI at 57 – RSI is in a neutral zone, meaning there is still room for price growth before becoming overbought. Key Levels: 🔹 Support: ~$19 (recent breakout retest zone) 🔹 Resistance: $21.50 - $22 (next key area to break for bullish continuation) 🔹 Major Upside Target: $30 - $40 if the breakout sustains Potential Trade Plan: 📌 Entry: If price holds above $19-$20, it's a strong buy zone for continuation. 📌 Stop-Loss: Below $18 to manage risk. 📌 Target: $25 - $30 in the short term, with higher potential if market momentum stays bullish. 🚀 Final Thoughts: This setup is bullish, and if momentum sustains, TRUMPUSDT could see significant upside. However, watch for confirmation with volume and a retest of the breakout zone before entering aggressively.
limitissky77
ORDI Reversal....possible or not!!!!!

The Ordinals protocol has garnered attention for integrating NFTs into the Bitcoin ecosystem, allowing for the creation of unique digital assets known as "Ordinal Inscriptions" on satoshis There you have a full cycle. A bullish impulse followed by a long-term correction. After this long-term correction, a new cycle can develop. The next move is a bullish move, a bullish wave, a bullish trend. Higher highs and higher lows; long-term growth. 1️⃣ Break Above EMA 20 & SMA 50 – Reclaiming $14.50+ with volume would be an early sign. 2️⃣ Higher Lows & Higher Highs – A HL above $12 and a HH above $14.50-15 would confirm trend reversal. Key Considerations for Entry: ✅ Current Price (~$12.67) Near Historical Support – ORDI is near a major correction low, making it an attractive entry if accumulation is happening. ✅ RSI Showing Strength – A bullish RSI divergence hints at possible momentum shift. ✅ Market Structure Reset – If ORDI breaks above $14.50–15 with strong volume, it signals a new uptrend. Potential Trade Plan: 🔹 Aggressive Entry: Accumulate near $12–$13 with a stop-loss below the recent low (~$11). 🔹 Conservative Entry: Wait for a break above $15 (confirming trend shift) before entering. 🔹 Profit Targets: $25, $50, $100, and $252 (long-term).
limitissky77
BTC complete Analysis ........Whats next .... bear or Bull

BTC/USD 4H Chart Analysis Key Observations: Descending Channel: Price is moving within a downward-sloping channel with lower highs (LH) and lower lows (LL), indicating a bearish structure. Major Support & Resistance: Support: Around $89,000, marked as "major support." Resistance: Around $105,000, marked as "major resistance." BTC is currently near support, which could act as a potential bounce zone. Double Top Formation: A double top pattern was formed around $105,000, confirming strong resistance. This led to a rejection and continuation of the downtrend. Fake Breakout: A previous attempt to break above resistance failed, causing a sell-off. Potential Scenarios: Bullish Case: If BTC holds the support zone and breaks the resistance line, it could move towards the $100K+ zone. Bearish Case: If BTC fails to hold support, it could retest $89,000 as mentioned on the chart. RSI Divergence: RSI is showing a slight bullish divergence, meaning price is making lower lows while RSI is making higher lows. This could indicate a potential reversal or temporary bounce. Conclusion & Strategy: Watch the 89K -$90K support level closely. A breakout above the resistance line may confirm a bullish reversal. If price loses support, the next downside target could be $85K-$87K. RSI divergence suggests a possible short-term bounce. 🚨 Trading Plan: Long Entry: If BTC reclaims the resistance line with volume confirmation. Short Entry: If BTC loses support and breaks below 89K with strong selling pressure.BTC TP achieved at 78K
limitissky77
WIF what's Next... Reversal ?????

Key Observations: Price Action: The price is currently trading around $0.6584. The chart shows a strong downtrend from a previous high above $4.00, indicating a long-term bearish trend. The price has reached a major support zone (marked in green), which aligns with previous accumulation levels before the big uptrend. Support & Resistance Levels: Major Support: Around $0.60 - $0.65, where price has previously consolidated. Major Resistance: Likely around $1.00 (psychological level) and $1.50. RSI (Relative Strength Index): Current RSI: 23.97, which is in oversold territory (<30). This suggests that the asset is heavily oversold and could be due for a bounce or relief rally. However, RSI alone isn't a strong reversal signal; price action confirmation is needed. Market Sentiment & Potential Scenarios: Bullish Case: If the price holds the $0.60 - $0.65 support and forms a bullish pattern (e.g., double bottom, higher low), we could see a bounce towards $1.00 - $1.50. Bearish Case: If the support breaks, the price could move lower, possibly towards $0.50 or lower before finding new support. Trading Plan & Risk Management: Potential Long Entry: If price consolidates above $0.65 with increasing volume and bullish structure. Stop-Loss: Below $0.58 - $0.60 in case the support fails. Profit Targets: First target: $1.00 (psychological level). Second target: $1.50 (previous resistance zone). Confirmation Needed: Look for a bullish engulfing candle, increasing volume, or RSI divergence before entering a long position. Conclusion: The chart shows oversold conditions at strong historical support. A potential bounce could happen, but confirmation is needed before entering a trade. Risk management is crucial, as a breakdown below support could lead to further downside.
Disclaimer
Any content and materials included in Sahmeto's website and official communication channels are a compilation of personal opinions and analyses and are not binding. They do not constitute any recommendation for buying, selling, entering or exiting the stock market and cryptocurrency market. Also, all news and analyses included in the website and channels are merely republished information from official and unofficial domestic and foreign sources, and it is obvious that users of the said content are responsible for following up and ensuring the authenticity and accuracy of the materials. Therefore, while disclaiming responsibility, it is declared that the responsibility for any decision-making, action, and potential profit and loss in the capital market and cryptocurrency market lies with the trader.