Technical analysis by limitissky77 about Symbol BTC: Sell recommendation (8/15/2025)

limitissky77
BTC Rejection can touch 100K.......
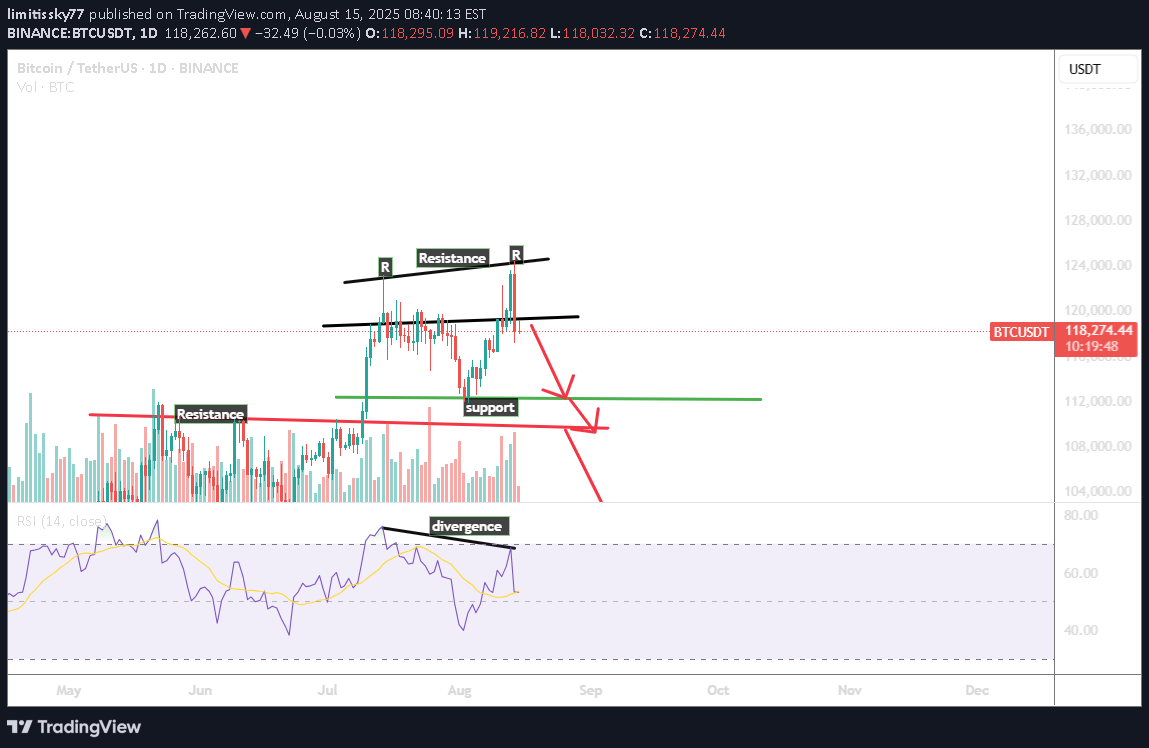
The chart is showing what looks like a double top pattern at the recent highs (~118k–120k USDT), marked by two "R" resistance points. The neckline is roughly around the 112k zone (green support line). A confirmed breakdown below this neckline could activate the double top target, pushing price lower. 2. RSI Divergence There’s a bearish divergence — price made a higher high, but RSI made a lower high. This signals weakening bullish momentum and increases the probability of a pullback. 3. Support & Resistance Zones Immediate resistance: 118k–120k Immediate support: 112k (neckline) Next major support: ~104k (previous range support), and then ~96k if selling intensifies. 4 Possible Scenarios Bearish: If BTC closes below 112k with volume, it may head toward 104k, possibly even 96k. Bullish invalidation: A strong daily close above 120k with increasing volume could negate the bearish setup and lead to new highs. The second push to resistance faced a strong rejection, completing a double top pattern. This rejection, combined with high bearish volume, strongly signals downside momentum. The setup confirms a likely move to lower price levels in the near term.As i have analysed BTC has Hit the target-1 at 108K