
learningedge
@t_learningedge

What symbols does the trader recommend buying?
Purchase History
پیام های تریدر
Filter
learningedge
FARTCOIN (FARTUSDT) Is Coiling For a Potential Move
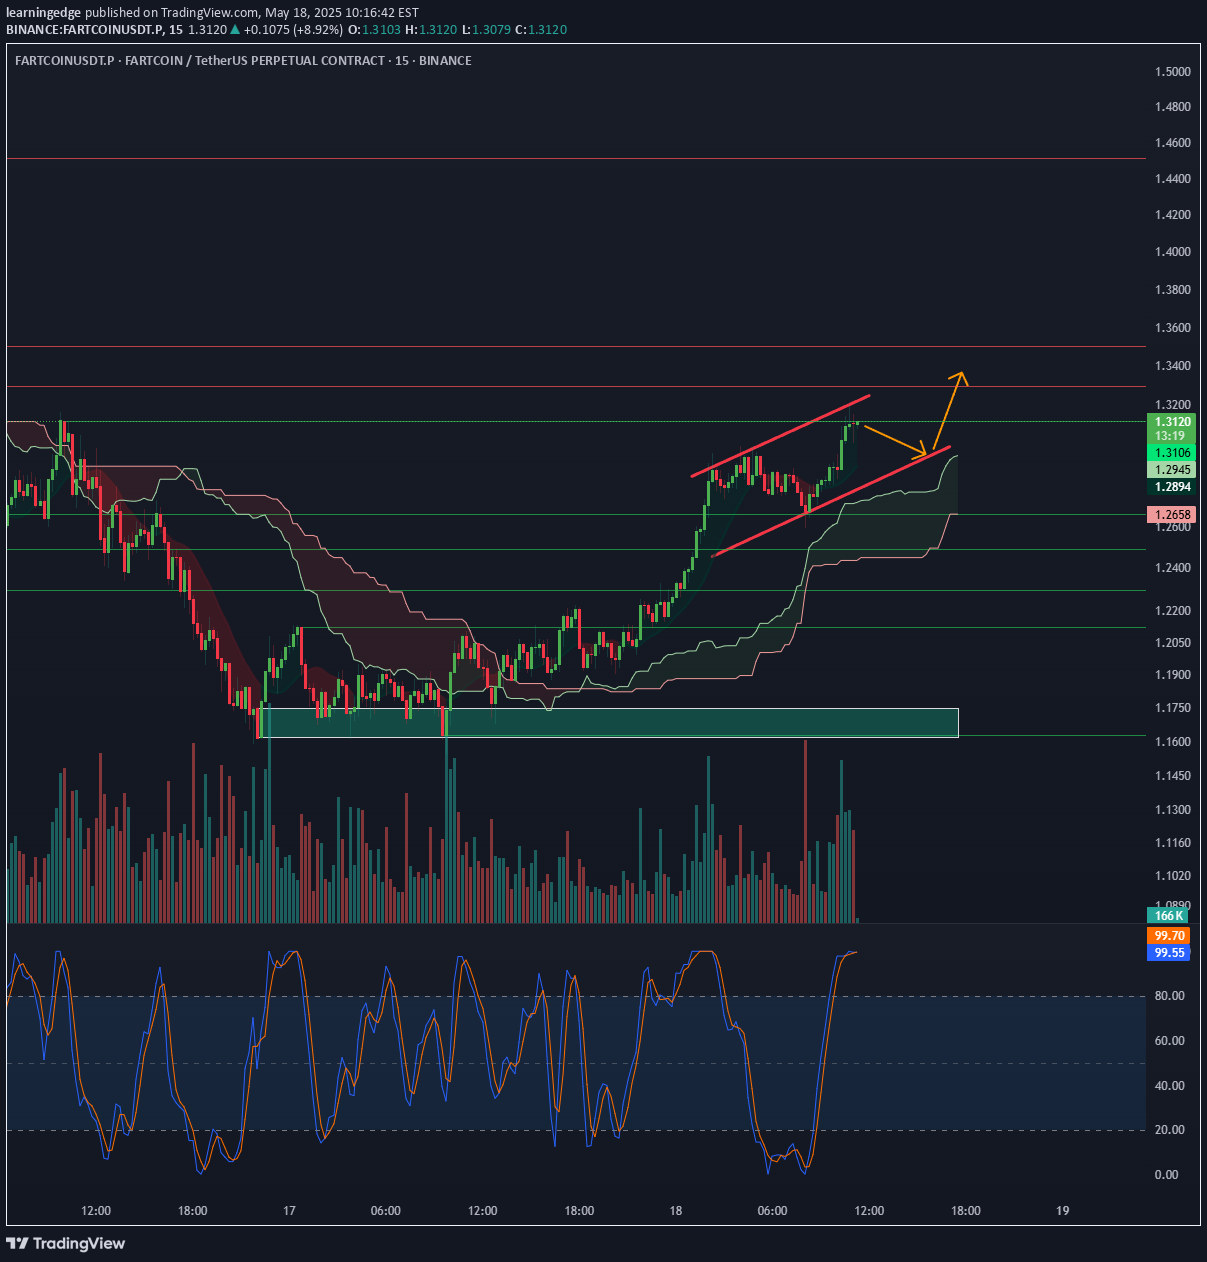
Let’s break down why this setup may present an attractive intraday or short-term play, and map out the critical triggers, levels, and risk points for traders: ▶️ Technical Story at a Glance: FARTUSDT has rallied hard off the prior demand/POI zones, climbing steadily in a rising channel on the 15-minute chart. The move has brought price directly into a well-defined supply/resistance zone — an area where sellers have historically taken control. Momentum is showing some warning signs: there’s a clear bearish divergence forming on the Stochastic RSI as price makes higher highs while the oscillator prints lower highs. Volume remains supported on the push up but shows no major breakout yet. This structure is classic for possible exhaustion at the top — buyers could lose steam and trigger a pullback, but a clean breakout is not off the table if momentum surges. ▶️ The Trade Idea: Plan: Wait for price action at the upper channel/supply zone. Short Setup: Enter a short if price prints a strong rejection candle at supply (especially with increased volume and Stoch RSI rollover). Target: Lower channel boundary and/or demand zone ($1.27–$1.29 region) Stop Loss: Just above supply zone ($1.33–$1.34), in case of an upside breakout. Breakout Setup: If price breaks and holds above supply with conviction (strong close + volume = confirmation), switch bias and look for breakout long. Target: Next supply/POI zone, $1.37–$1.39 Stop Loss: Just back inside prior supply (~$1.31) ▶️ Trade Management & Execution: Wait for confirmation: Don’t chase early! Watch for volume and reversal signals at supply, or for a clean, supported breakout. If entering short, trail stop down as price approaches the lower channel/demand to lock in partial profits. If breakout triggers, monitor for rejection/washout and be quick to de-risk on a fakeout. As always: position size to only risk 1–2% of account equity. ▶️ Why This Setup? Clear, actionable technical levels with well-defined risk. Structure supports a high-probability mean reversion (if rejection), while allowing for a fast pivot to bullish breakout scenario. StochRSI divergence and channel structure provide a roadmap for both conservative and aggressive trading tactics. ▶️ Key Levels Recap: Short Trigger: Rejection at $1.32–$1.34 (supply with divergence) Short Target: $1.27–$1.29 (demand/channel lower bound) Breakout Trigger: Strong close above $1.34 + volume Breakout Target: $1.37–$1.39 Stops: Above/below supply for shorts/longs; never risk more than you can afford. Keep your eyes on the price/volume behavior at supply, watch for divergence confirmation, and be nimble — false breakouts/fakeouts are common in this structure. Manage your plan & size at all times!
learningedge
ETHUSD Weekly Breakout Incoming? Targeting $3,250+

Ethereum (ETHUSD) is setting up for a major directional move on the weekly chart, and all eyes are on the key breakout zone above $2,800. Let’s walk through the analysis behind this swing trade idea and map out the key risk and reward levels: ▶️ Technical Story at a Glance: After months of downside, ETH has rebounded sharply off the $1,600 zone (clear weekly demand and high volume). Price is now pressing right up against a thick supply (resistance) zone that includes the psychological and technical resistance at ~$2,800. We’re seeing several bullish technical signals align right as price approaches a potential inflection point: • Weekly MACD Bullish Cross – signaling that longer-term momentum is flipping. • StochRSI and PSAR bullish – suggesting upside is in play, not overextended yet. • Volume profile supportive – no blow-off on the move back, buying looks organic. • Ichimoku/Cloud structure – if price can get a weekly close above the cloud (and $2,800–$2,900 zone), that could mark a regime change back to bullish. ▶️ The Trade Idea: Plan: Enter long on a confirmed weekly close above $2,800, as that would represent a powerful technical breakout. Targets: Primary: $3,250 (previous major supply/POI zone and clear chart resistance). Stretch: $4,100 for those who want to trail stops and ride a potential trend. Stop Loss: Below $2,350 (recent structure support and under the cloud) for smart risk control. Risk Management: Size positions so no more than 1–2% of equity is at risk on the setup. ▶️ Trade Management & Execution: Wait for confirmation — patience here beats trading early! Set alerts for a weekly candle close above $2,800 and confirm bullish behavior in MACD and trending indicators. Once triggered, enter the long with your stops in place and aim for the first major target at $3,250. Take partial profits along the way and move your stop to breakeven if the move continues in your favor. ▶️ Why This Setup? This setup aligns multiple timeframes and indicator signals for a high-conviction swing trade. The next major resistance is still a good distance away, giving bulls room to run, while clear invalidation ($2,350) allows for controlled losses if the thesis is proven wrong. ▶️ Key Levels Recap: Entry: Weekly close above $2,800 Stop: $2,350 Targets: $3,250 (primary), $4,100 (stretch) Keep a close eye on volume, candle closes, and confirm momentum before executing. If price fails at resistance, step aside and wait for a better opportunity. Always trade your own plan and manage risk!
learningedge
Solana (SOL) Breakout Alert: Technical Update

Solana is currently confirming a bullish breakout on the 15-minute timeframe. Price action has decisively moved above the key resistance level at approximately $175.56, supported by strong volume and bullish momentum indicators. Technical Context: The breakout aligns with a broader macro rotation into altcoins, as indicated by declining Bitcoin dominance and a bullish ETH/BTC ratio. On the 15-minute chart, price action is clearly above the Ichimoku Cloud, and the MACD indicator confirms bullish momentum. RSI is currently in an overbought territory, suggesting caution and careful risk management despite the bullish breakout. Trade Setup: Entry: Confirmed breakout around current levels (~$175.94). Stop-Loss: Set just below recent support at approximately $173.43 to manage downside risk effectively. Take-Profit Targets: Initial target at $180, corresponding to the next immediate supply zone. Secondary extended target at the psychological resistance level of $200. Risk Management Recommendations: Given the overbought RSI, traders should closely monitor for potential bearish divergences or momentum exhaustion. Consider moving the stop-loss to break-even once the price reaches the initial target ($180) to secure gains and manage risk. This breakout presents a clear short-term bullish opportunity, but disciplined execution and vigilant risk management remain essential. #SOL #CryptoTrading #TechnicalAnalysis #AltcoinSeason
learningedge
Bitcoin remains bullish across swing and long-term horizons

BTC - Bitcoin remains bullish across swing and long-term horizons, supported by strong institutional inflows, favorable macro tailwinds, and robust technical momentum. Short-term signals show mixed sentiment due to overbought conditions and minor bearish patterns. 🎯 Short-Term Tactics (Intraday: minutes–hours) My bias is neutral to slightly bearish. Currently bearish divergence and range trading between 103,000 (support) and 105,000 (resistance). Close below 103,000 signals bearish continuation. 📅 Near-Term Outlook (Swing: days–weeks) My bias is bullish, cautious due to overbought RSI. Continued institutional inflows, Fed rate cut expectations, global liquidity injections. Key Levels are support at 95,000; resistance at 105,000. Invalidation: Daily close below 95,000 flips bias bearish, indicating deeper correction. Buy dips toward support; avoid chasing at resistance. 🌐 Long-Term Thesis (Investment: months+) My bias is strongly bullish - macro drivers are institutional adoption (record inflows), Fed dovish pivot expectations, global liquidity expansion (e.g., China RRR cut). Maintain or increase BTC exposure; consider incremental accumulation on pullbacks to support. Critical support at psychological 100,000 level. Invalidation: Weekly close below 100,000 or sustained reversal in institutional inflows. Long-term bullish thesis remains intact unless macro or fund-flow regime materially changes.
learningedge
Bitcoin Outlook May 5th – Short, Swing, & Long-Term Views

1/ Short-Term (Intraday): Chop City BTC is stuck in a tight range between 95K (demand) and 98K (supply). Oscillators mixed, momentum fading near resistance. Play: Fade extremes, scalp carefully. Watch: Breakout above 98K or breakdown below 95K for momentum triggers. 2/ Swing Traders (Days–Weeks): Cautiously Bullish Weekly bullish structure intact, but daily charts flashing caution (Three Black Crows, Double Top, RSI stretched). Ideal scenario: Buy dips near 96K–95K if momentum resets bullishly. Invalidation: Daily close below 94.5K flips bias neutral/bearish. 3/ Long-Term Investors (Months+): Bullish with Caution Macro backdrop remains supportive (SPX bullish, DXY weak, yields stable/rising). Institutional BTC flows steady. BUT monthly chart shows bearish divergence—momentum slowing. Core strategy: Accumulate on major dips (ideal: 87K–76K). Critical invalidation: Monthly close below $76K demands risk-off rebalance. 4/ Macro Catalysts to Watch - Equity markets (SPX) & bond yields (US10Y) maintaining risk-on stance. - USD weakness (DXY bearish) supports BTC upside. - Watch ETF news, institutional flows, and altcoin rotation signals for early clues. 5/ Risk Management Short-term: Tight stops, quick profits. Swing: Respect daily structure; cut below $94.5K. Long-term: Hold bullish conviction above $76K monthly support. Bottom Line for Traders & Investors - Short-term: Range-bound scalps - Swing: Buy dips cautiously - Long-term: Bullish, but respect slowing momentum Stay agile, manage risk, and trade smart. Good luck this week! 🍀
learningedge
#BTC Update (1H Chart)

Trade Bias Verification: Long (with caution for short-term bearish momentum) Confidence Score: 6.5 out of 10 (slightly reduced due to bearish MACD crossover and RSI divergence) Hypothesis Refinement: The bullish continuation hypothesis still holds, but the MACD bearish crossover and RSI divergence on the 1-hour chart signal a stronger short-term pullback or consolidation phase. The price is likely to test the demand zone near 92,000 - 92,934 before resuming the uptrend. Traders should wait for signs of momentum recovery (MACD crossover back up, RSI turning up from support) before entering. Key Levels: Entry: Near demand zone 92,000 - 92,934, ideally after MACD bullish crossover and RSI support confirmation. Stop-Loss: Below demand zone and Ichimoku cloud, around 91,000. Take-Profit: Near recent highs (94,000) and daily resistance (95,000 to 100,000). Actionable Insight: Avoid chasing the current pullback; wait for momentum indicators to confirm a reversal near the demand zone. Use a momentum-based entry strategy on the 1-hour timeframe, entering once MACD crosses back above the signal line and RSI shows upward momentum. Set alerts for price approaching the demand zone and for MACD/RSI bullish signals. Maintain stop-loss discipline below the demand zone to protect against deeper corrections. Monitor volume for increasing buying interest on the bounce to confirm strength.
learningedge
BTC Setup Sunday

Bitcoin’s short- to medium-term outlook is cautiously constructive but nuanced by mixed signals across on-chain fundamentals, technicals, and market flows. On-Chain Fundamentals: Network security remains robust with rising hash-rate and difficulty, supporting long-term confidence. Active addresses and transaction volumes are stable, indicating steady user engagement. Whale supply share is stable, showing no aggressive accumulation or distribution, which suggests no imminent large-scale directional shifts from major holders. MVRV metrics place Bitcoin in a mid-optimism phase, implying moderate valuation support but not exuberance. Technical Signals: Short-term (15m to 1d) technicals show consolidation with a slight bullish bias—MACD bullish crossovers and neutral RSI support potential breakouts near $85,000 resistance. However, overbought Stochastic RSI and weekly bearish patterns (Double Top, Three Black Crows) caution against strong upward conviction without confirmation. The weekly MACD remains bearish but narrowing, hinting at a possible trend reversal if momentum builds. Exchange Liquidity & Fund Flows: Institutional fund flows have been negative for three consecutive weeks, with significant Bitcoin outflows totaling $751m last week, reflecting risk aversion amid macro uncertainty (tariffs, rising yields). Outflows are broad-based geographically and across product types, indicating widespread caution rather than localized profit-taking. Short Bitcoin products also saw outflows, suggesting reduced bearish positioning. Whale Movements: Whale supply remains steady without notable accumulation or distribution, implying that large holders are currently sidelined or holding, which reduces the risk of sudden large sell-offs but also limits strong buying pressure. Trading Opportunities & Risks Opportunities: A confirmed daily close above $85,310 with volume surge could trigger a momentum-driven breakout trade targeting $95,000 and beyond. Short-term bullish reversal patterns and MACD signals support tactical long entries on dips near demand zones (~$77,000-$83,000). Range-bound trading between $77k demand and 88K supply zones offers mean-reversion setups with defined risk. Risks: Overbought Stochastic RSI and weekly bearish patterns warn of potential pullbacks or failed breakouts. Continued institutional outflows and macro uncertainty may suppress sustained rallies. Failure to break above $85,310 resistance could lead to consolidation or retracement toward lower support levels. Summary: Bitcoin is in a consolidation phase with a slight bullish tilt but faces key resistance near $85,000. On-chain strength and stable whale behavior provide a solid foundation, yet institutional caution and mixed technical signals advise prudence. Traders should watch for breakout confirmation or signs of rejection at supply zones, balancing momentum and mean-reversion strategies accordingly.
learningedge
BTC Weekly Analysis: Potential Bullish Continuation

Hello Traders! Today, I'm sharing a detailed technical analysis of BTCUSDT on the weekly timeframe, highlighting key insights from two powerful indicators: Micro Dots with VMA Line and the Wyckoff Phase Oscillator. Why These Indicators? Micro Dots with VMA Line: This indicator provides clear signals (strength and weakness dots) and dynamic trend lines, helping identify trend continuations and reversals. Wyckoff Phase Oscillator: Combines RSI, MACD, and OBV into one oscillator, clearly identifying market phases (Accumulation, Distribution, Markup, Markdown). Technical Breakdown: Price Action & Ichimoku Cloud: Current Price: $85,216.50 BTC is trading above the Ichimoku Cloud, suggesting a bullish long-term trend. Strong support around $79,000 provided by Ichimoku Cloud. Micro Dots with VMA Line: Micro Dots: Currently neutral (no clear bullish or bearish dots), indicating market indecision. VMA Line: Price is near the VMA line, acting as dynamic support. A bullish crossover above this line would strengthen bullish sentiment. Wyckoff Phase Oscillator: Oscillator Reading: 33.21, just above the Accumulation Zone (29.33 - 29.29), suggesting a potential shift from Accumulation to Markup. Signal Line: Approaching a bullish crossover, indicating potential bullish momentum. OBV (Volume Confirmation): Stabilizing, indicating accumulation and potential bullish momentum. Volume Analysis: Recent volume spikes suggest increased market interest, supporting potential bullish continuation. Trade Idea & Targets: Scenario: Cautiously bullish continuation. Entry: Wait for a green bullish dot to confirm bullish momentum and crossover above VMA line. Stop-Loss: Below Ichimoku Cloud support (~$79,000). Take-Profit Targets: Primary target at recent highs ($101,821.96), secondary target at supply zone ($106,088.86). Actionable Steps & Confirmations: Micro Dots: Wait for a green bullish dot to confirm bullish momentum. VMA Line: Look for bullish crossover above the VMA line. Wyckoff Oscillator: Confirm bullish crossover above the signal line, clearly entering Markup phase. Volume: Monitor for sustained or increasing volume. Risks & Considerations: Currently mixed signals (neutral Micro Dots, oscillator near accumulation) suggest caution. Maintain conservative position sizing until clearer bullish confirmations appear. Strategy Type: Momentum (trend-following) strategy is most appropriate, aiming to capitalize on potential bullish continuation. Good luck and trade safely!
learningedge
Trading Plan Summary for BTCUSD Long Position

Hypothesis: Long if price closes above 84,500. Entry Criteria: Entry Price: Above 84,500 (15m close). Confirmation: Increase in volume on break. Stop-Loss: 84,000 (below nearest support level). Take-Profit: 85,300 (next resistance level). Position Sizing: Risk 1-2% of capital. Execution Steps: Set alerts for 84,500. Monitor volume for spikes during the breakout. Execute long position on confirmation of breakout above 84,500. Post-Trade: Adjust stop-loss to break-even if favorable. Exit at take-profit or if a reversal signal occurs.
learningedge
My expected targets for BTC in this bull run

Here are some targets I will be monitoring for BTC in this bull run - not financial advice. DYOR.
Disclaimer
Any content and materials included in Sahmeto's website and official communication channels are a compilation of personal opinions and analyses and are not binding. They do not constitute any recommendation for buying, selling, entering or exiting the stock market and cryptocurrency market. Also, all news and analyses included in the website and channels are merely republished information from official and unofficial domestic and foreign sources, and it is obvious that users of the said content are responsible for following up and ensuring the authenticity and accuracy of the materials. Therefore, while disclaiming responsibility, it is declared that the responsibility for any decision-making, action, and potential profit and loss in the capital market and cryptocurrency market lies with the trader.