learnfromfailure
@t_learnfromfailure
What symbols does the trader recommend buying?
Purchase History
پیام های تریدر
Filter

learnfromfailure
SUI bottom formed
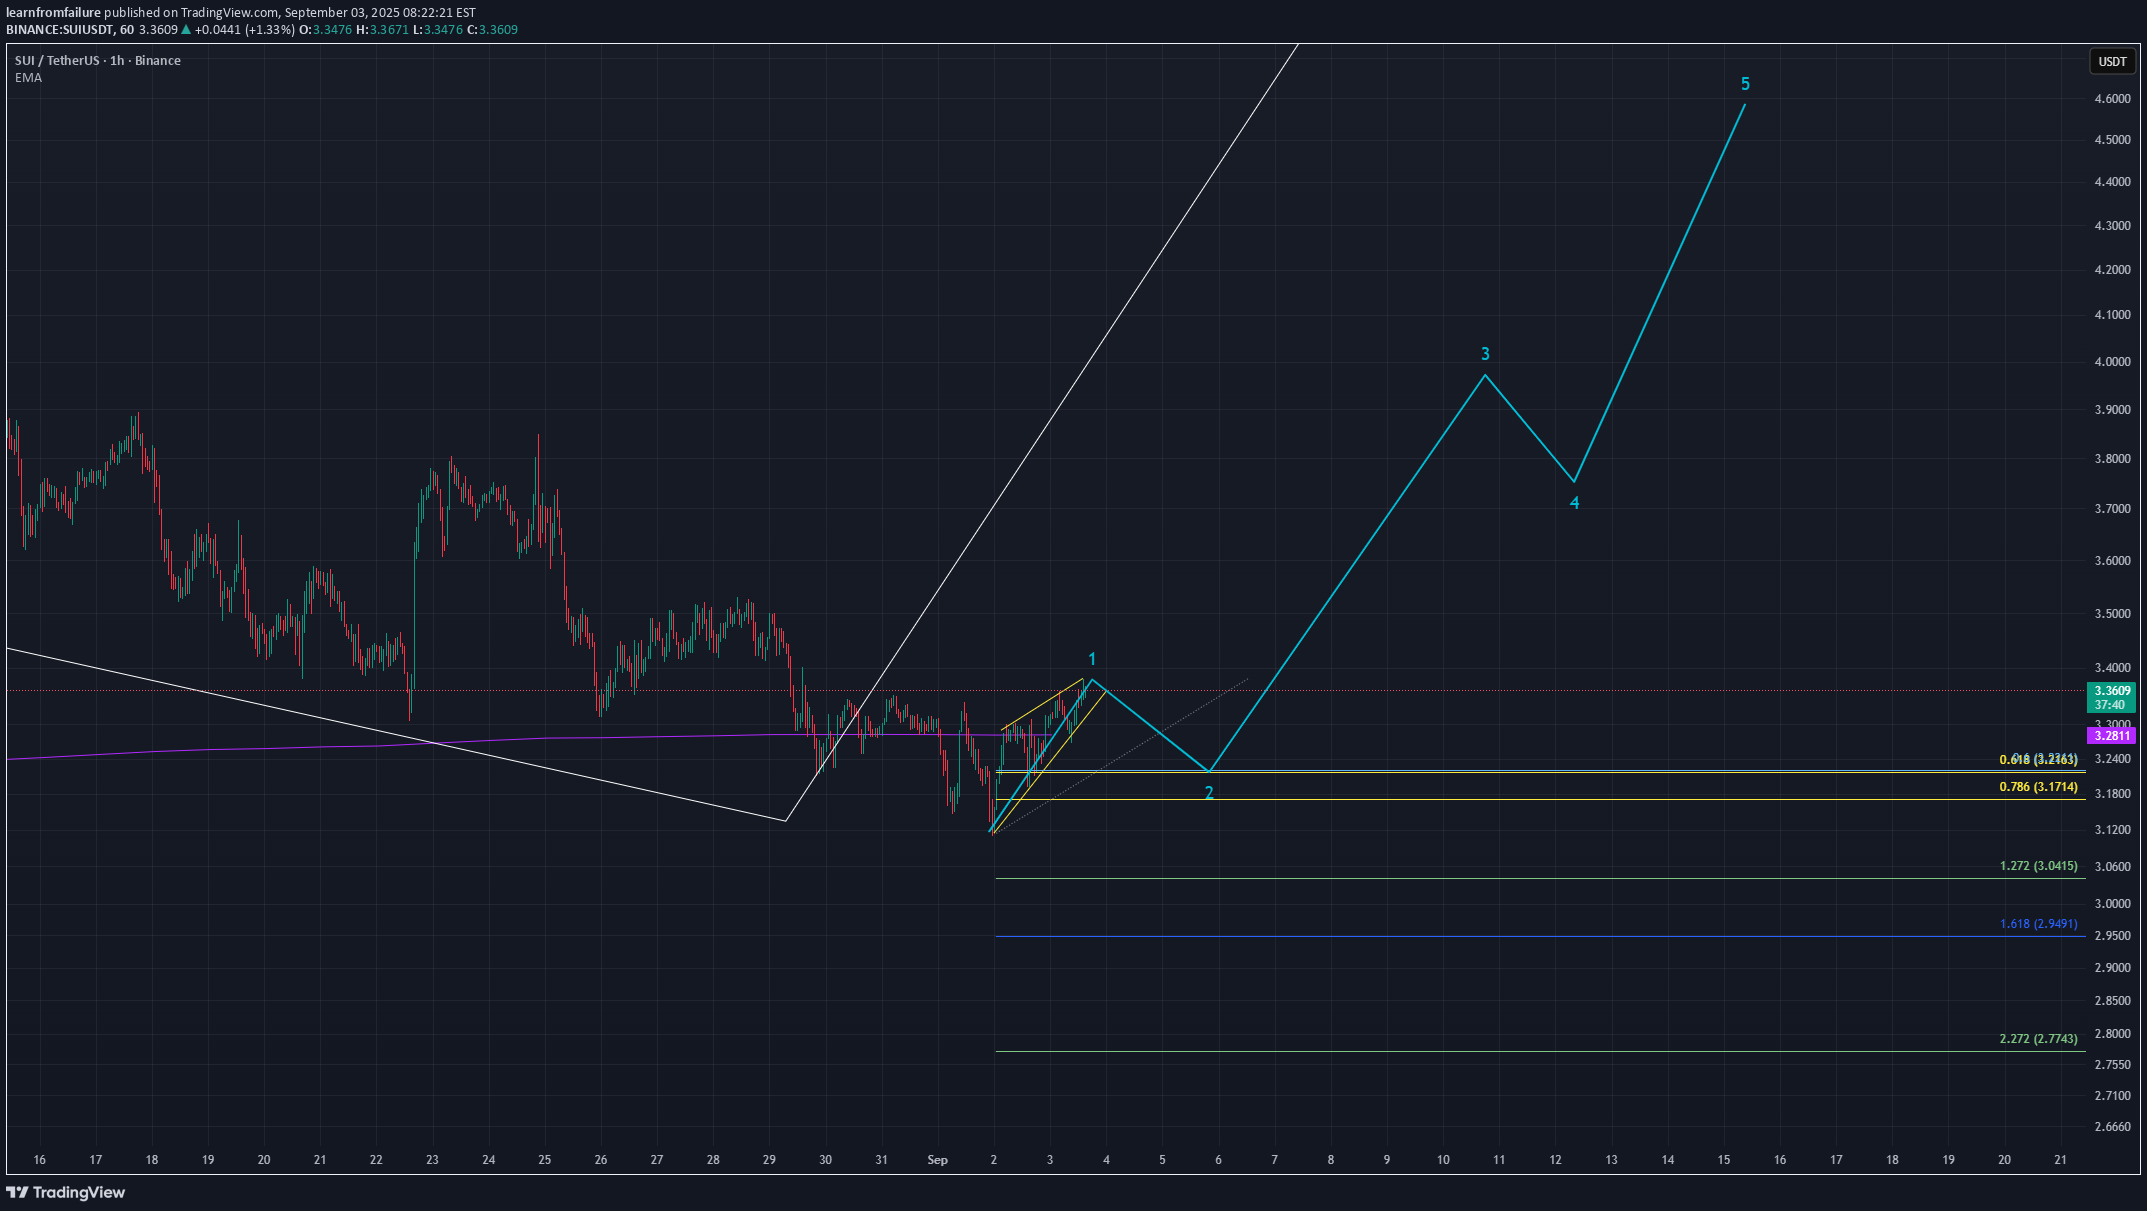
Sui occuration making leading diagonal. If bottom is formed we can hunt pull back at 0.5 of 0.6 fibonacci level. Also Sui close candlestick above 200 Daily ema. If Sui retest and find support on this level we can see bigger move elliot wave 3. Targets 4.1 and above ATH. I think its good way to DCA and wait for confirmation.We got perfect retest, lets see can we have some price action

learnfromfailure
Sui chance for +60% on this zone
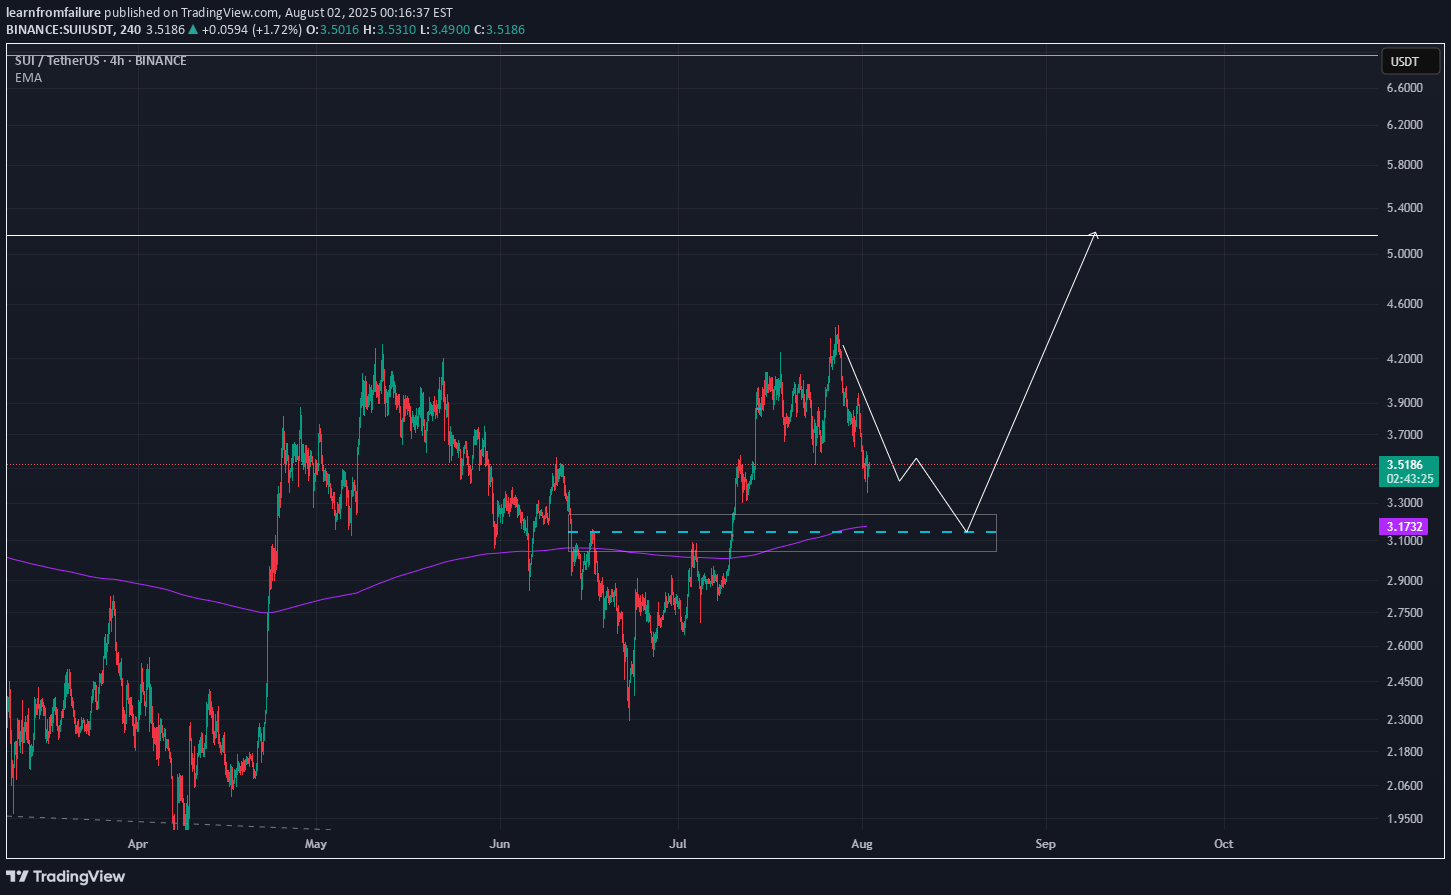
Sui continue to grap liquidation but on the monthly and weekly timeframe we are still bullish. I just saw good zone for trade. At 3.15 we have daily EMA + fibonacci 0.64 + Daily FVG. I will suggest to add some leverage because invalidation is close to 2.9. In this mid term bull market of altcoins we can see that SUI has good performance. IvanAfter a long time, SUI hit the zone.. I think its good time for DCA

learnfromfailure
APT - HUGE POTENTIAL (130+% SPOT)
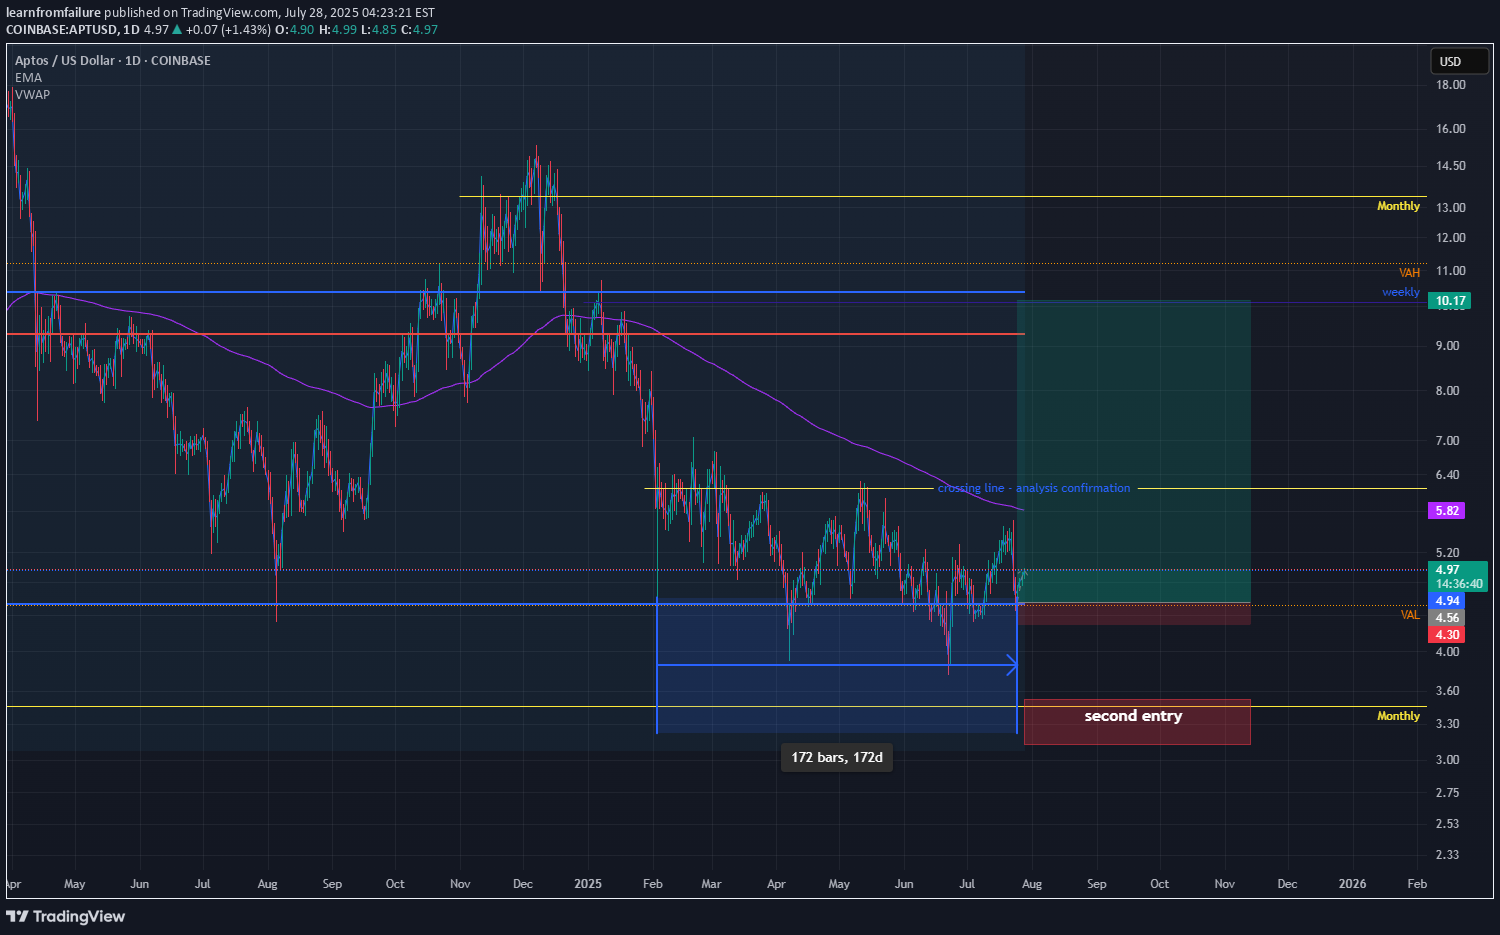
You probably forgot about this altcoin but it is justified. Downtrend since 2023 and lower highs, lower lows but.... If we look more close and use tool fixed price volume we can see that price is above VAL (Value area low), we had break through but price returns..Also good reaction of FVG (Fair value gap). Now, we can try buy this coin and have some stop lose. Price is in range 172 days and all people forget abut this coin. Analysis is right only if we close daily candlestick about 6$. Stop lose can be below 4.4$ which is 6-7% of losing. Second entry is monthly level at 3.3 and stop lose should be below the lowest low 3$. For me is great opportunity because risk reward is excellent. Ivan

learnfromfailure
OP - Chance for +70%
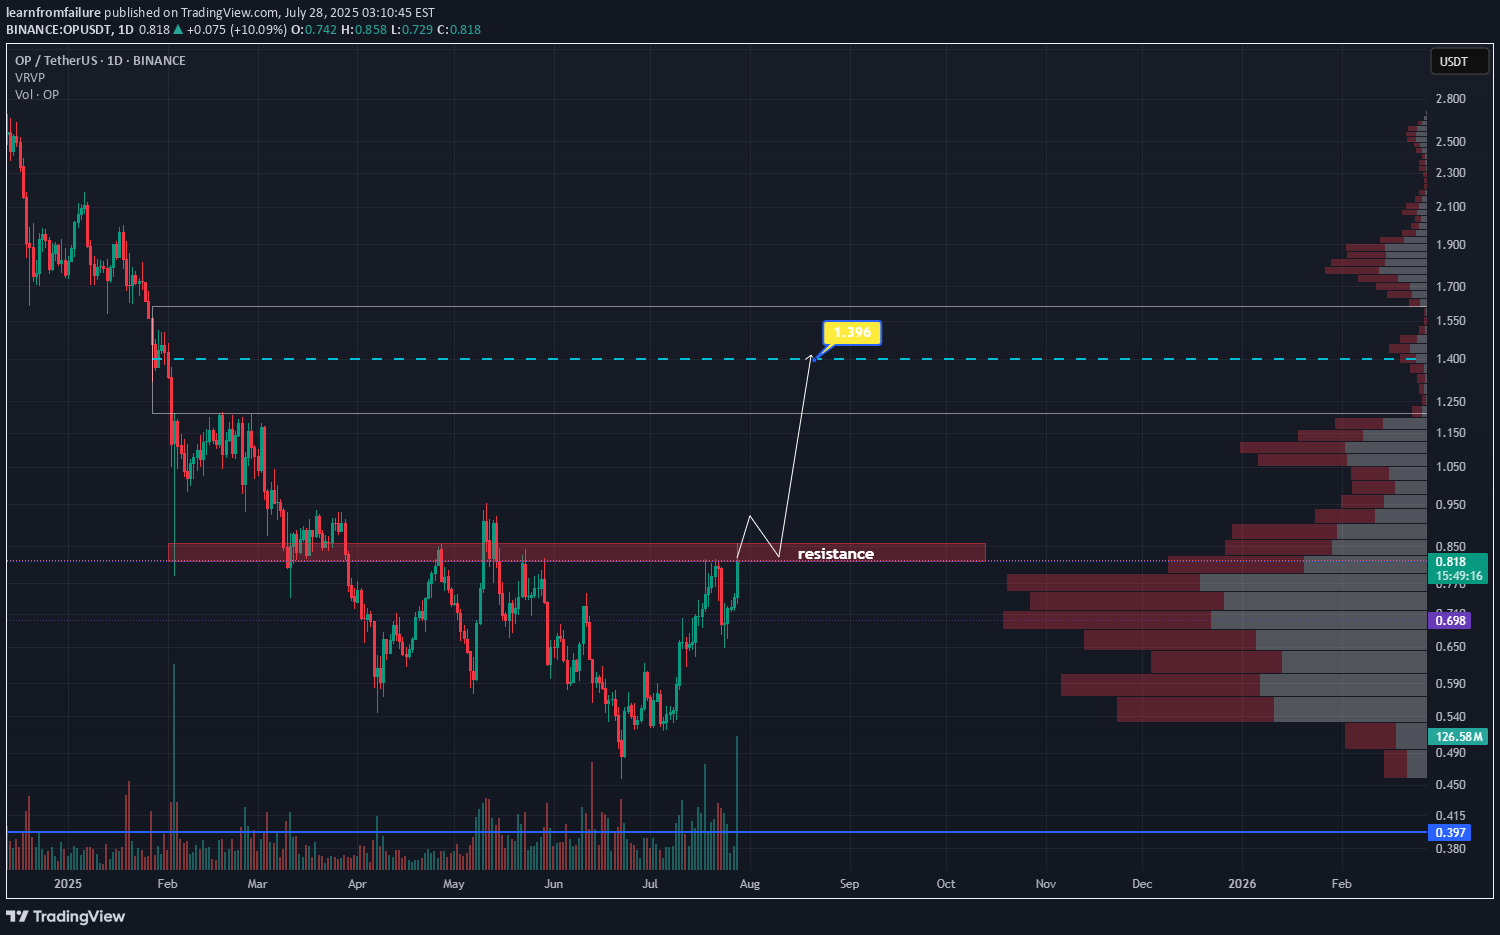
After weekly close we can see the volume coming in. On the chart we have resistance which if we break through then we can expect price 1.4 which is +70% from now. If I have some advice for leverage trading I think its better to wait for daily close and then hunt retest if happens. Rotations of money started already and I don't think is it a case for long run. We need to act, take profit and watch something else. Like if you like analysis and idea. IvanOp again trying to break resistance line.. It will be great because than we will wait for much higher prices

learnfromfailure
ONDO Bullish structure
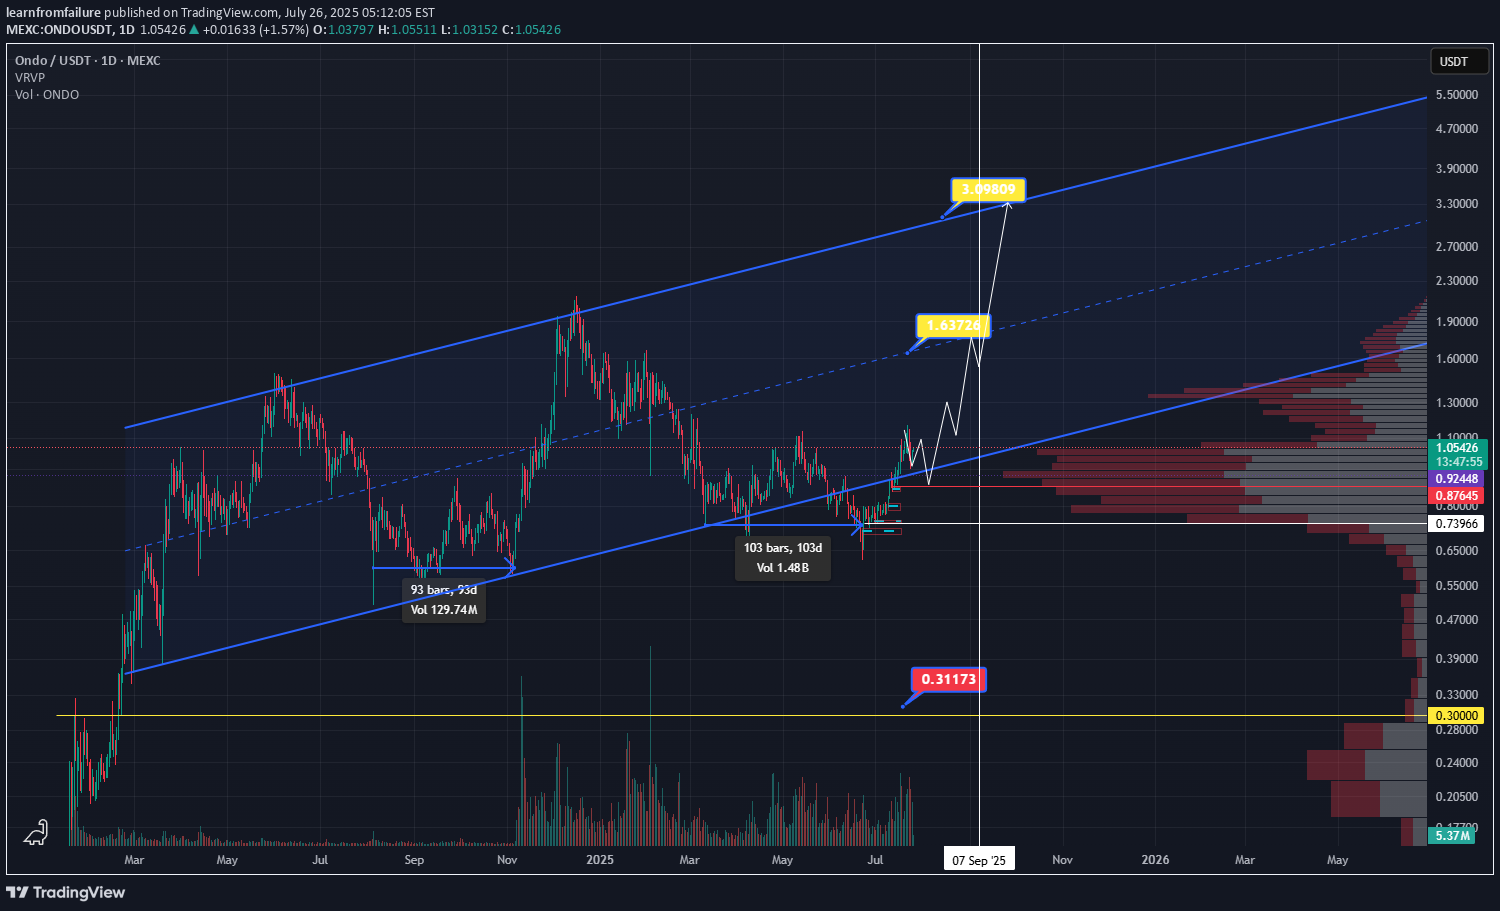
Ondo is back to bullish scenario. We can see long accumulation more then 100 days. As you can see price 0.9 is back and then bullish coming. So 0.85 and 0.9 have to hold and we can buy the dip. Keep in mind if Ethereum start to attack ATH, Eth ecosystem will grow much higher. So watch this level in next couple weeks and months.we got retest of the zone 0.85 - 0.9 now we need to see first 4h bullish structure. Keep in mind the second zone is 0.8 but in my opinion I would like to see some reaction over therewe have good reaction, now we need to cross 1.09 for continue

learnfromfailure
BTC key zones for continue
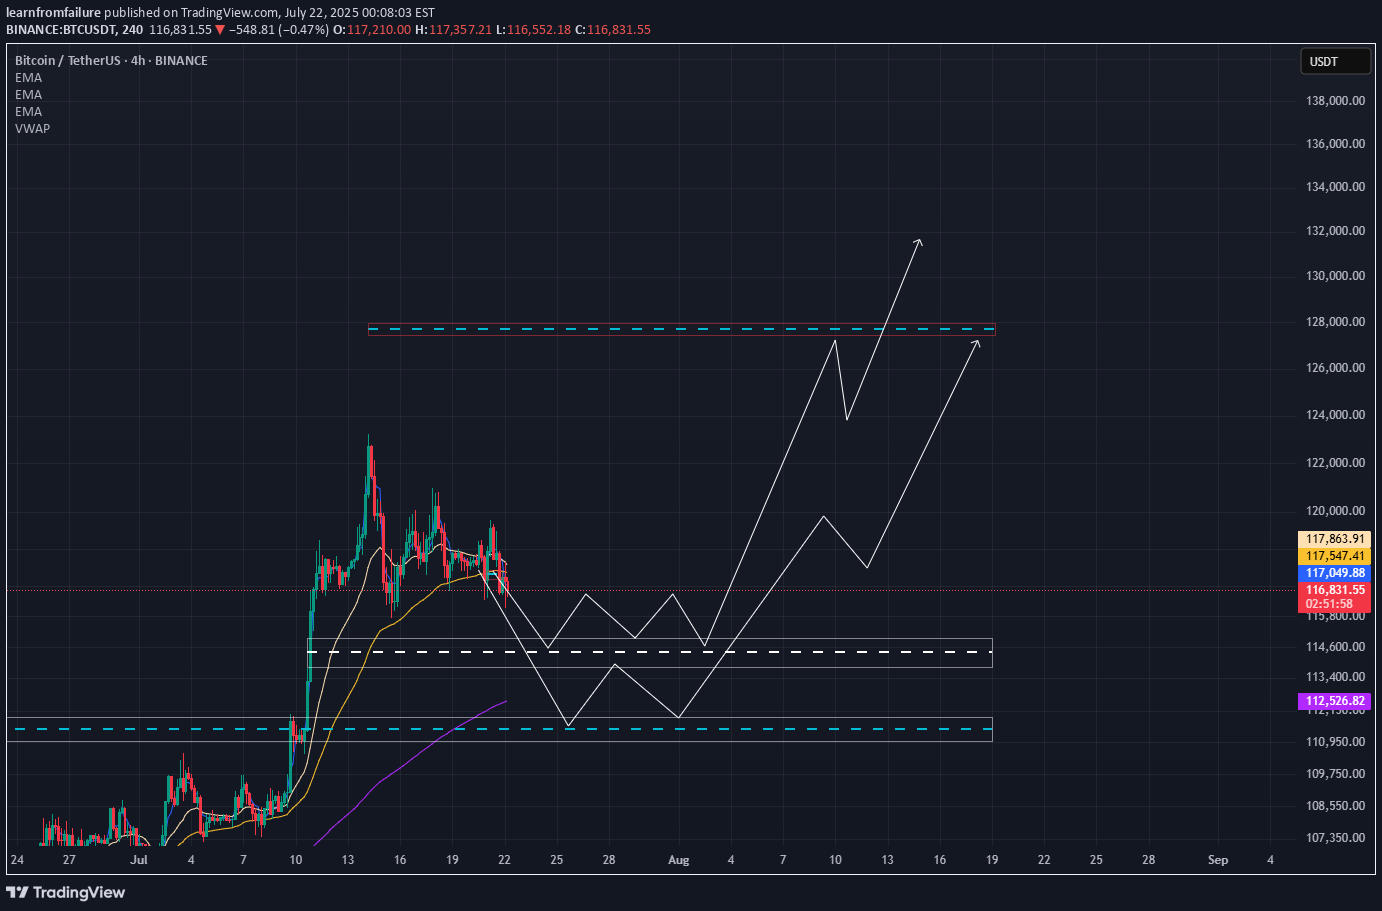
BTC needs to hold this zones for continue and there is some liquidity. Because dominance get breakout we want to see much higher prices for altcoin but maybe we will see sharp correction and continue up. Feel free to ask for some altcoin analysis.We got first pick support after liquidity taken.First zone didn't hold so now we are waiting to see 111500 how it will be reactmaybe we will grab that liquidation

learnfromfailure

learnfromfailure
BTC BIG PICTURE

One of the lagre picture that I am following in the coming months. Everyone expects 100k, which is possible because you see targets 1 and 1,618, but since the first wave was impulsive, I don't believe it will have a big extension. Targets 74k and 95k until the price tells me otherwise. As for the smaller tf, I will comment belowFirst look at the smaller time frame , I expect price to make 3-3-3-3-3 and confirm the final diagonal.Another view is that this move has already started its third impulsive wave. Disability zones 62k-63k where I will know which side it will go after price test those levels

learnfromfailure
RUNE - BIG GAIN (BIG PICTURE)

Dear friends, I will show another coin next to the LINK where I see Elliot wave expressed.. For LINKCHAIN, you have an analysis below this post..First I would like to show my old projections related to RUNE and the exact take profit and return to DCA on it..Here is a projection of profit taking.. and an accurately expressed mass jump of the first wave..Then marked zones for returning to the market.Now that all that has happened, I have scenario A and B. The first scenario is that the bottom is behind us and that the first purchase is an excellent decision, on the other hand, we also have plan B because there is great resistance at $5. If the price does not show strength, the last buying target would be 2.2. Below that there is a very large volume and below that the door opens for a big risk (FOR NOW I'M VERY BULLISH)The first target will be scalar from $30 and on.This will all happen only if BTC manages to break the ATHThis is how I see things right now, there is still room to watch the chart here. Also RUNE/BTC seems to have formed a bottom

learnfromfailure
LINK according to Eliot

Market at this moment is showing the perfect story of the Elliot wave wave.. After the outbreak of liquidity on June 13, 2023, the link moved impulsively to its 5 waves.Now we see that the correction took place at 0.61 Fibonacci, which I see as an ABC correction. The only thing I'd like to see at this point is fill the wick on the daily chart or at least halfKeep in mind that this is a large market cap and it will take time to realize this. The invalidation of this analysis is a return to the $8 range.Tell me what you think about this analysis and whether you are buying now link?
Disclaimer
Any content and materials included in Sahmeto's website and official communication channels are a compilation of personal opinions and analyses and are not binding. They do not constitute any recommendation for buying, selling, entering or exiting the stock market and cryptocurrency market. Also, all news and analyses included in the website and channels are merely republished information from official and unofficial domestic and foreign sources, and it is obvious that users of the said content are responsible for following up and ensuring the authenticity and accuracy of the materials. Therefore, while disclaiming responsibility, it is declared that the responsibility for any decision-making, action, and potential profit and loss in the capital market and cryptocurrency market lies with the trader.
