
hhMaxima38
@t_hhMaxima38

What symbols does the trader recommend buying?
Purchase History
پیام های تریدر
Filter
hhMaxima38
[UPDATE] - The Art of Chillin’: Smart Money’s Favorite Season
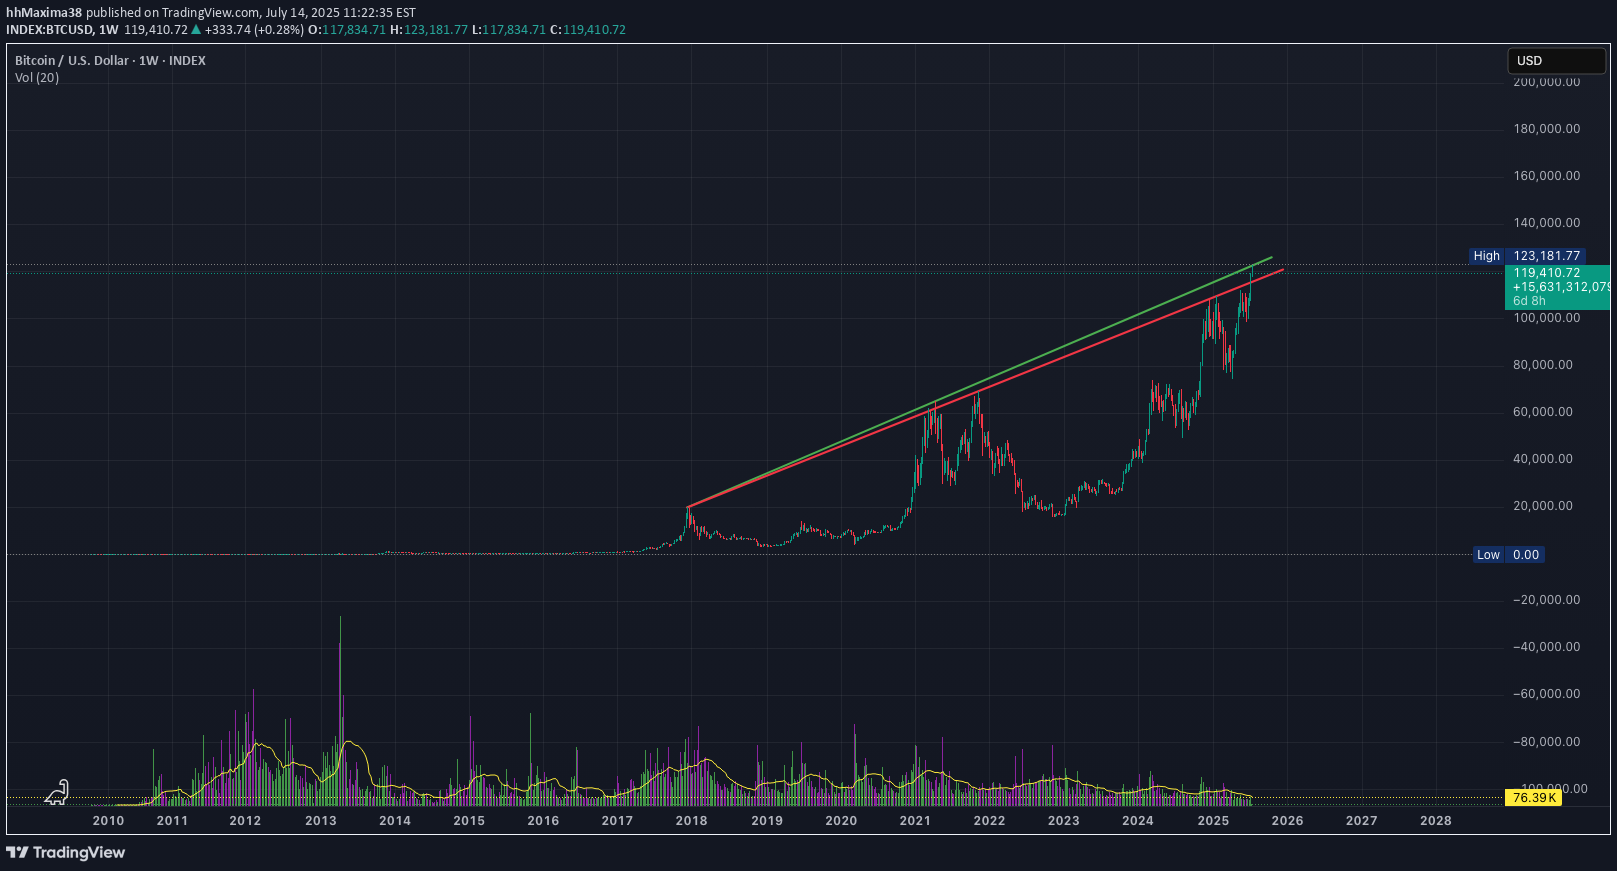
Hey lads, Congrats on that juicy 120K ! We’ve breached the first trendline and tagged the second trendline (green). We’re now sitting just below it. As mentioned in my previous post, these trendlines are robust and marked a local top back in November 2024. We’ve had a great run so far. BTC finally broke through the first trendline after a few rejections — now let’s see how this plays out. Overall, the market has started to pick up again. But to get what we all want, BTC needs to just chill for a bit — no dumping, no pumping — just chill, so alts can start trending higher. If not, it’s still BTC season. Check my previous post about Altseason for more context. That's it, that's the idea" - Good night !
hhMaxima38
When YouTubers Say 'No'… We Say 'LTC Go!'
I’m not here to drop some fancy technical analysis today. I’m here to tell you… this might just be it. A big, popular YouTube channel just announced they’re not too bullish on Litecoin this cycle. And guess what? That might actually be our ultimate buy signal. The chart’s looking bullish now — the trap has been set, and left behind us. 😎 They FUD, We Flood (Our Bags) Why Litecoin? Beyond its unshakable fundamentals, if you genuinely understand and believe in crypto and digital freedom, Litecoin is the purest expression of that vision That's it, that's the idea" - Good night !
hhMaxima38
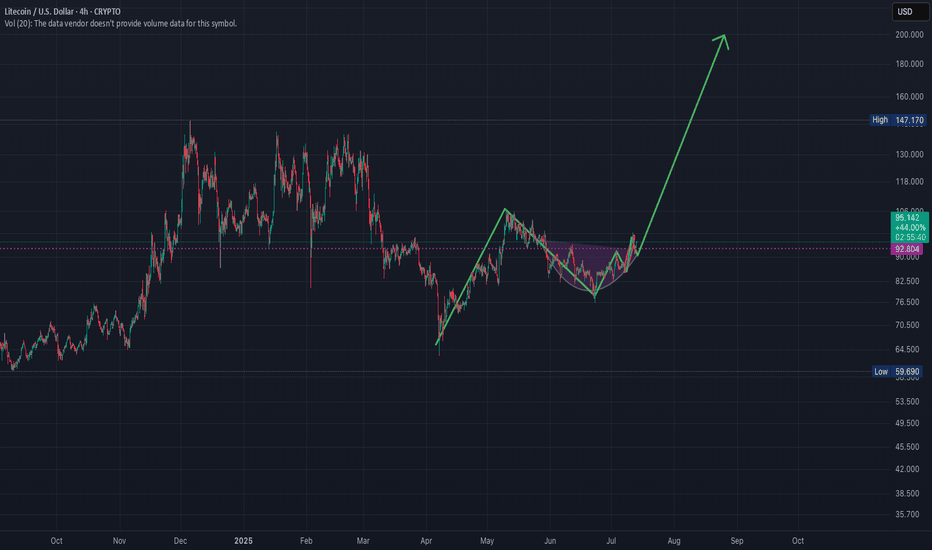
LTC, he Hidden Strength Beneath the Retrace
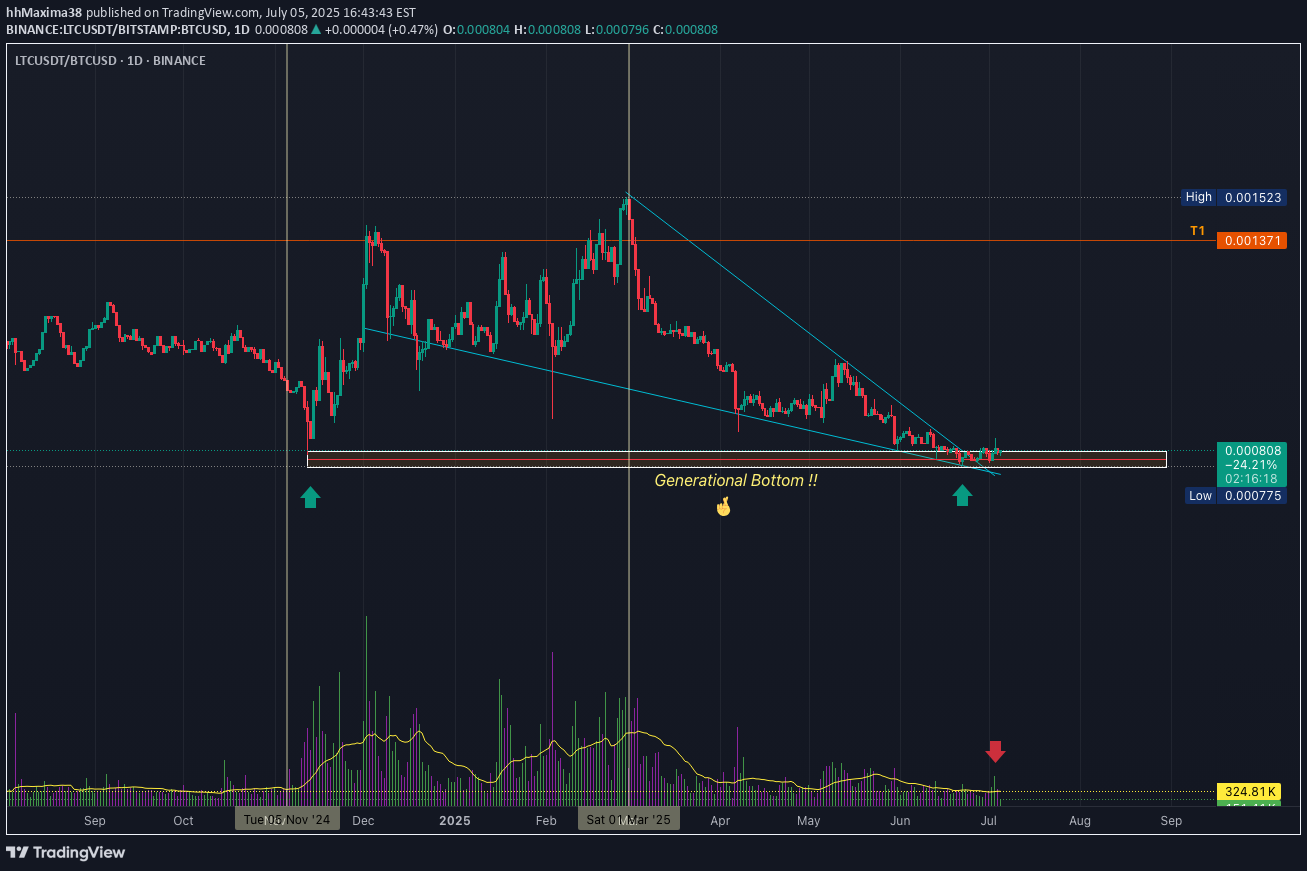
Ma dudes, we might just be witnessing something big and beautiful here. 🤌✨ Okay okay, I might sound like a total degen, but hear me out: ✅ Double bottom (check those two green arrows) ✅ Bullish divergence on the RSI ✅ MACD on the monthly just crossed bullish — for the first time ever on this pair! ✅ OBV stayed strong, didn’t collapse even during that nasty monthly retrace ✅ Notice how volume was climbing during the uptrend, but fell off during the retrace? That means the drop lacked real conviction. We’re also sitting at an ATL (all-time low) — the lowest we've been. Check out that red arrow pointing at the volume: that's the first sign of a burst. The next bursts? 💥 They should be explosive. …And that’s just to name a few. See you somewhere up there 🚀 — once we break through that T1 level, we should start trending higher fast. That's it, that's the idea" - Good night !The second burst !, seems like the third one is the charm
hhMaxima38
Adam & Eve on the Chart:Will They Bless Us with a $1,500 Miracle
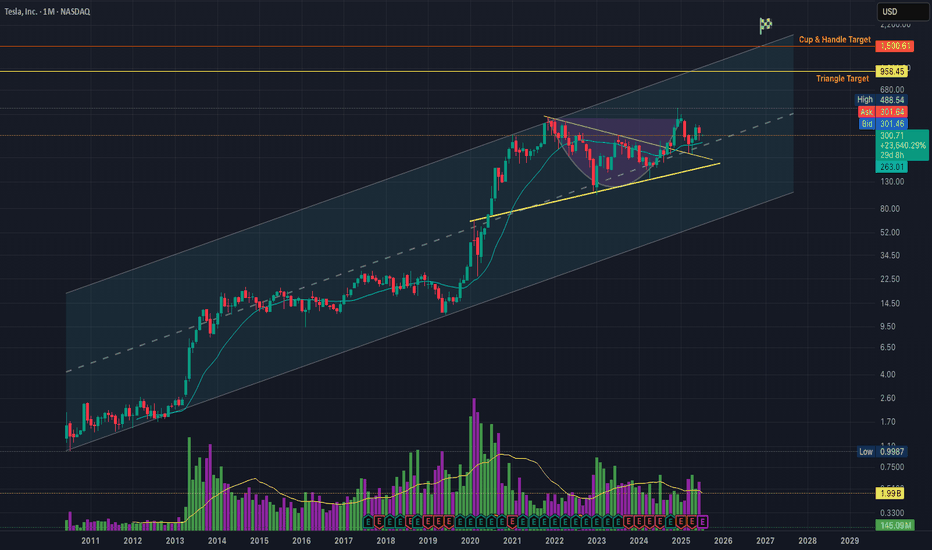
I don’t have much to say — it’s pretty straightforward. We’ve got two potential structures on the chart: ✅ First, the symmetrical triangle that already broke out, aiming for a target around $958 to $1,000. ✅ Then we’ve got the “Adam & Eve” structure (gotta flex sometimes 😎), see it as a cup & handle pattern, aiming for a crazy $1,500 target. This one hasn’t broken out yet — but if the first triangle breakout plays out fully, it basically sets the stage for this one to break out too. Some quick facts: The bounce zone around ~$245 is a huge multi-timeframe confluence level. Volume profile support is literally chilling right at $245. Multiple moving averages are backing this move, even on lower timeframes than the "1M" Triangle retest? Check. 0.786 fib support? Check. (And to name a few) Overall, the chart looks Fine to me. Negative news might affect the short term, but the trend should stay intact. Unless the macro changes. That's it, that's the idea" - Good night !
hhMaxima38
The Chart Is Ugly. The Setup Is Beautiful. Welcome to the Trap
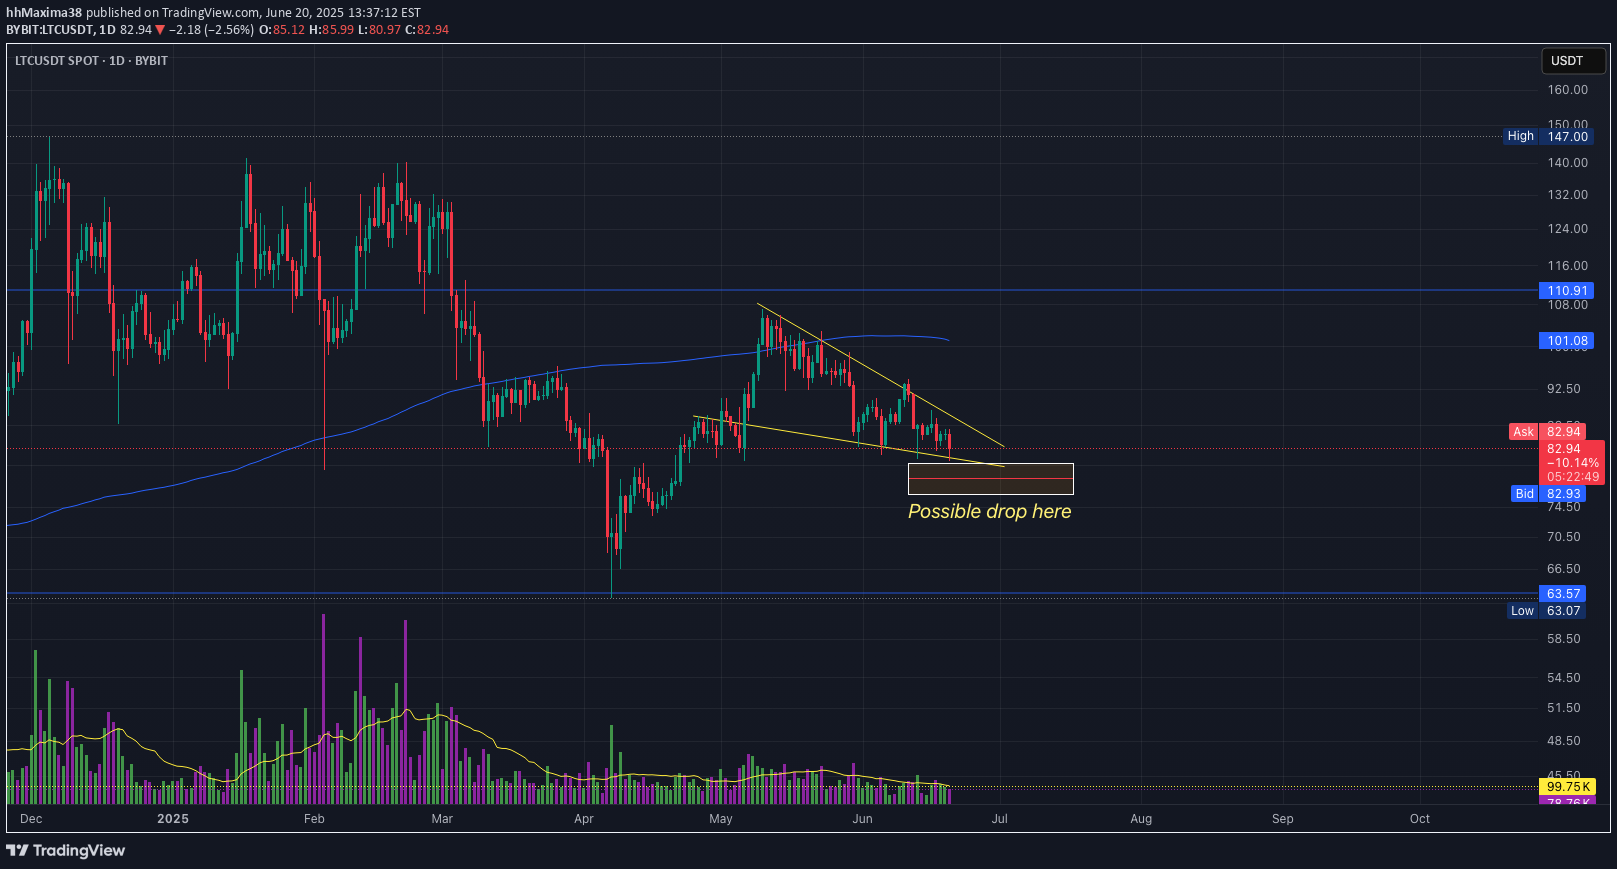
I’m gonna try to keep it short (try, lol). If you’re new here or just stumbled on this, here’s what you need to know: LTC is the King of Pain… and the Prince of Parabolas. It’s one of the hardest coins to hold — maybe the hardest. It’ll test your patience, shake your conviction, and make you doubt everything... right before it delivers. Looking at the chart, LTC printed a bearish head-and-shoulders pattern. But guess what? That’s PROBABLY the final trap — the one that triggers those explosive moves right after... the start of the parabolic season. In my humble opinion, yeah — we MIGHT still drop more depending on what BTC does. But if you’re reading this and wondering what things look like before a big breakout — well, it’s exactly this: Ugly charts, bearish structures, everyone doubting… and then boom — a new beginning. A rise. That May move from $81 to $107? That was the breakout. What we’re in now? It’s the bear trap. What comes next? Should be something we’ve never seen before. I’ll leave it at that. Some fundamentals: LTC: Hash-rate? Went parabolic — price hasn’t caught up yet. Top 5 most used digital assets for moving value (by volume). Born in 2011. 100% uptime. Still standing, still in the top 20. Survived it all. Only 84M LTC will ever exist. Scarcity is real. 78% of LTC addresses are holding for over a year. They’re not selling cheap. MWEB = optional privacy. LiteVM = next-gen programmability for LTC. Oh, and don’t forget: potential ETF approval. If there’s one digital asset with a real shot — it’s LTC. Already declared a commodity by the CFTC. Over 7 years of consolidation. If you zoom out to the monthly+ timeframe, all the bull and bear noise looks like one big sideways base. Just to name a FEW. Absurdly undervalued. Criminally underperforming.
hhMaxima38
Bitcoin, we have to talk !

FIRST AND FOR MOST, CONGRATS EVERYONE ON 100K ! Now, I don’t even know what to say, honestly. Right now, we’re in a bit of a situationship with Bitcoin. You see those two trendlines (red and green)? Yeah, they’re a problem. Both are drawn from the 2017 market cycle peak and the two 2021 market cycle peaks. (We can argue all day about which one was the real top, but honestly, that’s irrelevant in this situation.) The real question is: what makes a trendline valid? A valid trendline needs to touch three points, right? And here’s the catch—we can argue that these trendlines are missing that third peak to be considered valid. Exactly. My point is that we might actually be making that third peak right now. If that happens, the trendline gets validated, and we’d have—ugh, I hate to say it—a market cycle top. In the best-case scenario, it’s just a local top. The volume has been decreasing on the daily chart since we first breached 100k. This suggests there isn’t much conviction behind the slow grind higher we’ve been seeing. but hey its a grind i'll take it. But nothing is guaranteed. Let’s just watch and tread carefully. P.S. ETH hasn’t hit a new ATH yet, so I’m not saying it’s game over for the market. But for Bitcoin? Yeah, it might be. how and ETH is not even challenging the ATH , I don’t know. Can Bitcoin slice through them like they don’t even exist? Yes, it absolutely can. "That's it, that's the idea" - Good night !
hhMaxima38
SUI, Just imagine

This chart is for imagination purpose only. if the October to march season hit, we could very well imagine this. The fractal on the chart comes from the previous move of October 23" to February 24". 27 million holders Just imagine, that's all. "That's it, that's the idea" - Good night !
hhMaxima38
Hello From the Other Side Of the Trendline !

We broke out, we're busting out, we're about to rocket But man it is a historic break out, dating back to 2017 peak Now how far the sentiment will take us Levels to watch are on the chart We shouldn't forget that XRP has a big market cap, Do not hope for a 20x or even a 10x Other than that, Send it 🚀 See you up there ! "That's it, that's the idea" - Good night !
hhMaxima38
Sui, sliced the Butter

Sui, sliced the Butter Sui, We got the butter We need the bread now To get to the mouth See the chart above for levels Volume increasing significantly Check my other post below "Sui, The poseidon of the seas" "That's it, that's the idea" - Good nightWe got the bread now, let's head to the mouth shall we. PS: we may or may not need to spread the butter on the bread and consolidate for a bit before heading to the mouth.I'm Back, and our sandwich is about to be eaten. Again we sliced the butter, we got the bread and we spread the butter with a double bottom. Now we got to the mouth. Just so you know beyond the mouth is uncharted territory. Caution is advised. See you up there again ! That's it, that's the idea" - Good night !
hhMaxima38
SUI, the poseidon of the seas

SUI, SUI, it falls like a water-fall and trend up like a tsunami. Breakout successful of the recent downtrend from $2 Aggressive recovery after an 80% drop If we break $1.17 we should be looking north of $2.5 somewhere close to or $3 Will the earthquake break $1.17 and a tsunami induces taking us to $3 ? let's see ! Team behind = Ex meta engineers Tokenomics are not the best but we can live with that 22 million holder ! Solid project with potential See you up there, somewhere ! "That's it, that's the idea" - Good night !
Disclaimer
Any content and materials included in Sahmeto's website and official communication channels are a compilation of personal opinions and analyses and are not binding. They do not constitute any recommendation for buying, selling, entering or exiting the stock market and cryptocurrency market. Also, all news and analyses included in the website and channels are merely republished information from official and unofficial domestic and foreign sources, and it is obvious that users of the said content are responsible for following up and ensuring the authenticity and accuracy of the materials. Therefore, while disclaiming responsibility, it is declared that the responsibility for any decision-making, action, and potential profit and loss in the capital market and cryptocurrency market lies with the trader.