
hassanshahjehan
@t_hassanshahjehan

What symbols does the trader recommend buying?
Purchase History
پیام های تریدر
Filter
Signal Type
hassanshahjehan
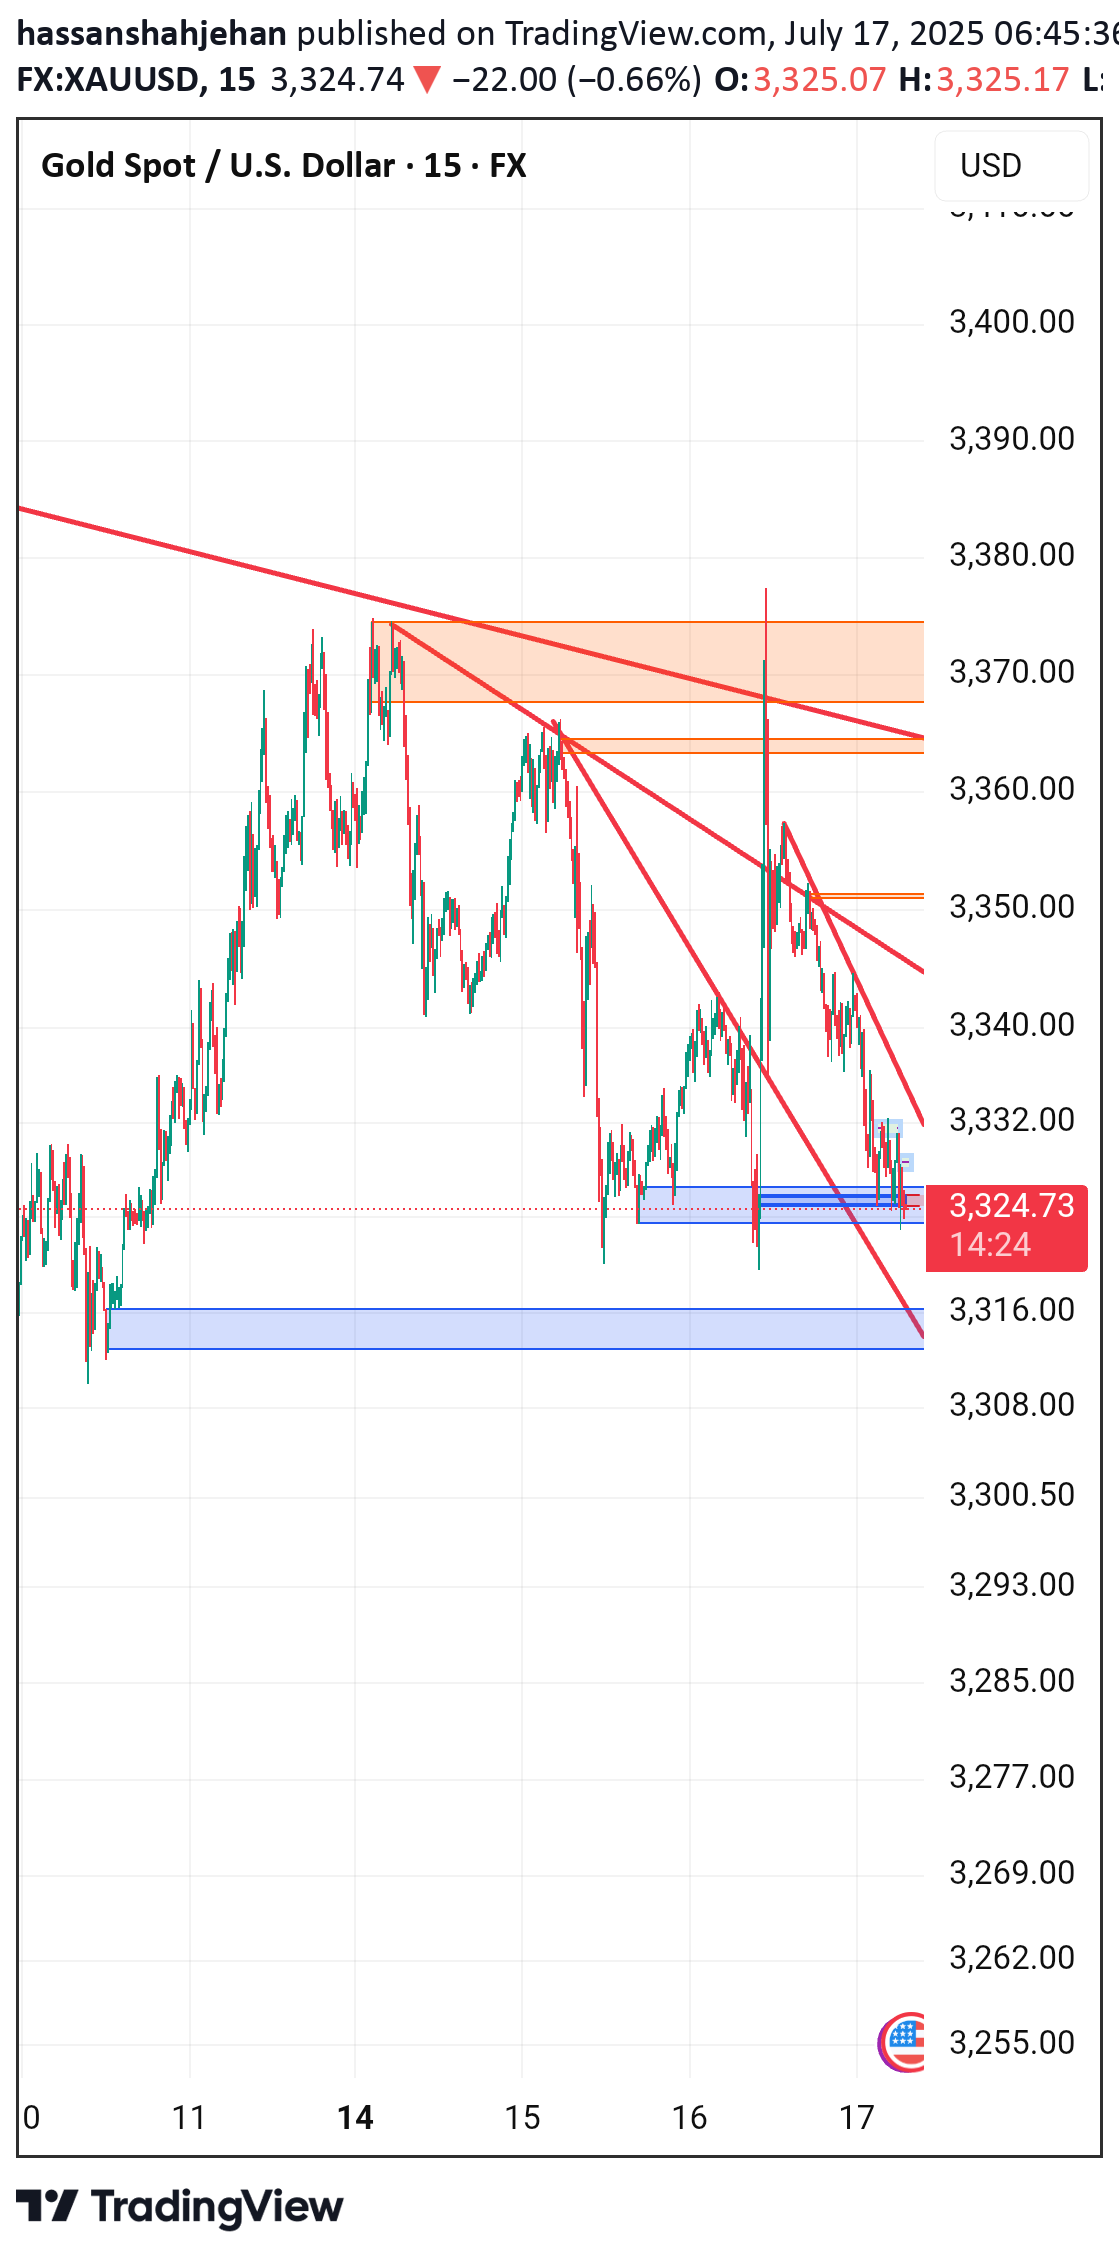
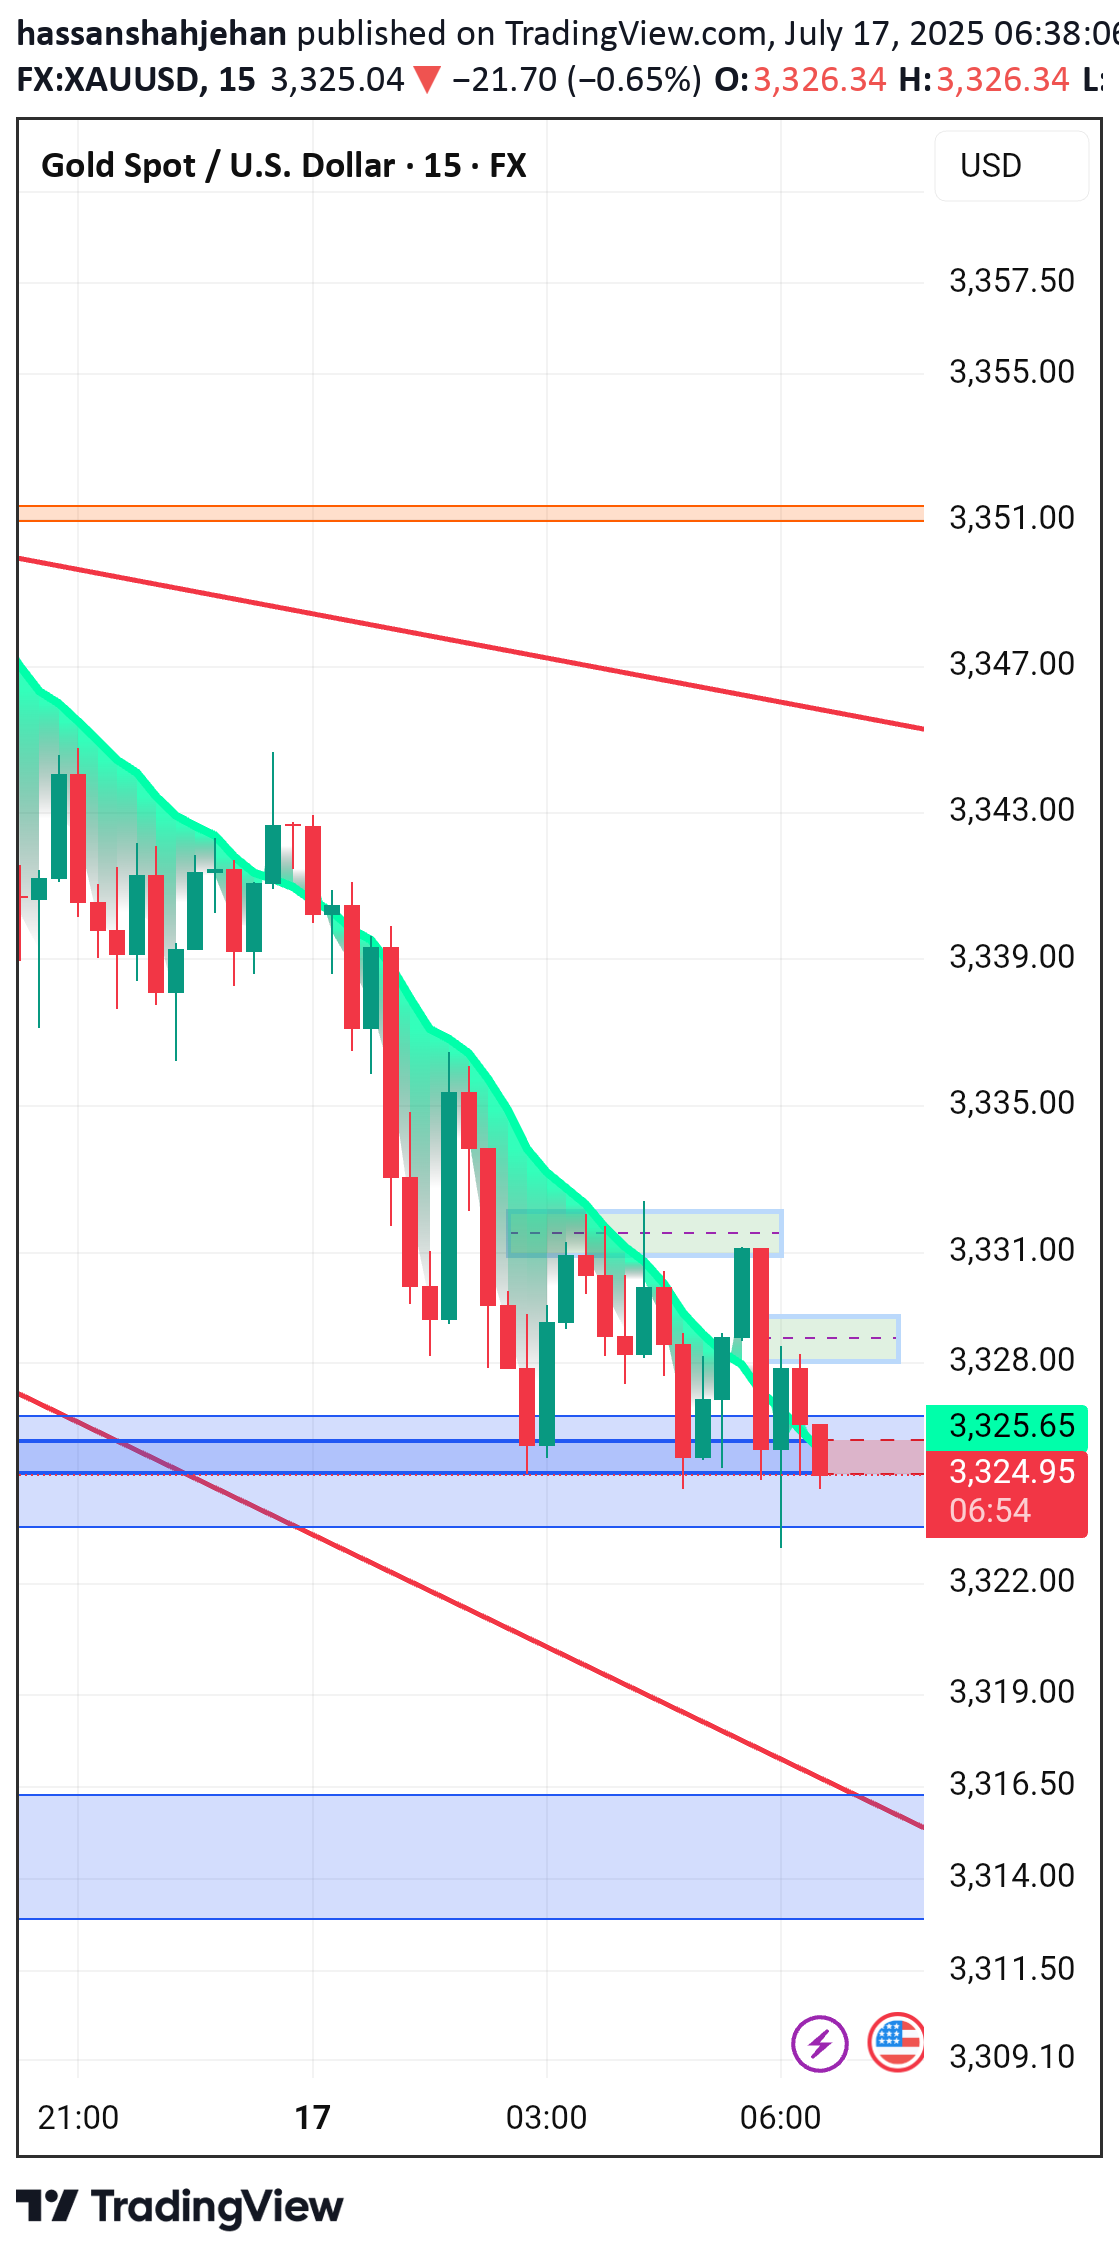
🔴 Resistance Zones: 3,370–3,375: Strong supply zone (highlighted in orange). Price has been rejected multiple times here. 3,350–3,355: Minor resistance, also aligned with a descending trendline (shorter-term bearish structure). 🔵 Support Zones: 3,322–3,325: Currently holding above this key intraday demand zone. 3,316–3,318: Next major demand zone if current support breaks (highlighted in blue). 📉 Trend Structure: Price is in a downtrend, making lower highs and lower lows. Multiple bearish trendlines are intact. Recent rejection from 3,370 zone with strong bearish momentum. 🔄 Current Price Behavior: Price is consolidating near 3,324, testing the support zone. If this support fails, next clean drop likely toward 3,316. --- ✅ Trade Signal for Today Bias: Bearish (Short) 🔻 Entry (Sell): Sell below 3,322 (on 15-min candle close below the blue zone) 🎯 Targets: 1. TP1: 3,318 2. TP2: 3,312 🛡️ Stop Loss: SL: Above 3,332 (last minor structure high) --- 🔁 Alternative Buy Scenario (Aggressive Intraday Long) Only valid if strong bullish engulfing forms above 3,325 support. 🔼 Buy above: 3,327 (confirmation candle) TP1: 3,335 TP2: 3,345 SL: Below 3,321 ⚠️ Note: This buy is counter-trend, so take with smaller size or avoid unless momentum shifts. --- 🧠 Summary Main Play: Follow the bearish trend and wait for a clean break below 3,322. Avoid buying unless you see strong demand reaction with volume from the current blue zone.
hassanshahjehan
If Gold breaks the orderblock at 3318, the the trend is SELLING. Target: 3311 and 3300. If the Demand Zone is supported, (3318-24) Go for BUYS. Target: 3332 and 3342
hassanshahjehan
Entry: 3355:66 SL: 3369 TP: 3341 (continue unless any bullish pattern emerged)
hassanshahjehan

The current price action suggests: Entry: 3367 SL: 3358 (Mitigation of 15mins FVG) Tp: 3390: (OB-). If breaks it, next strong OB at 3400.
hassanshahjehan

📉 Gold Price Analysis: Bearish Outlook Deepens as Key Demand Zone Faces Pressure (June 29, 2025)Gold (XAU/USD) has shown significant bearish momentum in recent days, with clear signals of institutional distribution and strong supply zones keeping the bulls under pressure. Let's break down the price action using a combination of Smart Money Concepts (SMC), supply and demand zones, and classic market structure.---📊 Current Price SnapshotInstrument: Gold (XAU/USDCurrent Price: $3,273.40Timeframe: 30 mins (intraday swing structure)Bias: Bearish until structure shifts---🔍 Market Structure BreakdownGold has maintained a bearish market structure over the past several sessions. This trend is supported by:A series of Lower Highs (LH) and Lower Lows (LL)Multiple Breaks of Structure (BOS) confirming bearish continuationFailed Change of Character (CHoCH) attempts that could not sustain bullish momentumNotably, the most recent LH occurred around $3,356, followed by a steep drop to form a new LL near $3,273, right at a major demand zone.---🟥 Key Supply Zones (Resistance)🔺 Zone 1: $3,355 – $3,365Labeled as a Strong Supply ZonePrevious liquidity grab occurred here, followed by aggressive sellingClear rejection and BOS to the downside confirm institutional presence🔺 Zone 2: $3,321 – $3,335A minor but significant supply zone acting as intraday resistanceMultiple rejections from this area during pullbacksAligns with a descending trendline drawn from the recent highs---🟦 Key Demand Zone (Support)🟦 Zone: $3,245 – $3,273Labeled as a Key Demand ZonePrice is currently consolidating at the top of this zoneReaction here will determine whether bulls can gain ground or if further downside is imminent---🧠 Smart Money Concepts In ActionBOS (Break of Structure) has repeatedly occurred to the downside — these are institutional footprints of bearish intent.CHoCH (Change of Character) attempts have failed to hold, reinforcing bearish pressure.Liquidity has been swept above the $3,355 level, suggesting that the smart money is now aiming for liquidity below the demand zone.---🔮 Forecast Scenarios📉 Primary Bearish ScenarioIf price breaks below the $3,245 level, expect a strong continuation downward.Potential downside targets: $3,220, and ultimately $3,200Traders may look for short entries on retests of the $3,321–$3,335 supply zone📈 Alternate Bullish Reversal ScenarioA valid CHoCH and bullish BOS above $3,321 could signal a reversalIf that happens, watch for a rally toward $3,345 and possibly another test of the $3,355–$3,365 supply zoneThis would require strong bullish volume and confirmation candles at the demand zone---📌 Key Technical LevelsLevel TypePrice RangeNotesSupply$3,355–$3,365Strong institutional resistanceSupply$3,321–$3,335Mid-level supply / pullback zoneDemand$3,245–$3,273Key support; current price areaSupport~$3,270Consolidation zone equilibriumTarget~$3,200Bearish continuation target---✅ Trading Strategy SuggestionsShort Bias: Sell from $3,321–$3,335 zone if price rejects with bearish candles or imbalanceLong Bias (Cautious): Only consider longs if BOS + CHoCH are confirmed above $3,321, with high-volume candles---📘 Final ThoughtsGold remains in a bearish environment, with institutional footprints signaling a potential continuation toward lower levels. The price action around the $3,245–$3,273 demand zone will be crucial in determining the next directional move.Until a confirmed structural reversal occurs, the path of least resistance remains downward. Traders should watch for liquidity grabs, rejection candles, and structural confirmations to frame their entries and exits.---Stay tuned for further updates and real-time price action breakdowns. Risk management is key — trade safe and smart! 💼📉
hassanshahjehan

Support Zones:Short-Term:2,882.62: This price level has acted as a support in recent price action. The price bounced off this level, indicating buying interest.2,860.00 - 2,840.00: This zone also appears to be a short-term support area. The price consolidated in this range before the recent move upwards.Long-Term:2,783.57: This level appears to be a significant long-term support. It's a lower swing low on the chart.2,760.00 - 2,740.00: This zone also looks to be a longer-term support zone.Resistance Zones:Short-Term:2,930.73: This is the most immediate short-term resistance. The price was strongly rejected at this level, as shown by the long upper wick on the candlestick at that price.2,906.45: A minor resistance level where the price previously encountered selling pressure.Long-Term:3,000.00 - 3,020.00: This is a significant long-term resistance zone. The price faced strong rejection in this area, indicating a potential selling zone.Trend Analysis:Overall: The chart suggests a potential uptrend after a bounce from the long-term support zone around 2,783.57.Recent Price Action: The price has broken above short-term resistance at 2,882.85 and is currently attempting to move higher. However, the strong rejection at 2,930.73 suggests significant selling pressure at that level.Potential Scenarios:Bullish: If the price can break and hold above 2,930.73, it could continue its uptrend towards the long-term resistance zone around 3,000.00 - 3,020.00.Bearish: If the price fails to break above 2,930.73 and falls below 2,882.62, it could retest the short-term support zone around 2,860.00 - 2,840.00. A break below this zone could lead to a retest of the long-term support at 2,783.57.Follow on telegram for accuracy and timely signalsTelegram: OrbitSignalsFX
hassanshahjehan

The chart shows a clear uptrend overall, with a recent pullback.Support and Resistance LevelsPrimary Resistance: Around 2,880.00 - 2,885.00. This is a significant level where the price previously encountered selling pressure and was rejected.Secondary Resistance: Near 2,900.00. This is a psychological level and a potential area of further resistance.Primary Support: 2,850.00 - 2,855.00. This zone aligns with the current price and acted as resistance before, now potentially acting as support.Secondary Support: 2,835.00 - 2,840.00. This level aligns with previous swing lows and could provide further support.Potential Buying Area : 2,850.00 - 2,855.00. This zone is significant because:It aligns with the primary support level.It's where the price previously consolidated before breaking higher.A successful retest of this zone as support could signal a continuation of the uptrend.Follow me for more signals
hassanshahjehan

**Technical Analysis: Gold Spot (XAU/USD) 1-Hour Timeframe** *Key Levels, Liquidity Zones, and Trend Outlook* ---### **Support & Resistance Zones** **Immediate Resistance:** - **2,799.91 - 2,800.00**: Current consolidation upper boundary (BUY level). A breakout here could target **2,820.00**, followed by **2,840.00** (swing high). - **2,820.00 - 2,840.00**: Major resistance zone. A break above 2,840 confirms bullish momentum. **Immediate Support:** - **2,799.61 - 2,780.00**: Current price floor (SELL level). A drop below 2,780 may trigger a slide toward **2,760.00** and **2,740.00** (swing low). - **2,740.00**: Critical support; breach here signals bearish dominance. ---### **Liquidity Zones** - **Above 2,840.00**: Likely liquidity pool where stop losses from short positions cluster. A rally to this zone could trigger a short squeeze. - **Below 2,740.00**: Liquidity zone with stops from bullish traders. A breakdown here may accelerate selling. ---### **Order Blocks** - **Buy-Side Order Block (2,780.00 - 2,800.00)**: If price rebounds from this zone, it reflects institutional buying interest. Hold above 2,780.00 strengthens bullish bias. - **Sell-Side Order Block (2,820.00 - 2,840.00)**: A rejection here suggests heavy selling pressure. Watch for bearish reversals if price fails to close above 2,840. ---### **Trend Analysis** - **Short-Term Trend**: Neutral with slight bullish bias (price up 0.18%). Consolidation between 2,780–2,820 hints at indecision. - **Bullish Scenario**: Break and hold above 2,820.00 opens path to 2,840.00+. - **Bearish Scenario**: Failure to hold 2,780.00 may trigger a drop toward 2,740.00. ---### **Key Takeaways** 1. **Watch 2,800.00**: Immediate pivot zone. A close above/below dictates intraday direction. 2. **Liquidity Hunts**: Bulls need to absorb sells near 2,840.00; bears target 2,740.00 stops. 3. **Order Blocks Define Risk**: Trade reversals near 2,780.00 (support) or 2,820.00 (resistance). *Stay agile—breakouts from this tight range will dictate momentum!* --- **Follow for updates as price approaches critical thresholds.** 🚀📉 *Disclaimer: This analysis is for educational purposes. Trade with risk management.*Pine Script®Pine Script®Pine Script®
hassanshahjehan

Current Price: 97,840Support Level: 95,059Resistance Level: 99,000Next Support Level: 92,200Next Resistance Level: 103,500Bullish Scenario: If the price breaks above the 99,000 resistance level with strong volume, consider entering a long position with a stop-loss order below the 95,059 support level. If the price further breaks above 103,500, adjust your stop-loss accordingly.Bearish Scenario: If the price breaks below the 95,059 support level, consider entering a short position with a stop-loss order above the 99,000 resistance level. If the price further breaks below 92,200, adjust your stop-loss accordingly.Range Trading: If the price remains within the 95,059 - 99,000 range, consider range trading strategies, such as buying at support and selling at resistance.
hassanshahjehan

At the time of writing, Bitcoin is trading at $97,839, down 0.38% on the day.The overall trend appears to be downward, as evidenced by the series of lower highs and lower lows on the chart. There is a clear horizontal support level around $97,000, where the price has found support multiple times in the past. On the other hand, there is a resistance level at $99,000, which has been difficult for Bitcoin to break above.Given the current technical picture, it is possible that Bitcoin could continue its downward trend in the short term. However, the strong support level at $97,000 could provide some resistance to further downside. If Bitcoin manages to break above the resistance level at $99,000, it could signal a potential reversal of the downtrend.Short-term traders could consider shorting Bitcoin at the current price with a stop-loss above $98,000. Long-term traders could wait for a break below the support level at $97,000 before entering a short position. It is important to use appropriate risk management techniques, such as setting stop-loss orders and limiting position size, to protect capital.This analysis is for educational purposes only and should not be considered investment advice. Please consult with a financial advisor before making any investment decisions.It is also important to consider fundamental factors, such as regulatory developments, market sentiment, and macroeconomic conditions, when making investment decisions. Keep an eye on any news and events that could impact Bitcoin's price, such as regulatory announcements, major conferences, and tweets from influential figures.The technical analysis suggests that Bitcoin is currently in a downtrend. However, the strong support level at $97,000 could provide some resistance to further downside. Traders should use appropriate risk management techniques and consider both technical and fundamental factors when making investment decisions.Note: This analysis is based on the provided chart and may not reflect the current market conditions. Please refer to real-time charts and data for the most up-to-date information.
Disclaimer
Any content and materials included in Sahmeto's website and official communication channels are a compilation of personal opinions and analyses and are not binding. They do not constitute any recommendation for buying, selling, entering or exiting the stock market and cryptocurrency market. Also, all news and analyses included in the website and channels are merely republished information from official and unofficial domestic and foreign sources, and it is obvious that users of the said content are responsible for following up and ensuring the authenticity and accuracy of the materials. Therefore, while disclaiming responsibility, it is declared that the responsibility for any decision-making, action, and potential profit and loss in the capital market and cryptocurrency market lies with the trader.