Technical analysis by hassanshahjehan about Symbol PAXG on 7/17/2025

hassanshahjehan
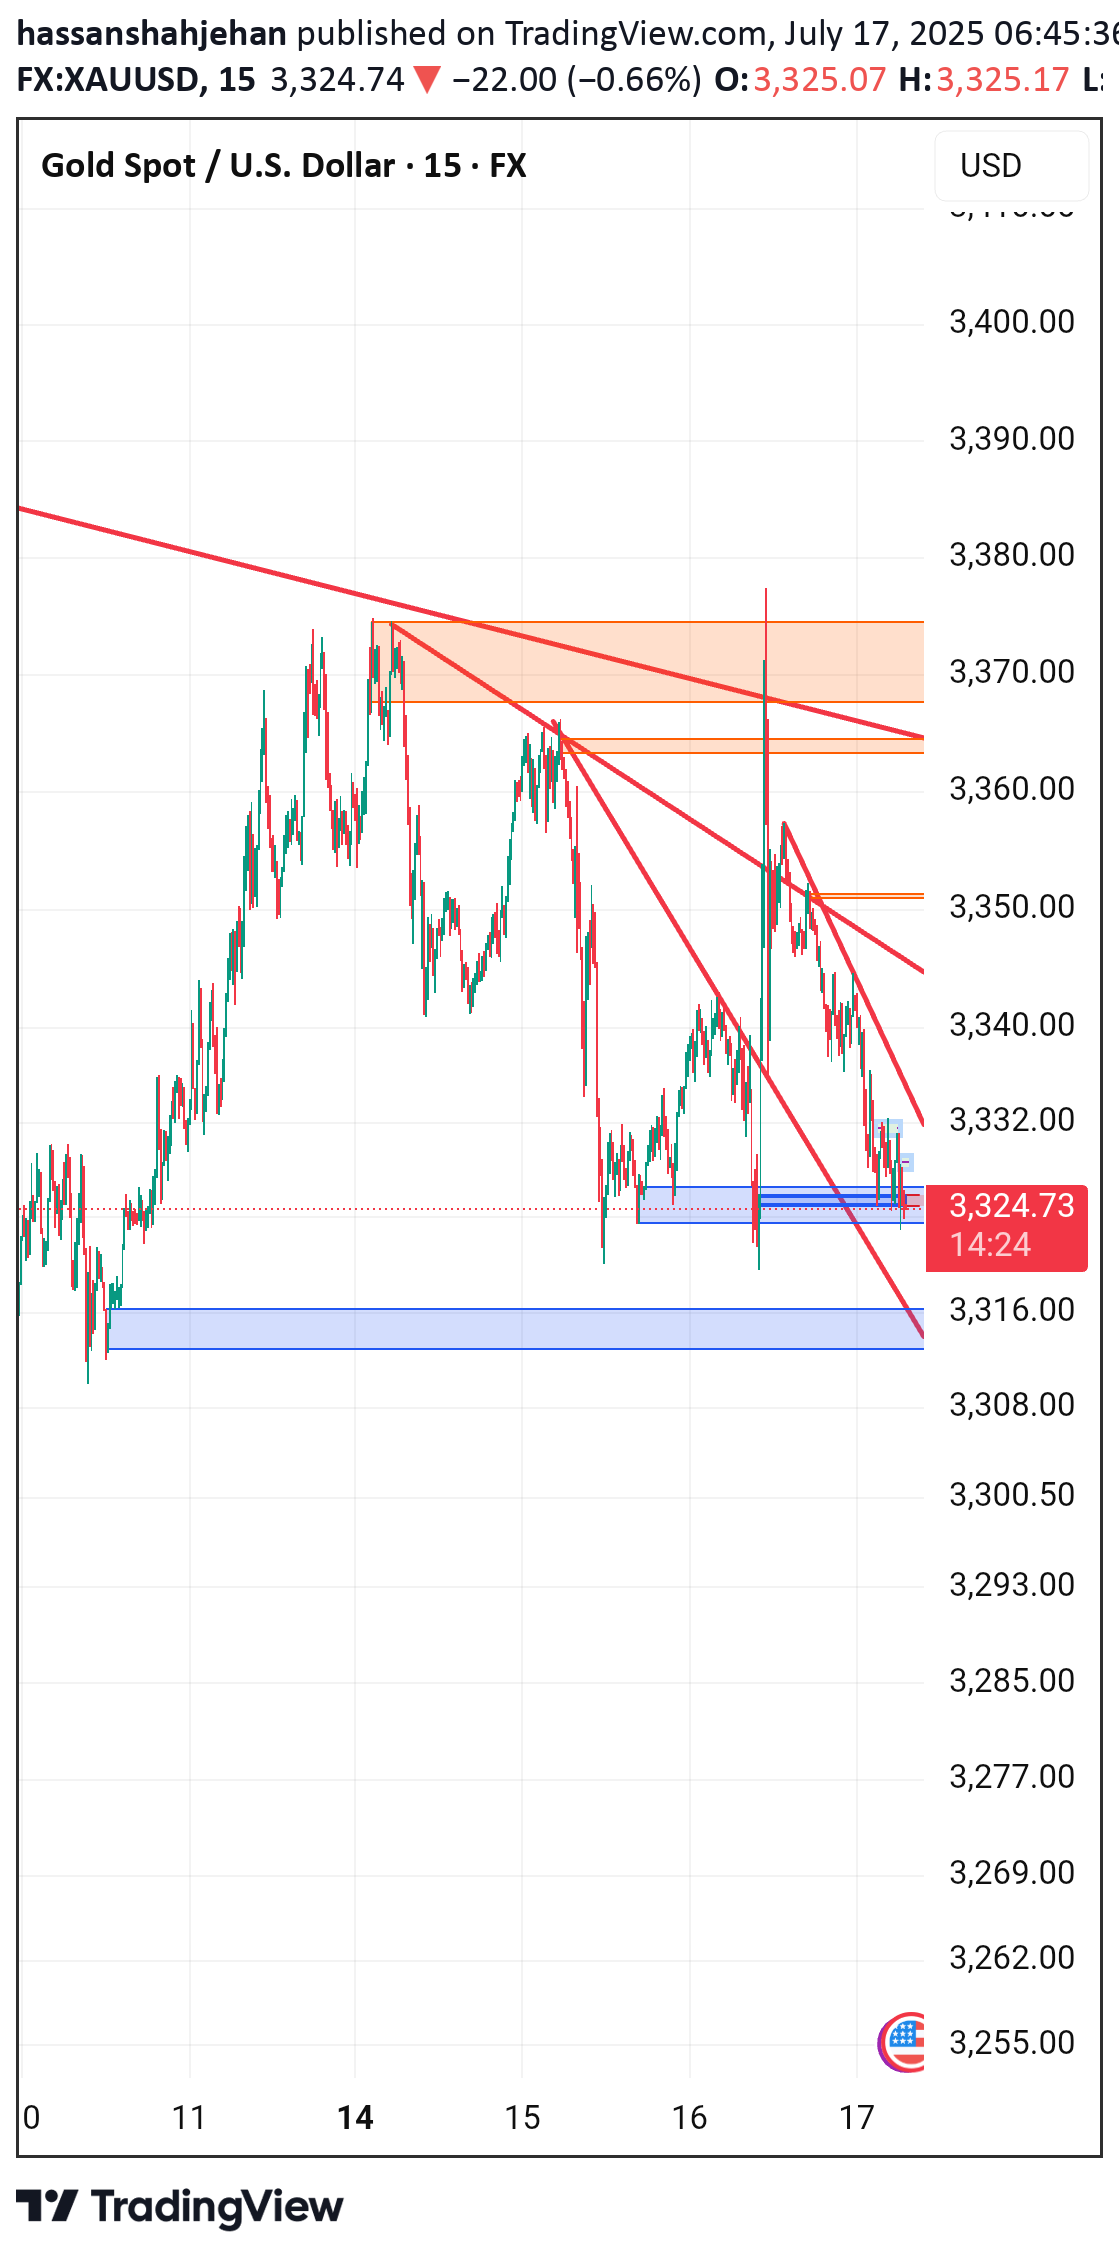
🔴 Resistance Zones: 3,370–3,375: Strong supply zone (highlighted in orange). Price has been rejected multiple times here. 3,350–3,355: Minor resistance, also aligned with a descending trendline (shorter-term bearish structure). 🔵 Support Zones: 3,322–3,325: Currently holding above this key intraday demand zone. 3,316–3,318: Next major demand zone if current support breaks (highlighted in blue). 📉 Trend Structure: Price is in a downtrend, making lower highs and lower lows. Multiple bearish trendlines are intact. Recent rejection from 3,370 zone with strong bearish momentum. 🔄 Current Price Behavior: Price is consolidating near 3,324, testing the support zone. If this support fails, next clean drop likely toward 3,316. --- ✅ Trade Signal for Today Bias: Bearish (Short) 🔻 Entry (Sell): Sell below 3,322 (on 15-min candle close below the blue zone) 🎯 Targets: 1. TP1: 3,318 2. TP2: 3,312 🛡️ Stop Loss: SL: Above 3,332 (last minor structure high) --- 🔁 Alternative Buy Scenario (Aggressive Intraday Long) Only valid if strong bullish engulfing forms above 3,325 support. 🔼 Buy above: 3,327 (confirmation candle) TP1: 3,335 TP2: 3,345 SL: Below 3,321 ⚠️ Note: This buy is counter-trend, so take with smaller size or avoid unless momentum shifts. --- 🧠 Summary Main Play: Follow the bearish trend and wait for a clean break below 3,322. Avoid buying unless you see strong demand reaction with volume from the current blue zone.
