
fred971
@t_fred971

What symbols does the trader recommend buying?
Purchase History
پیام های تریدر
Filter
مقاومت نهایی در حال شکسته شدن است: آیا بازار به اوج جدید میرسد؟
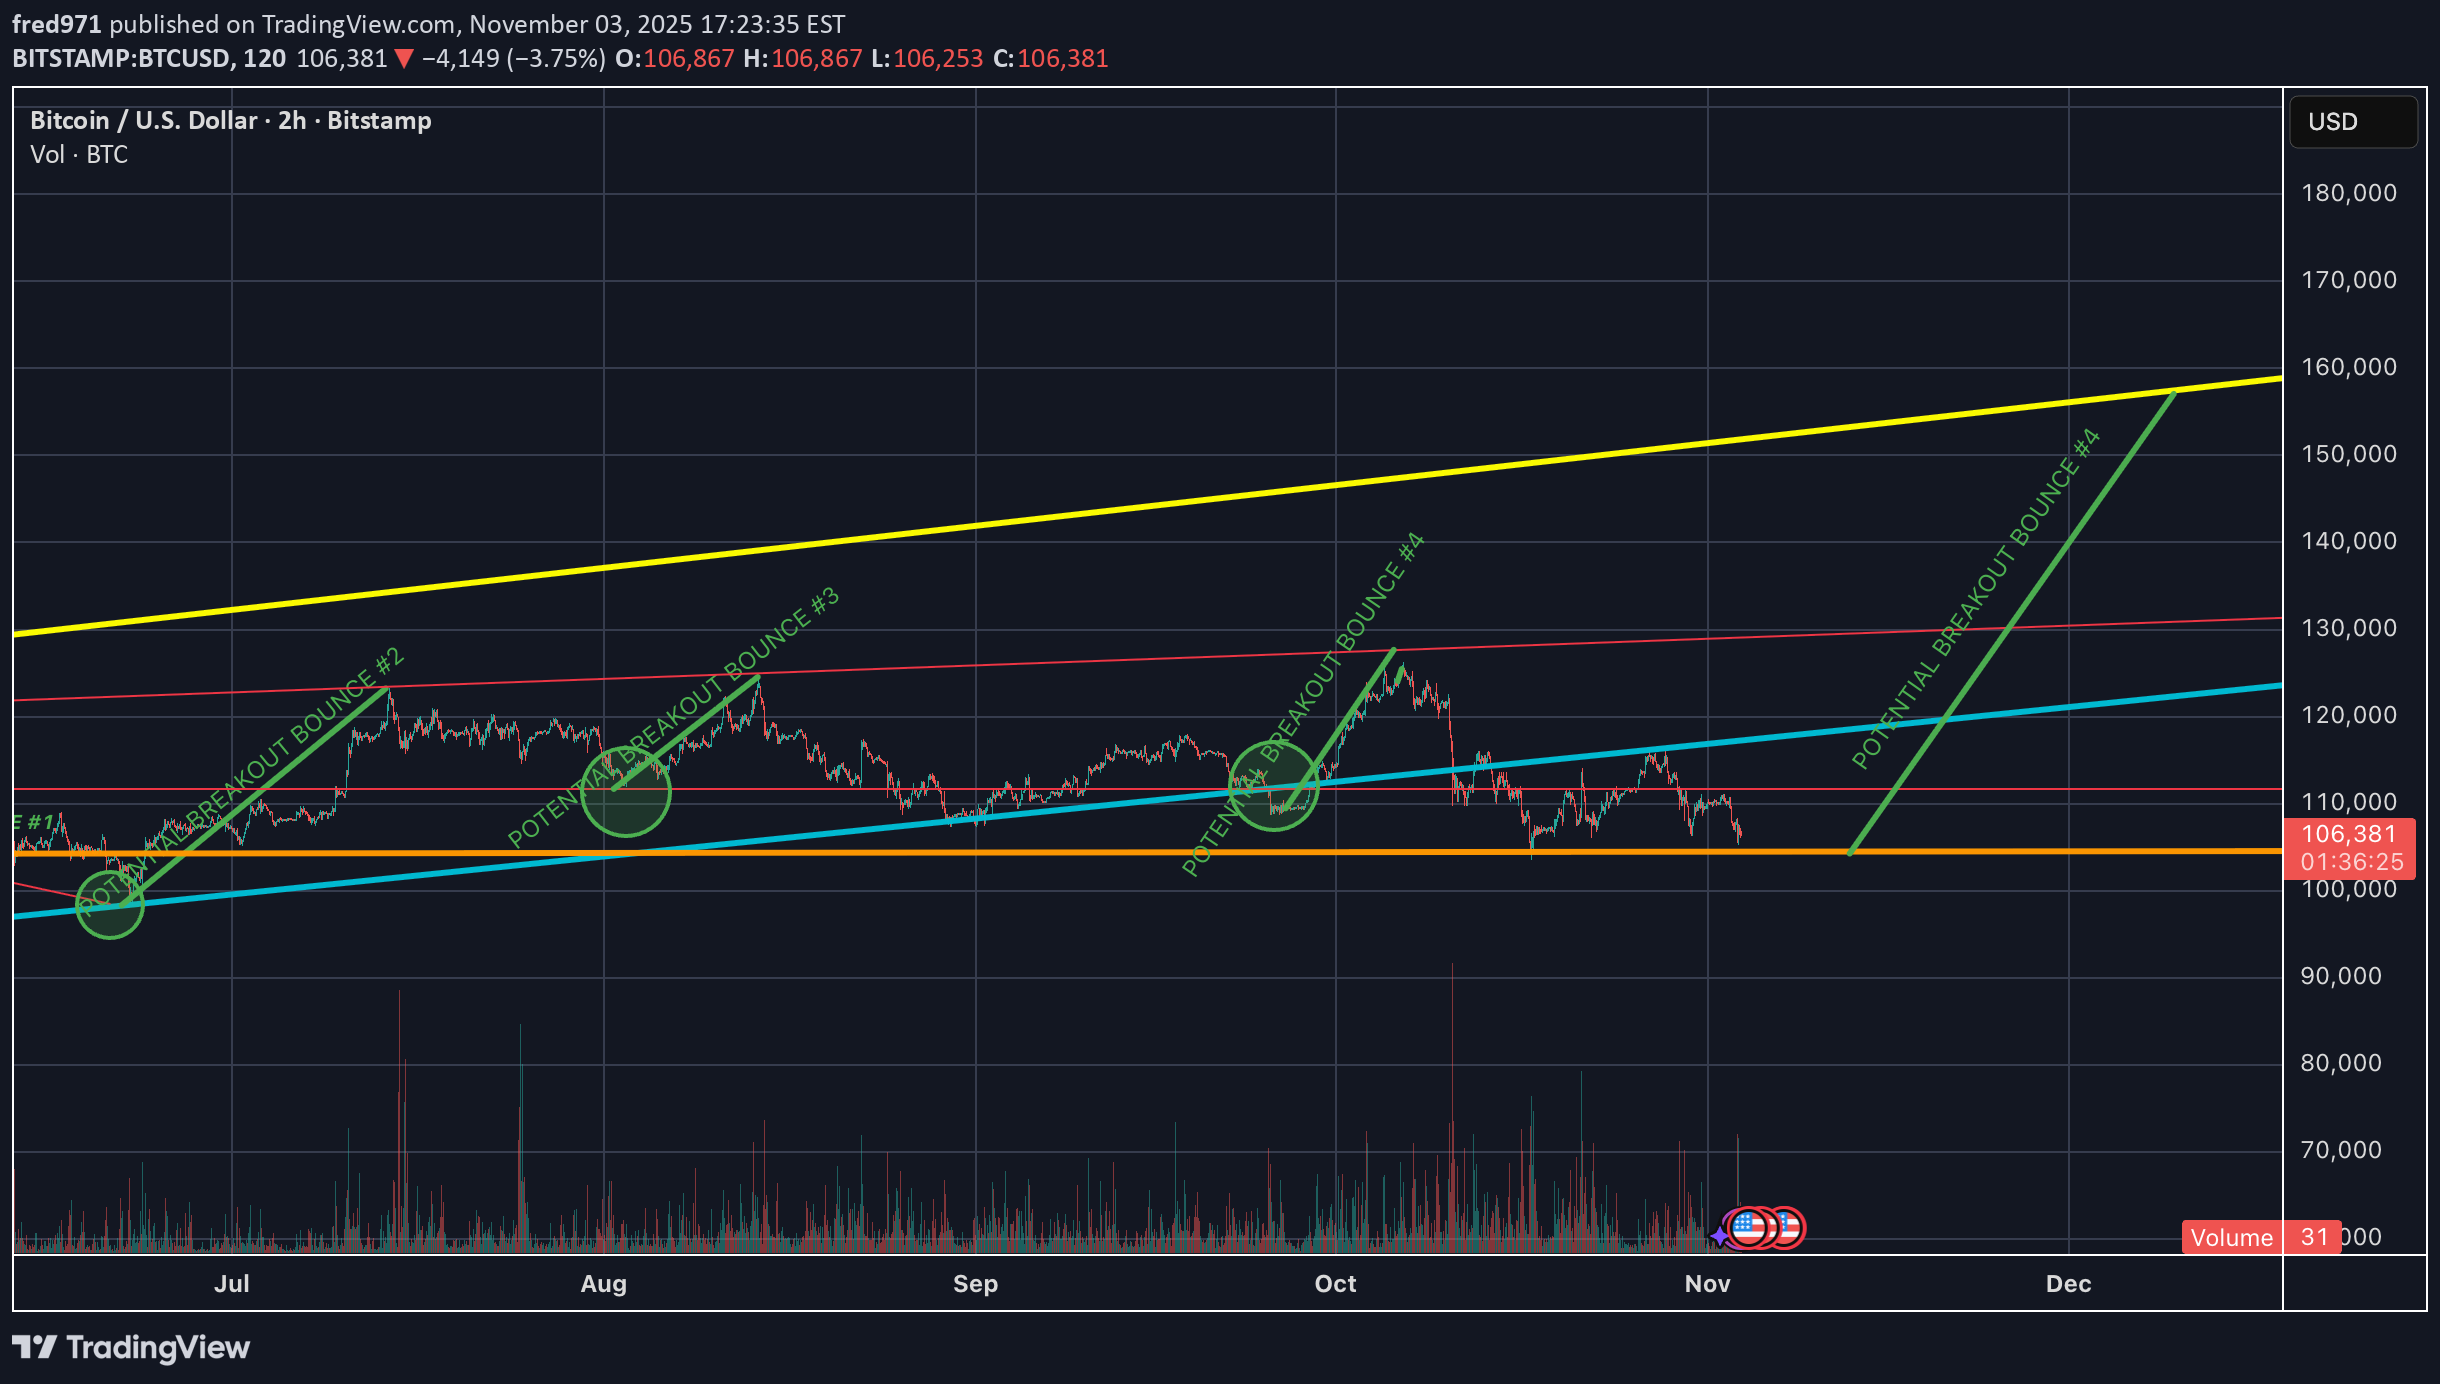
it looks like we about to bounce the "last resistance" or at least one of the last one
آیا بیت کوین واقعاً طبق تحلیل تکنیکال حرکت میکند؟ نقشه راهی که بازار را غافلگیر کرد!
sometimes it feels like reality is following my TA to make the crazy moves… 🌀 Bitcoin has been respecting every key level to perfection — almost like it’s reading the script. We’ve seen clean reactions at support zones, perfect retests on breakout levels, and liquidity grabs that look straight out of a textbook. I think I am ready to trade based on those support and resistance lines... what you think of this beauty?
تحلیل تکنیکال بیت کوین: مسیر صعودی تا سقف ۱۲۸ هزار دلار و هدف نهایی ۱۴۰ هزار!
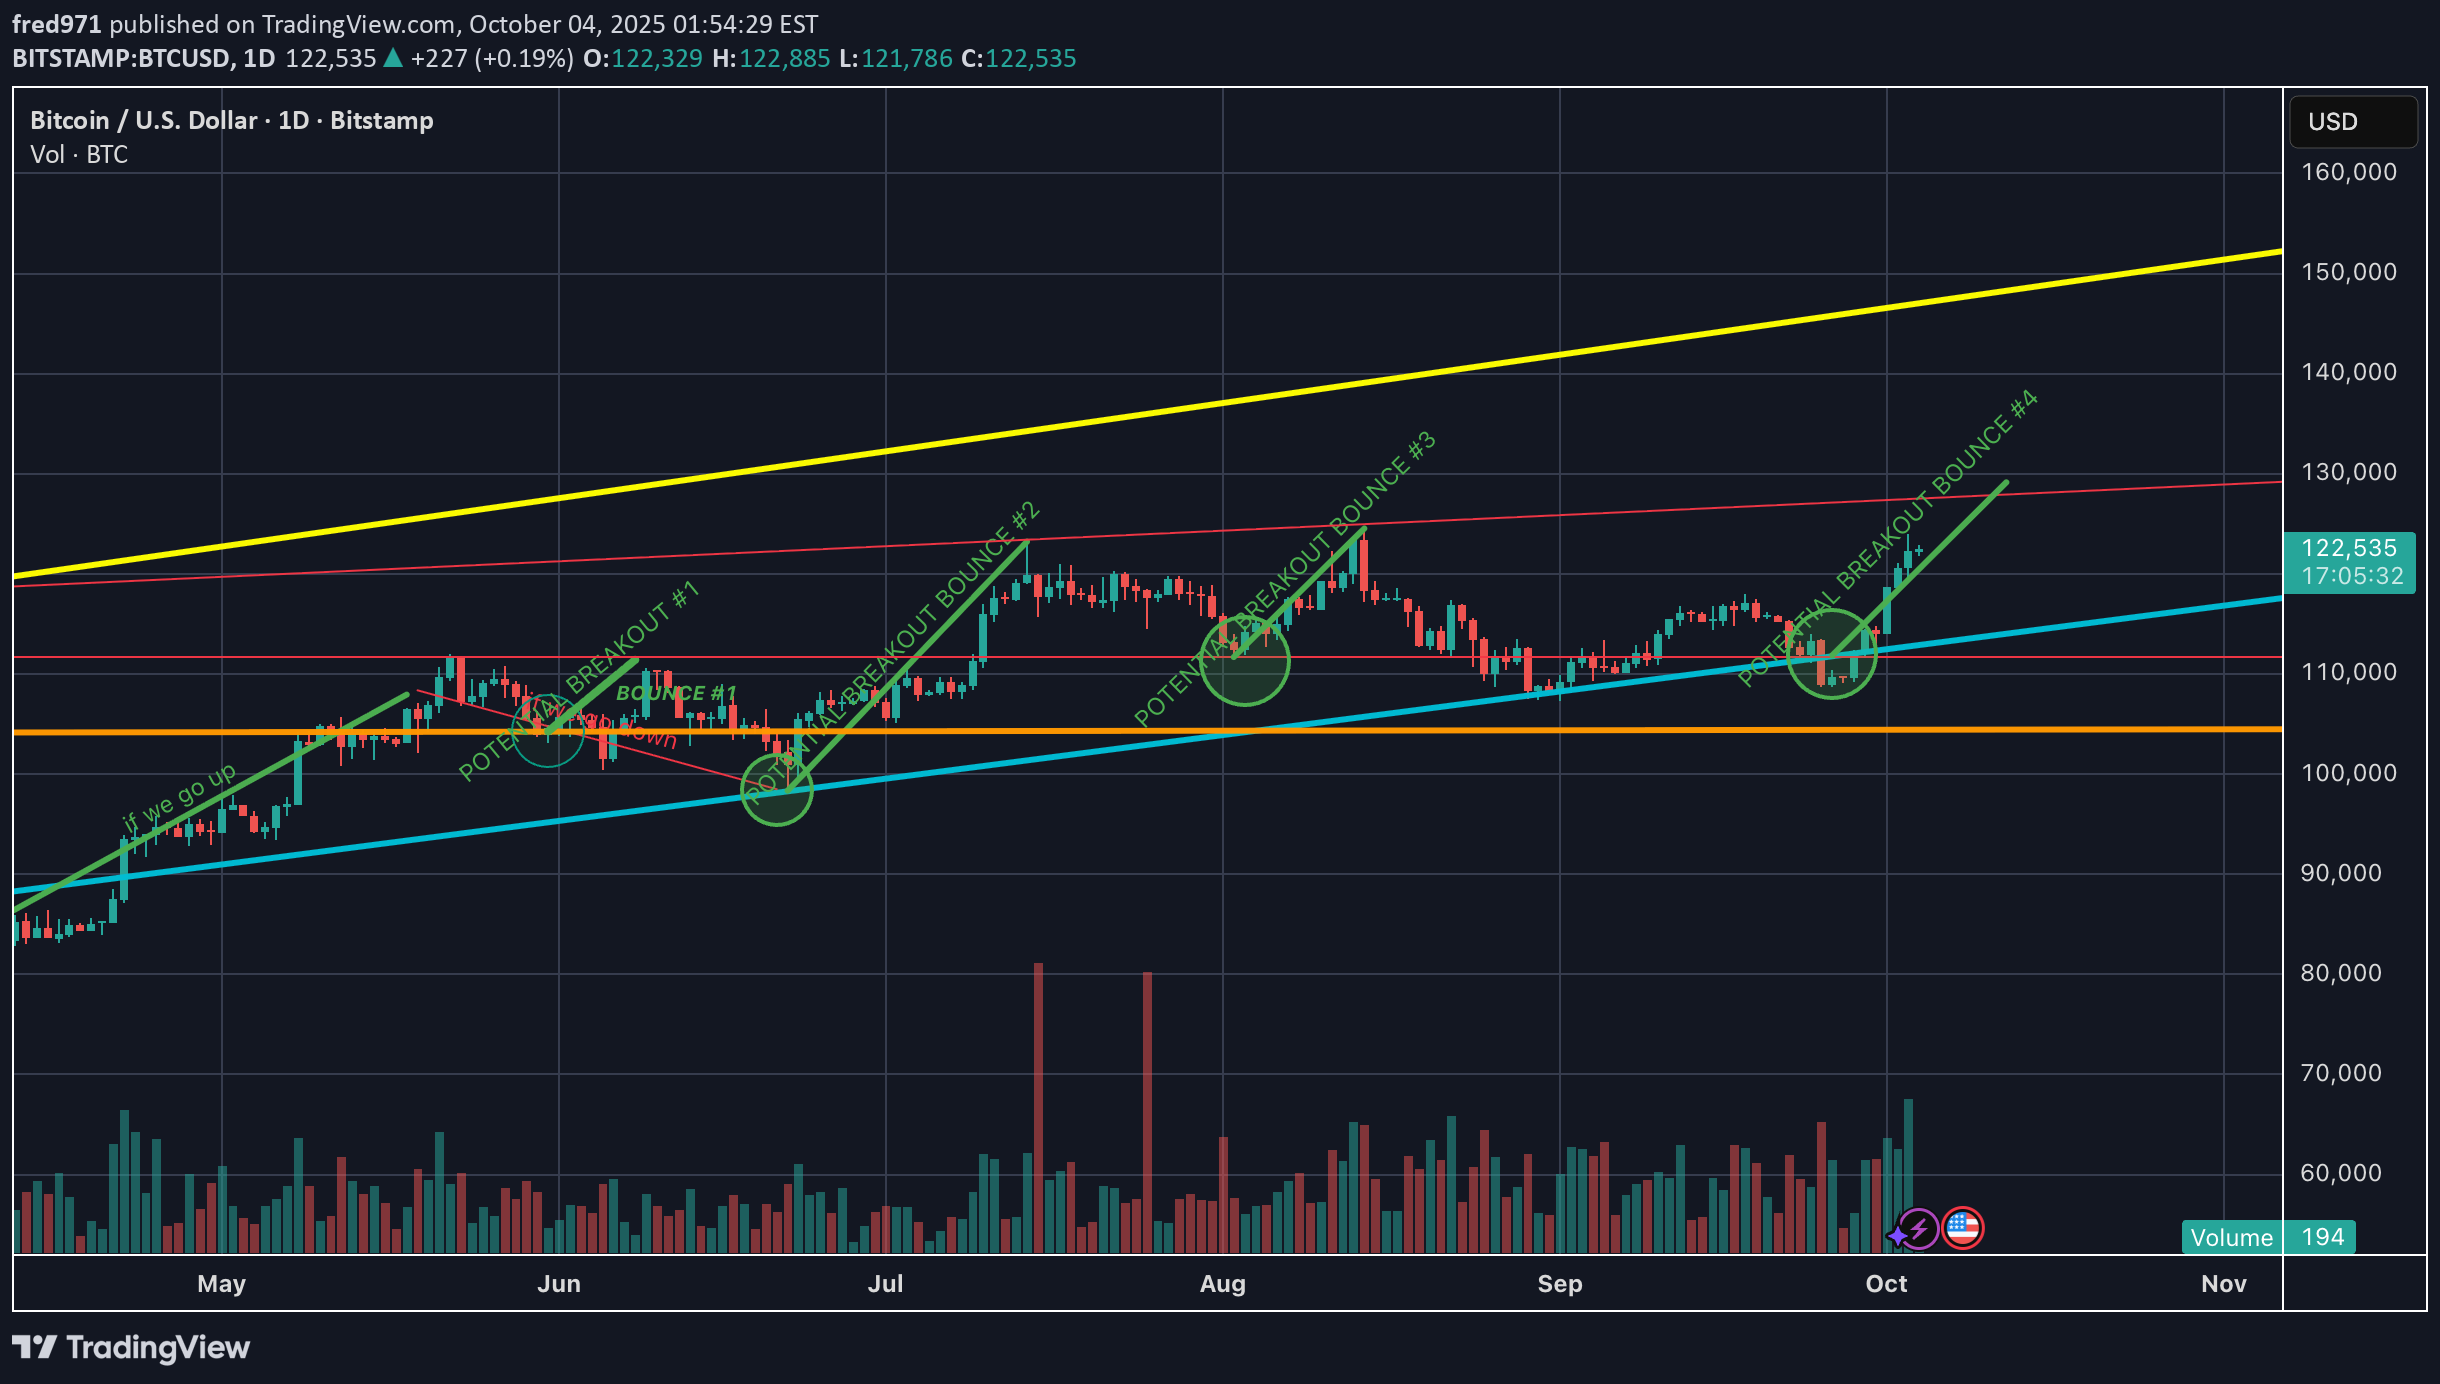
Alright, so let me break it down for you. You see this blue ascending line here? This has been acting as major support for a while now. Every time price came down and touched it, we’ve had a strong bounce — it happened three times before, and now we’re on the fourth one. Right now, Bitcoin is sitting around $122,500, and just like the previous bounces, it’s starting to push back up. If the pattern continues like before, the next logical target is the upper red channel line, which has been a key resistance. That’s roughly in the $126K to $128K range. If we manage to break through that red line with real momentum, then the next big target is this yellow trendline up here. That’s a much larger resistance zone — somewhere around $135K to $140K, depending on how quickly price moves. The volume on this bounce is picking up, which is a good sign. But I’m keeping an eye on that red resistance, because in the past, that’s where rallies have stalled. So in short: Short term, I’m looking for a move toward $126K–$128K. If we break out, then $135K–$140K is on the table. If we fall back below the blue support line, the bullish scenario is off. Pretty clean structure so far — Bitcoin has been respecting these lines almost perfectly.
wow longtime no see!
I haven't checked my graph in a while... and look at that... are we going up as shown??
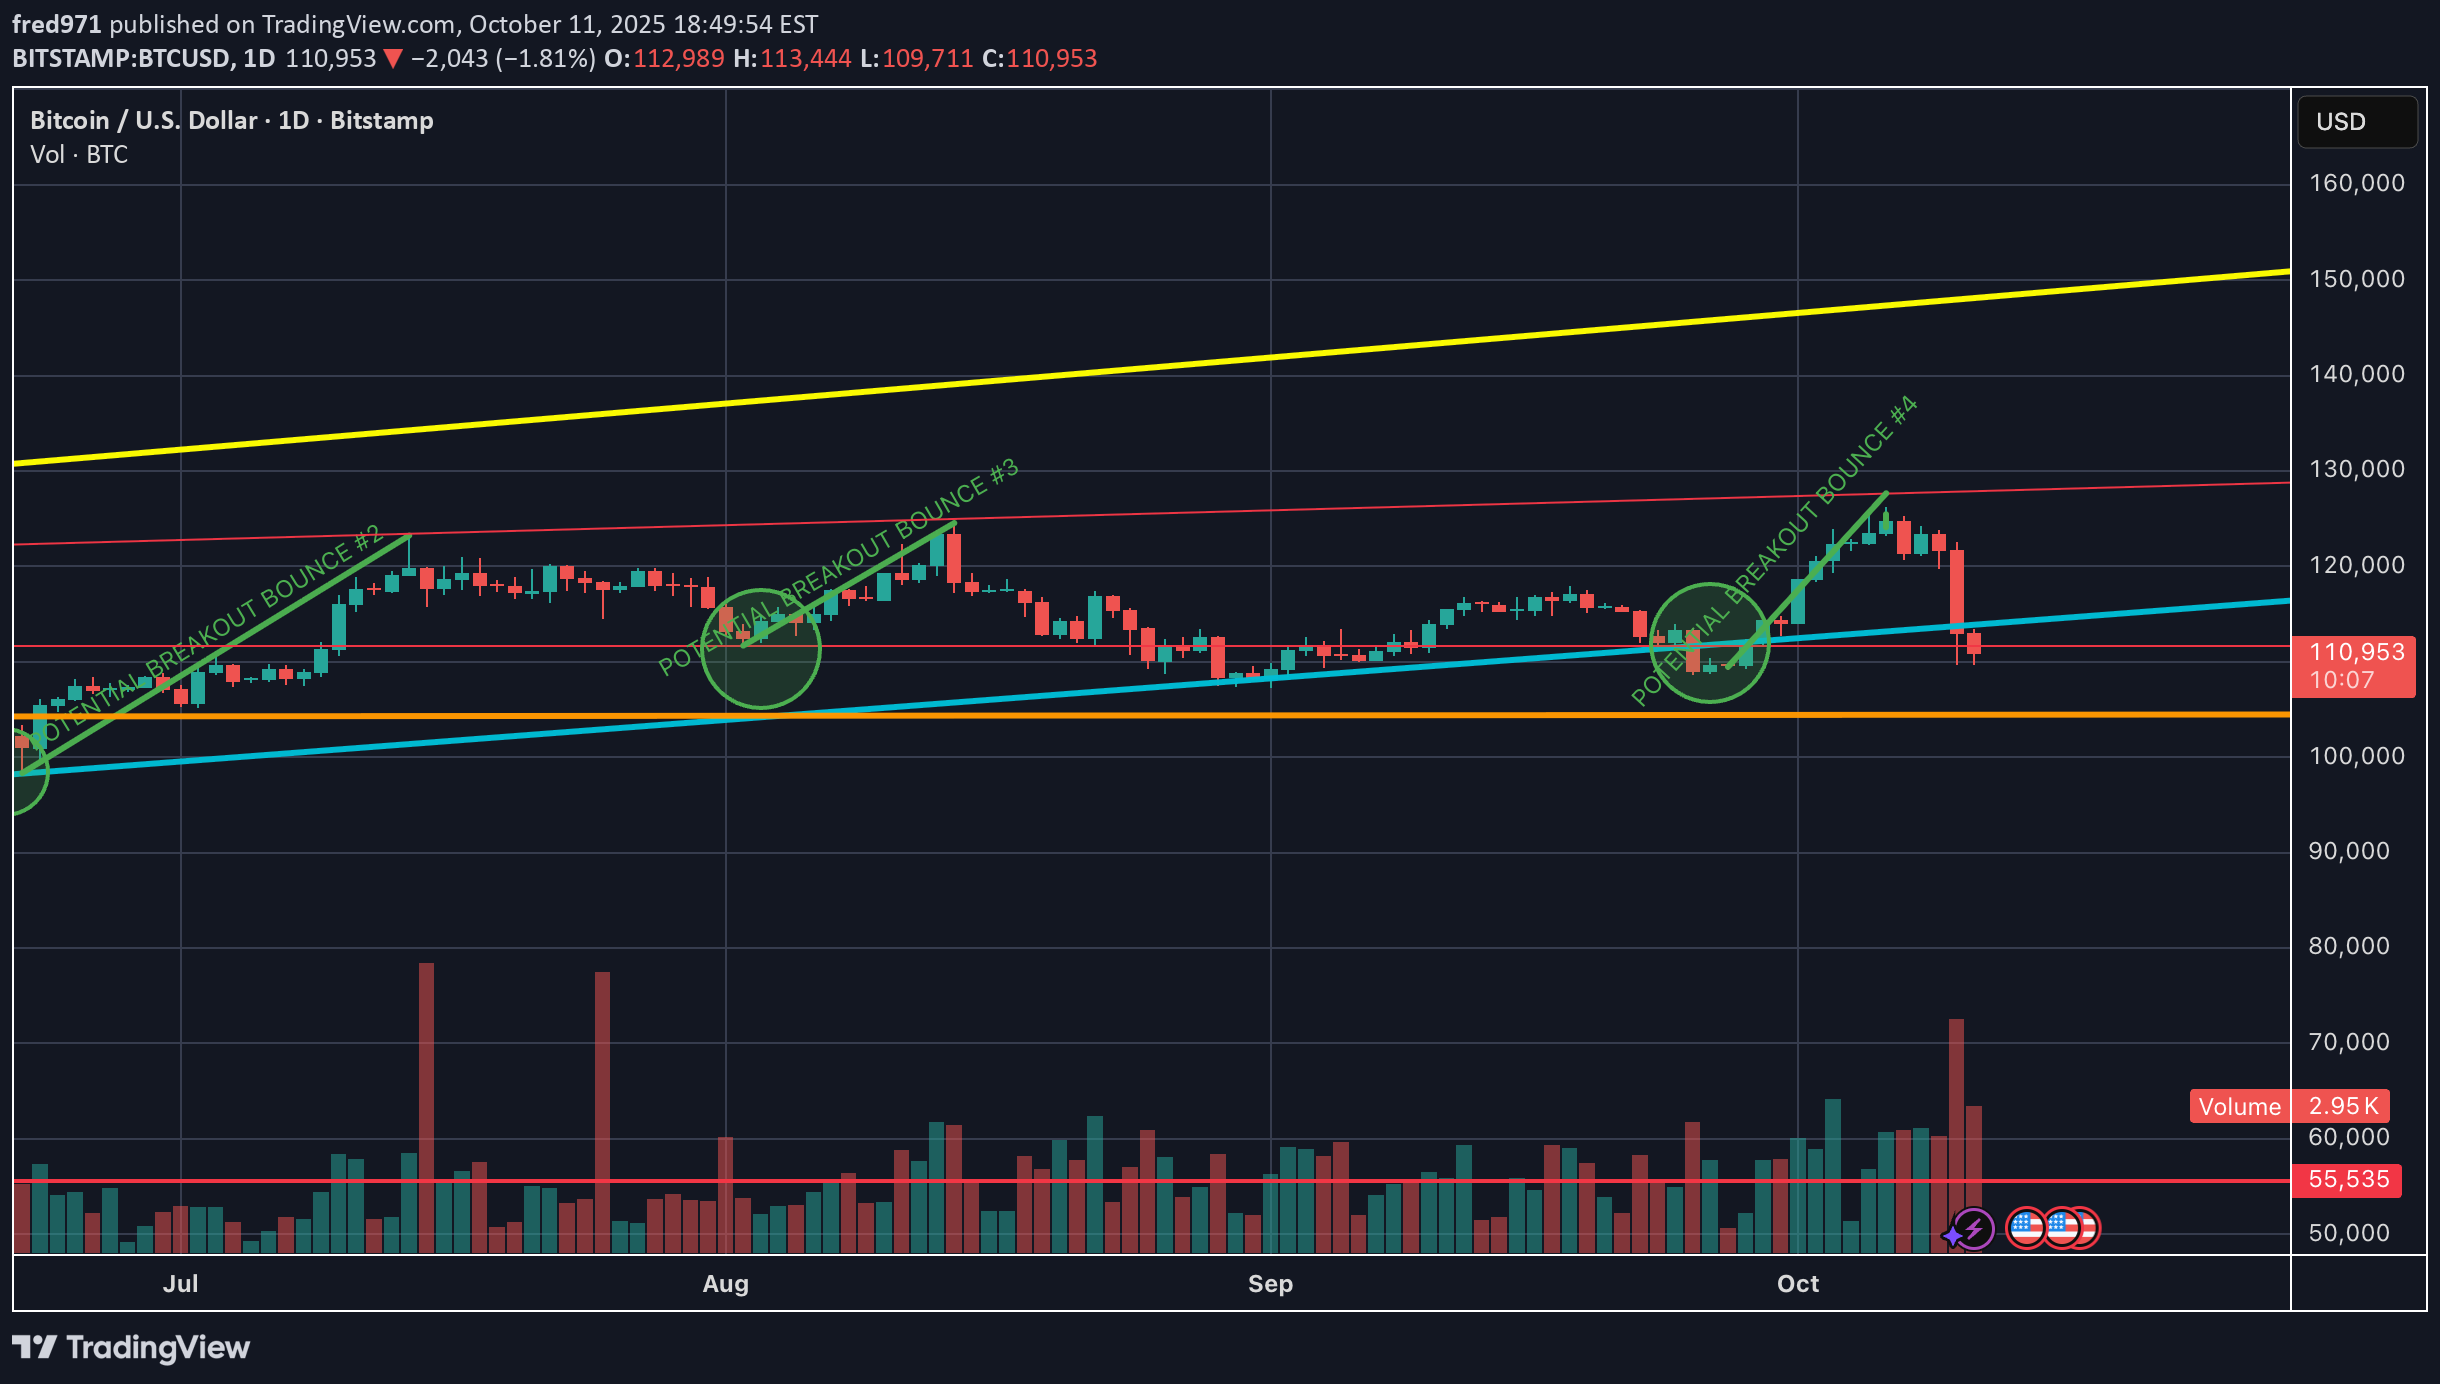
going lower or bouncing on resistance?
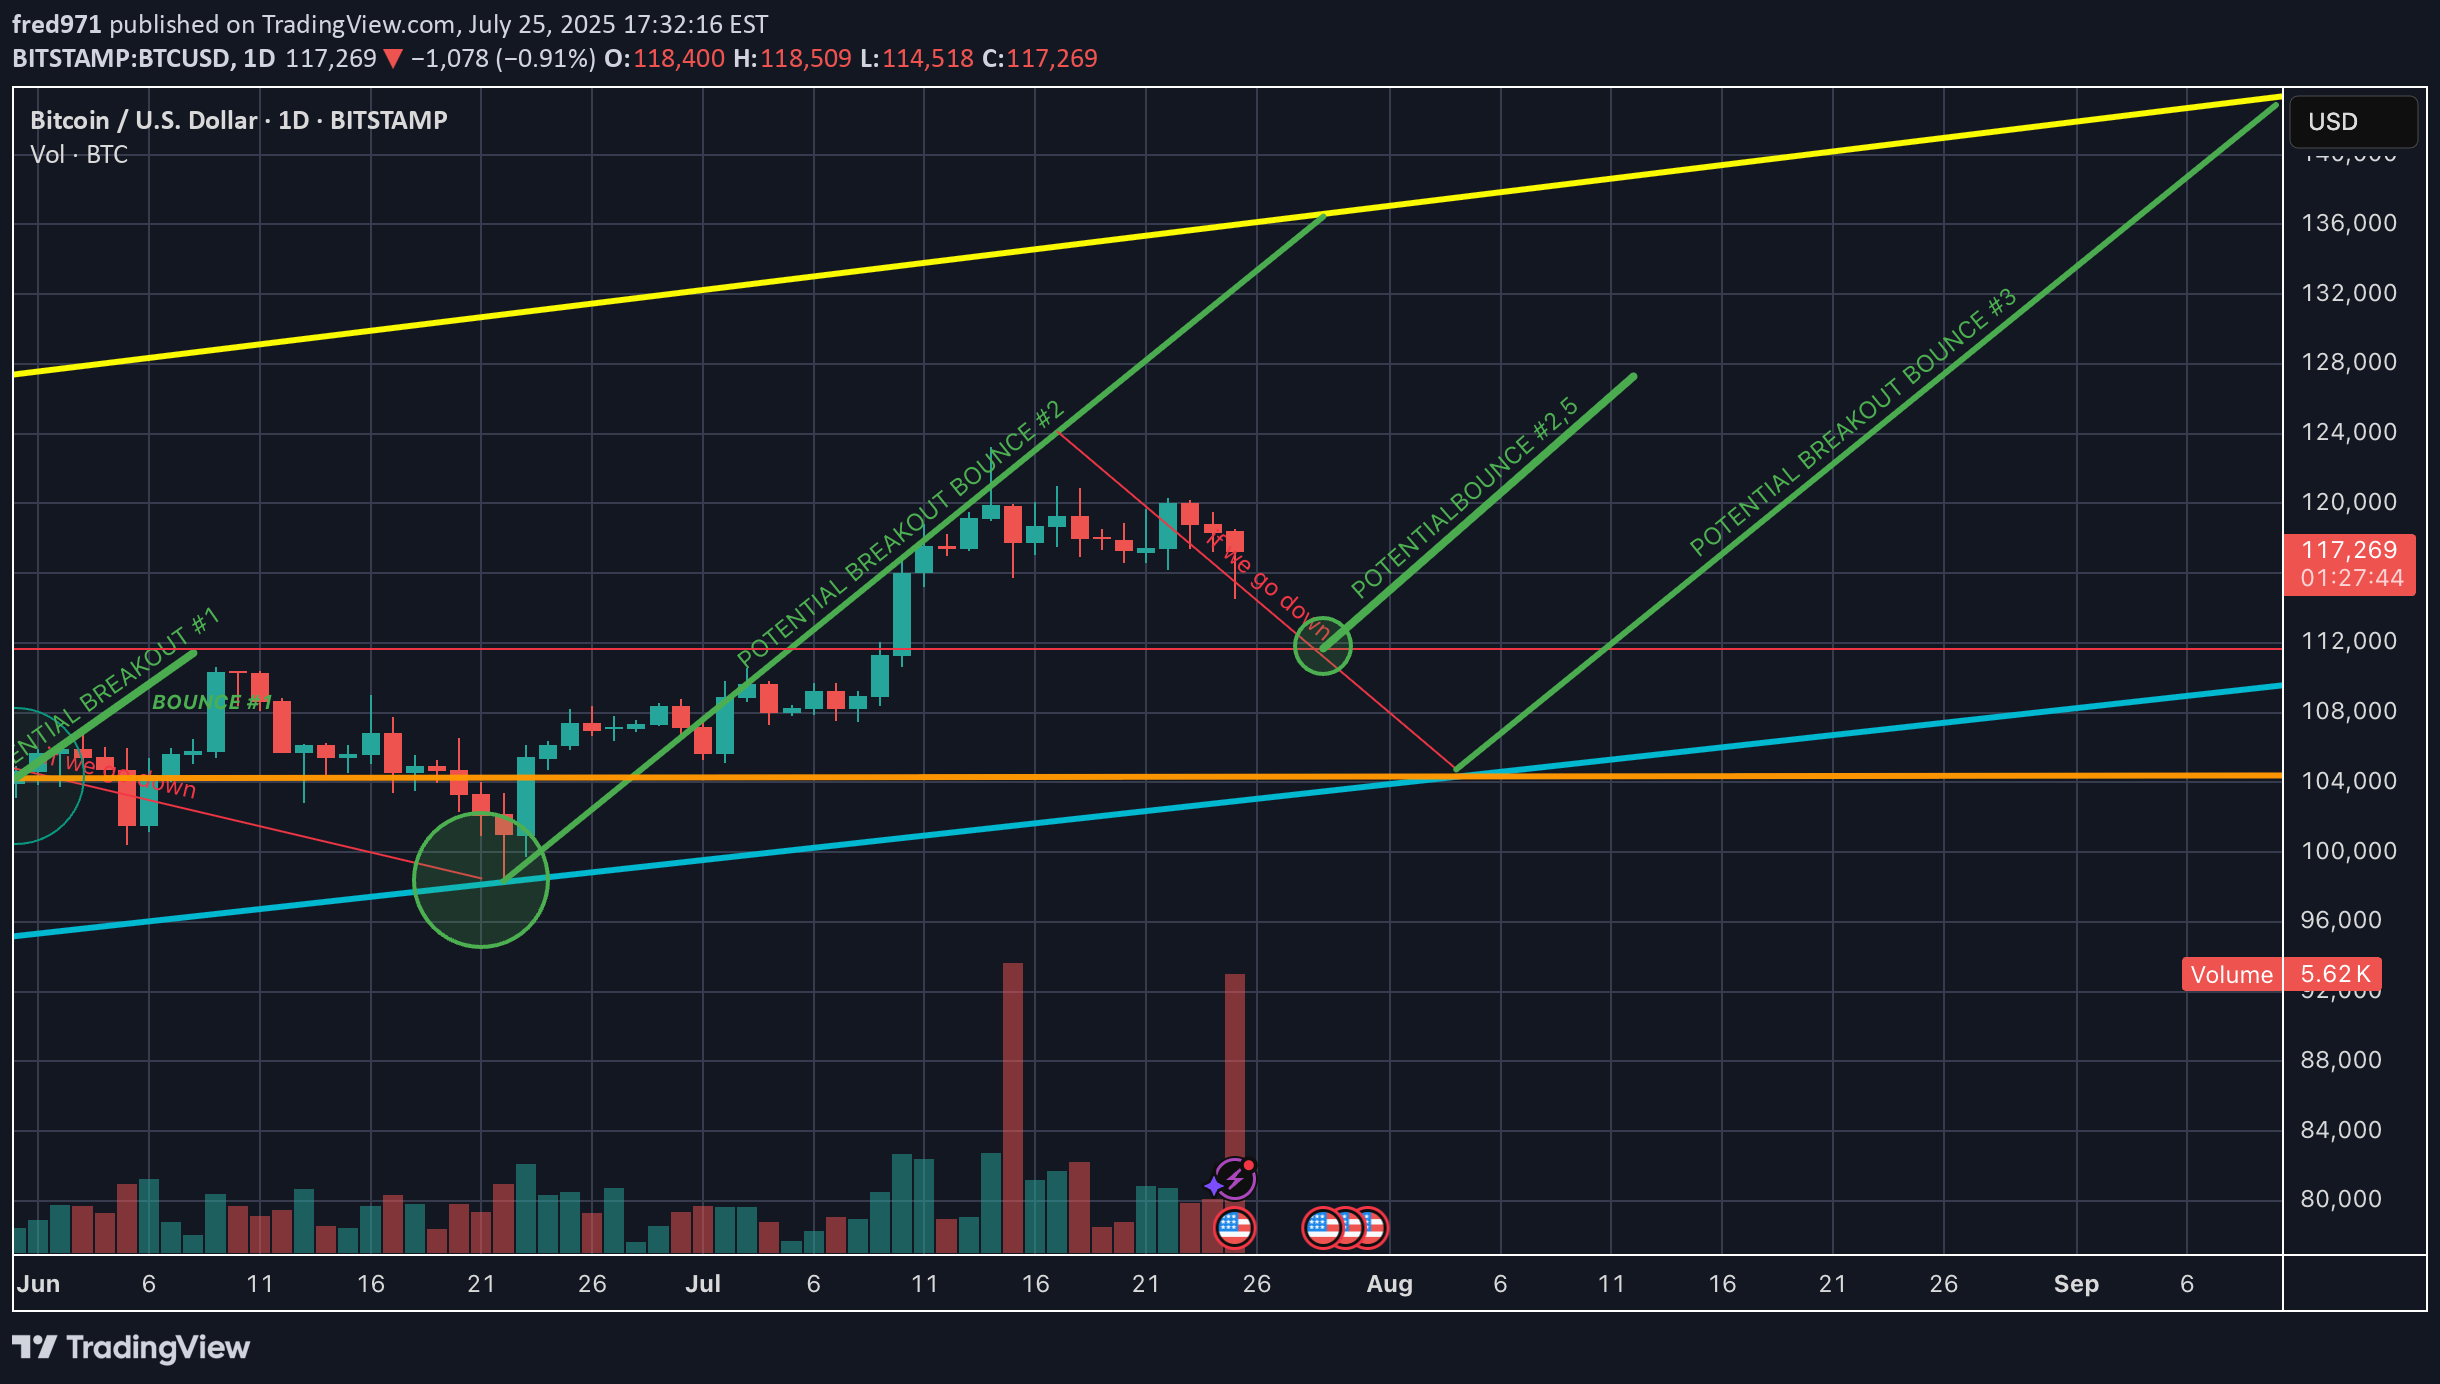
market is respecting key support/resistance or channel boundaries. These points often become decision zones where big moves occur. Signs this could be a fakeout: BTC wicks above a resistance or below a support with little follow-through Volume spikes only on the wick, then dies quickly Price reverses back into the range soon after breaking it If BTC recently broke a trendline with low volume, it smells like a trap move — a liquidity grab. If it’s testing support again after failing to rally, and volume is increasing on red candles, a leg down is possible. However, macro trend is still up unless we lose a major higher low (say, sub-$60k or sub-$56k depending on your chart).
next move down ?
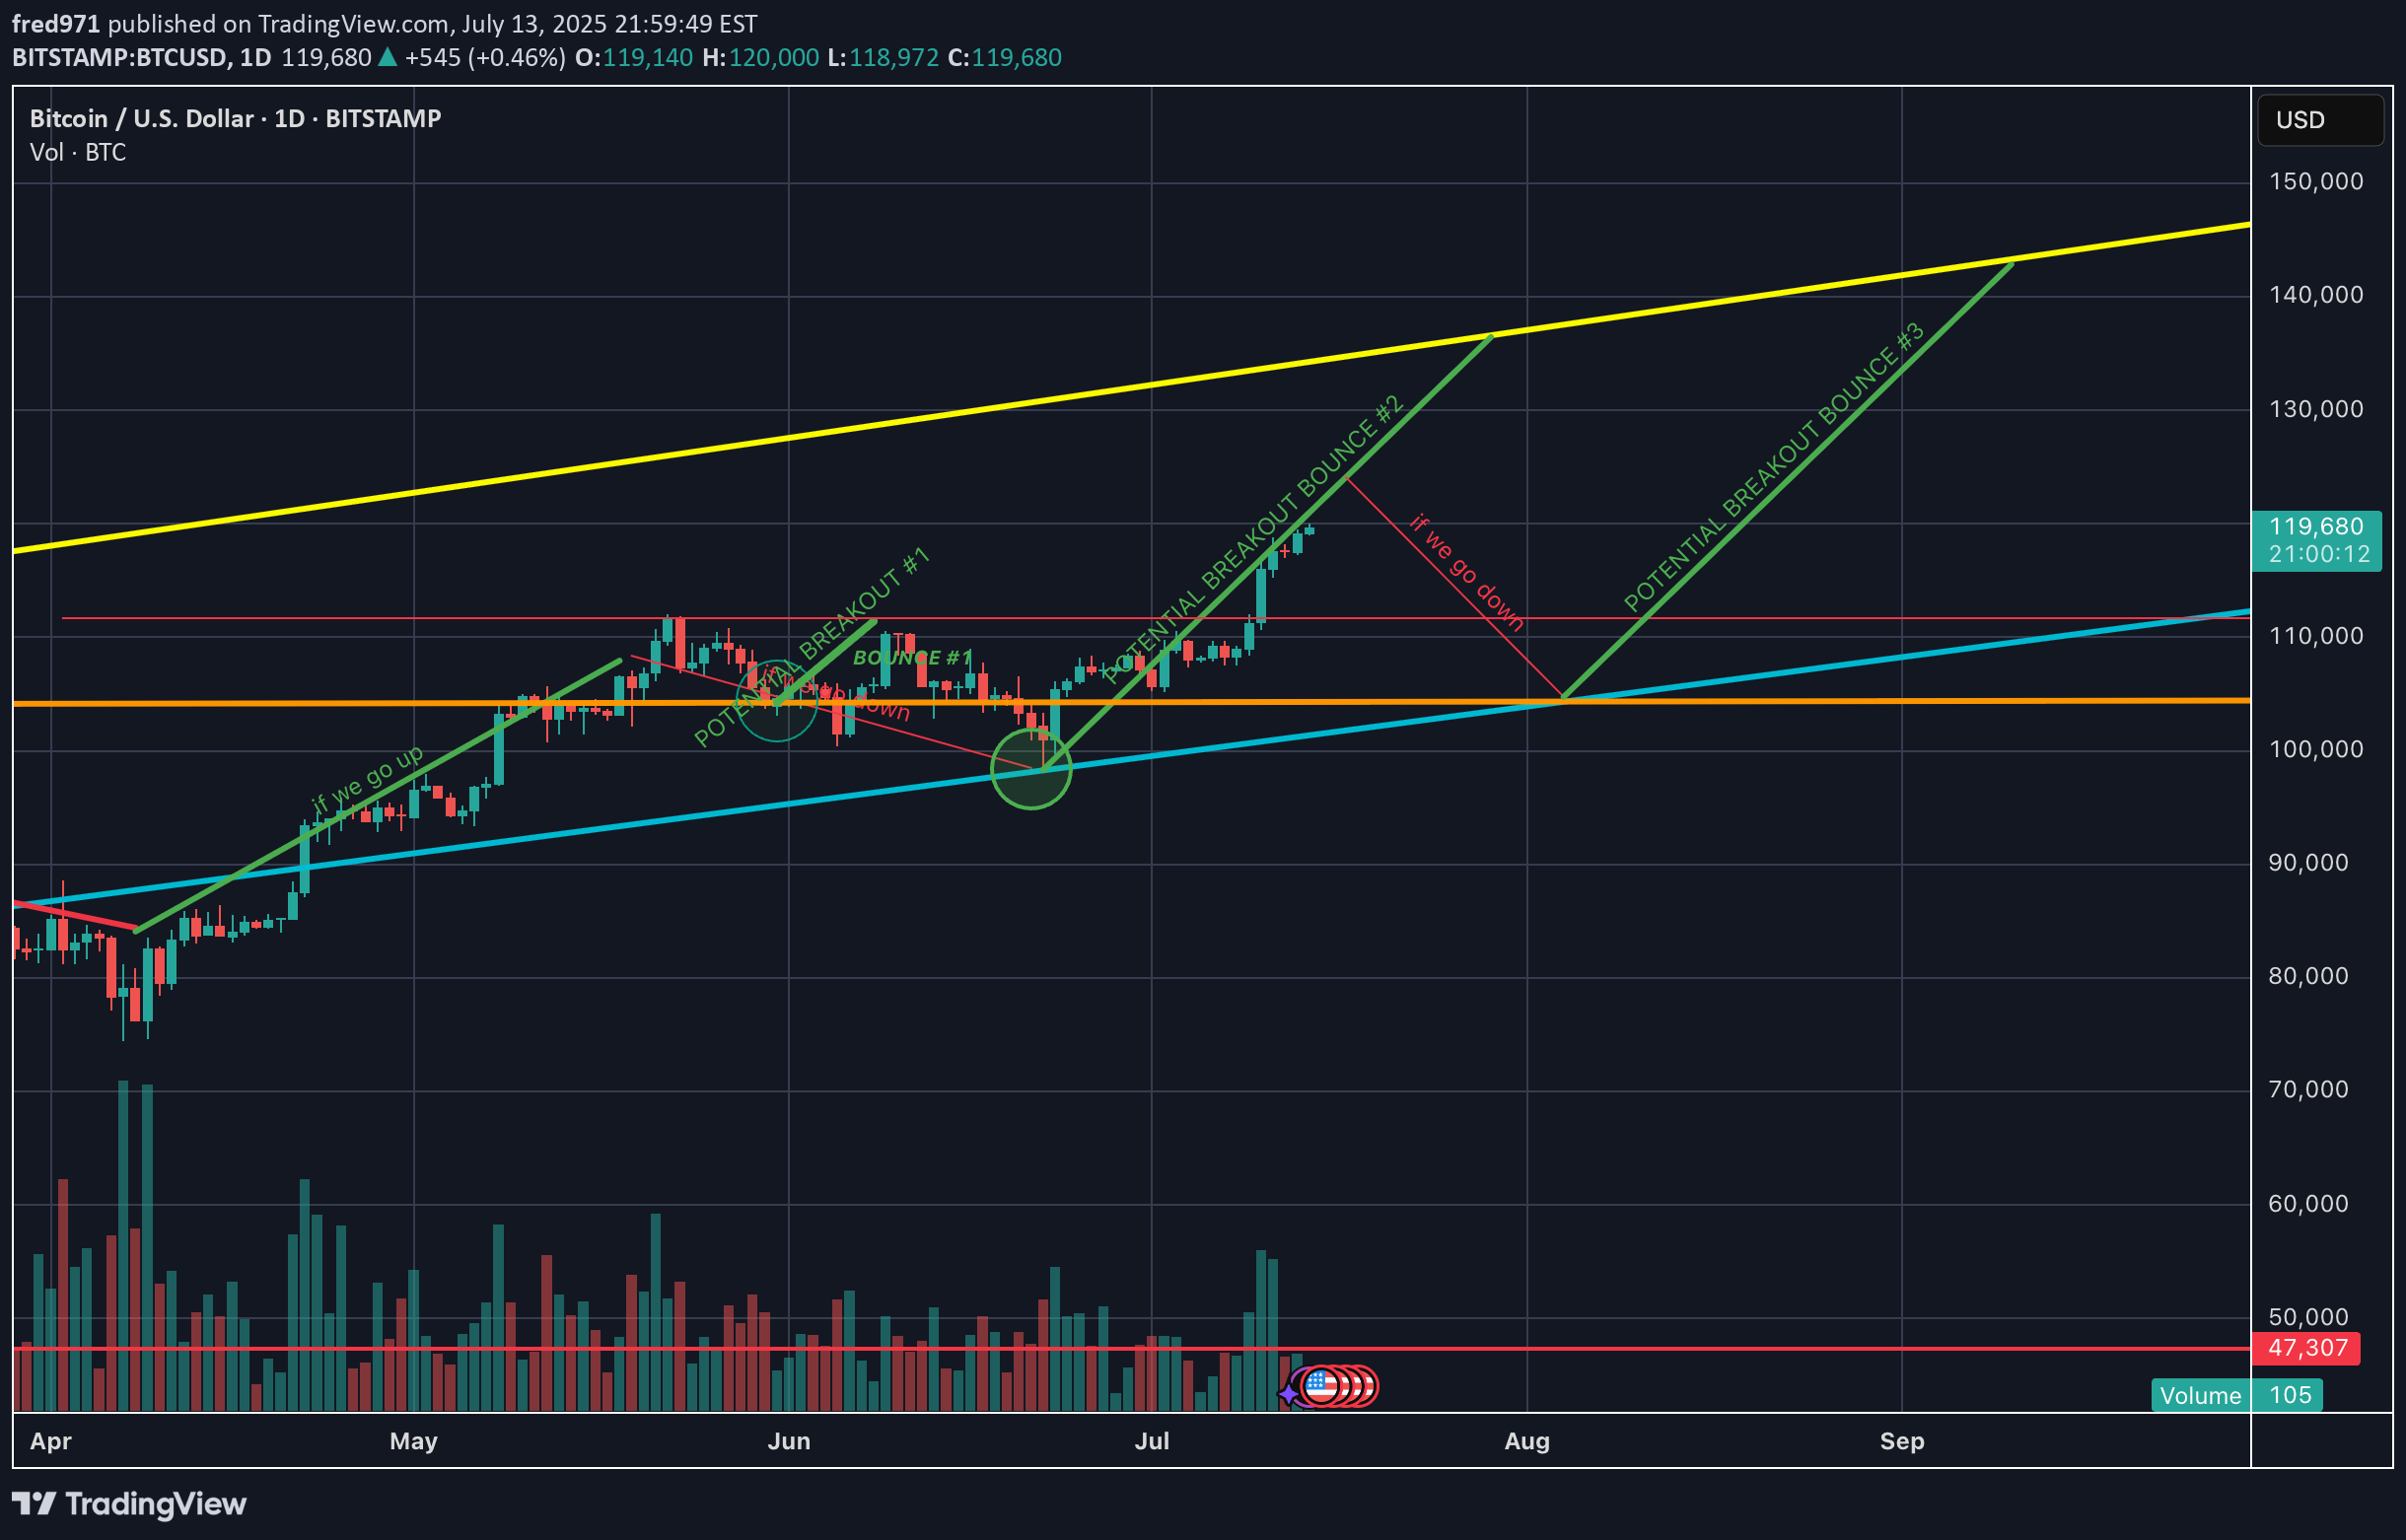
There is momentum BUT it always goes through a correction after a breakout
Would you Look at this ...
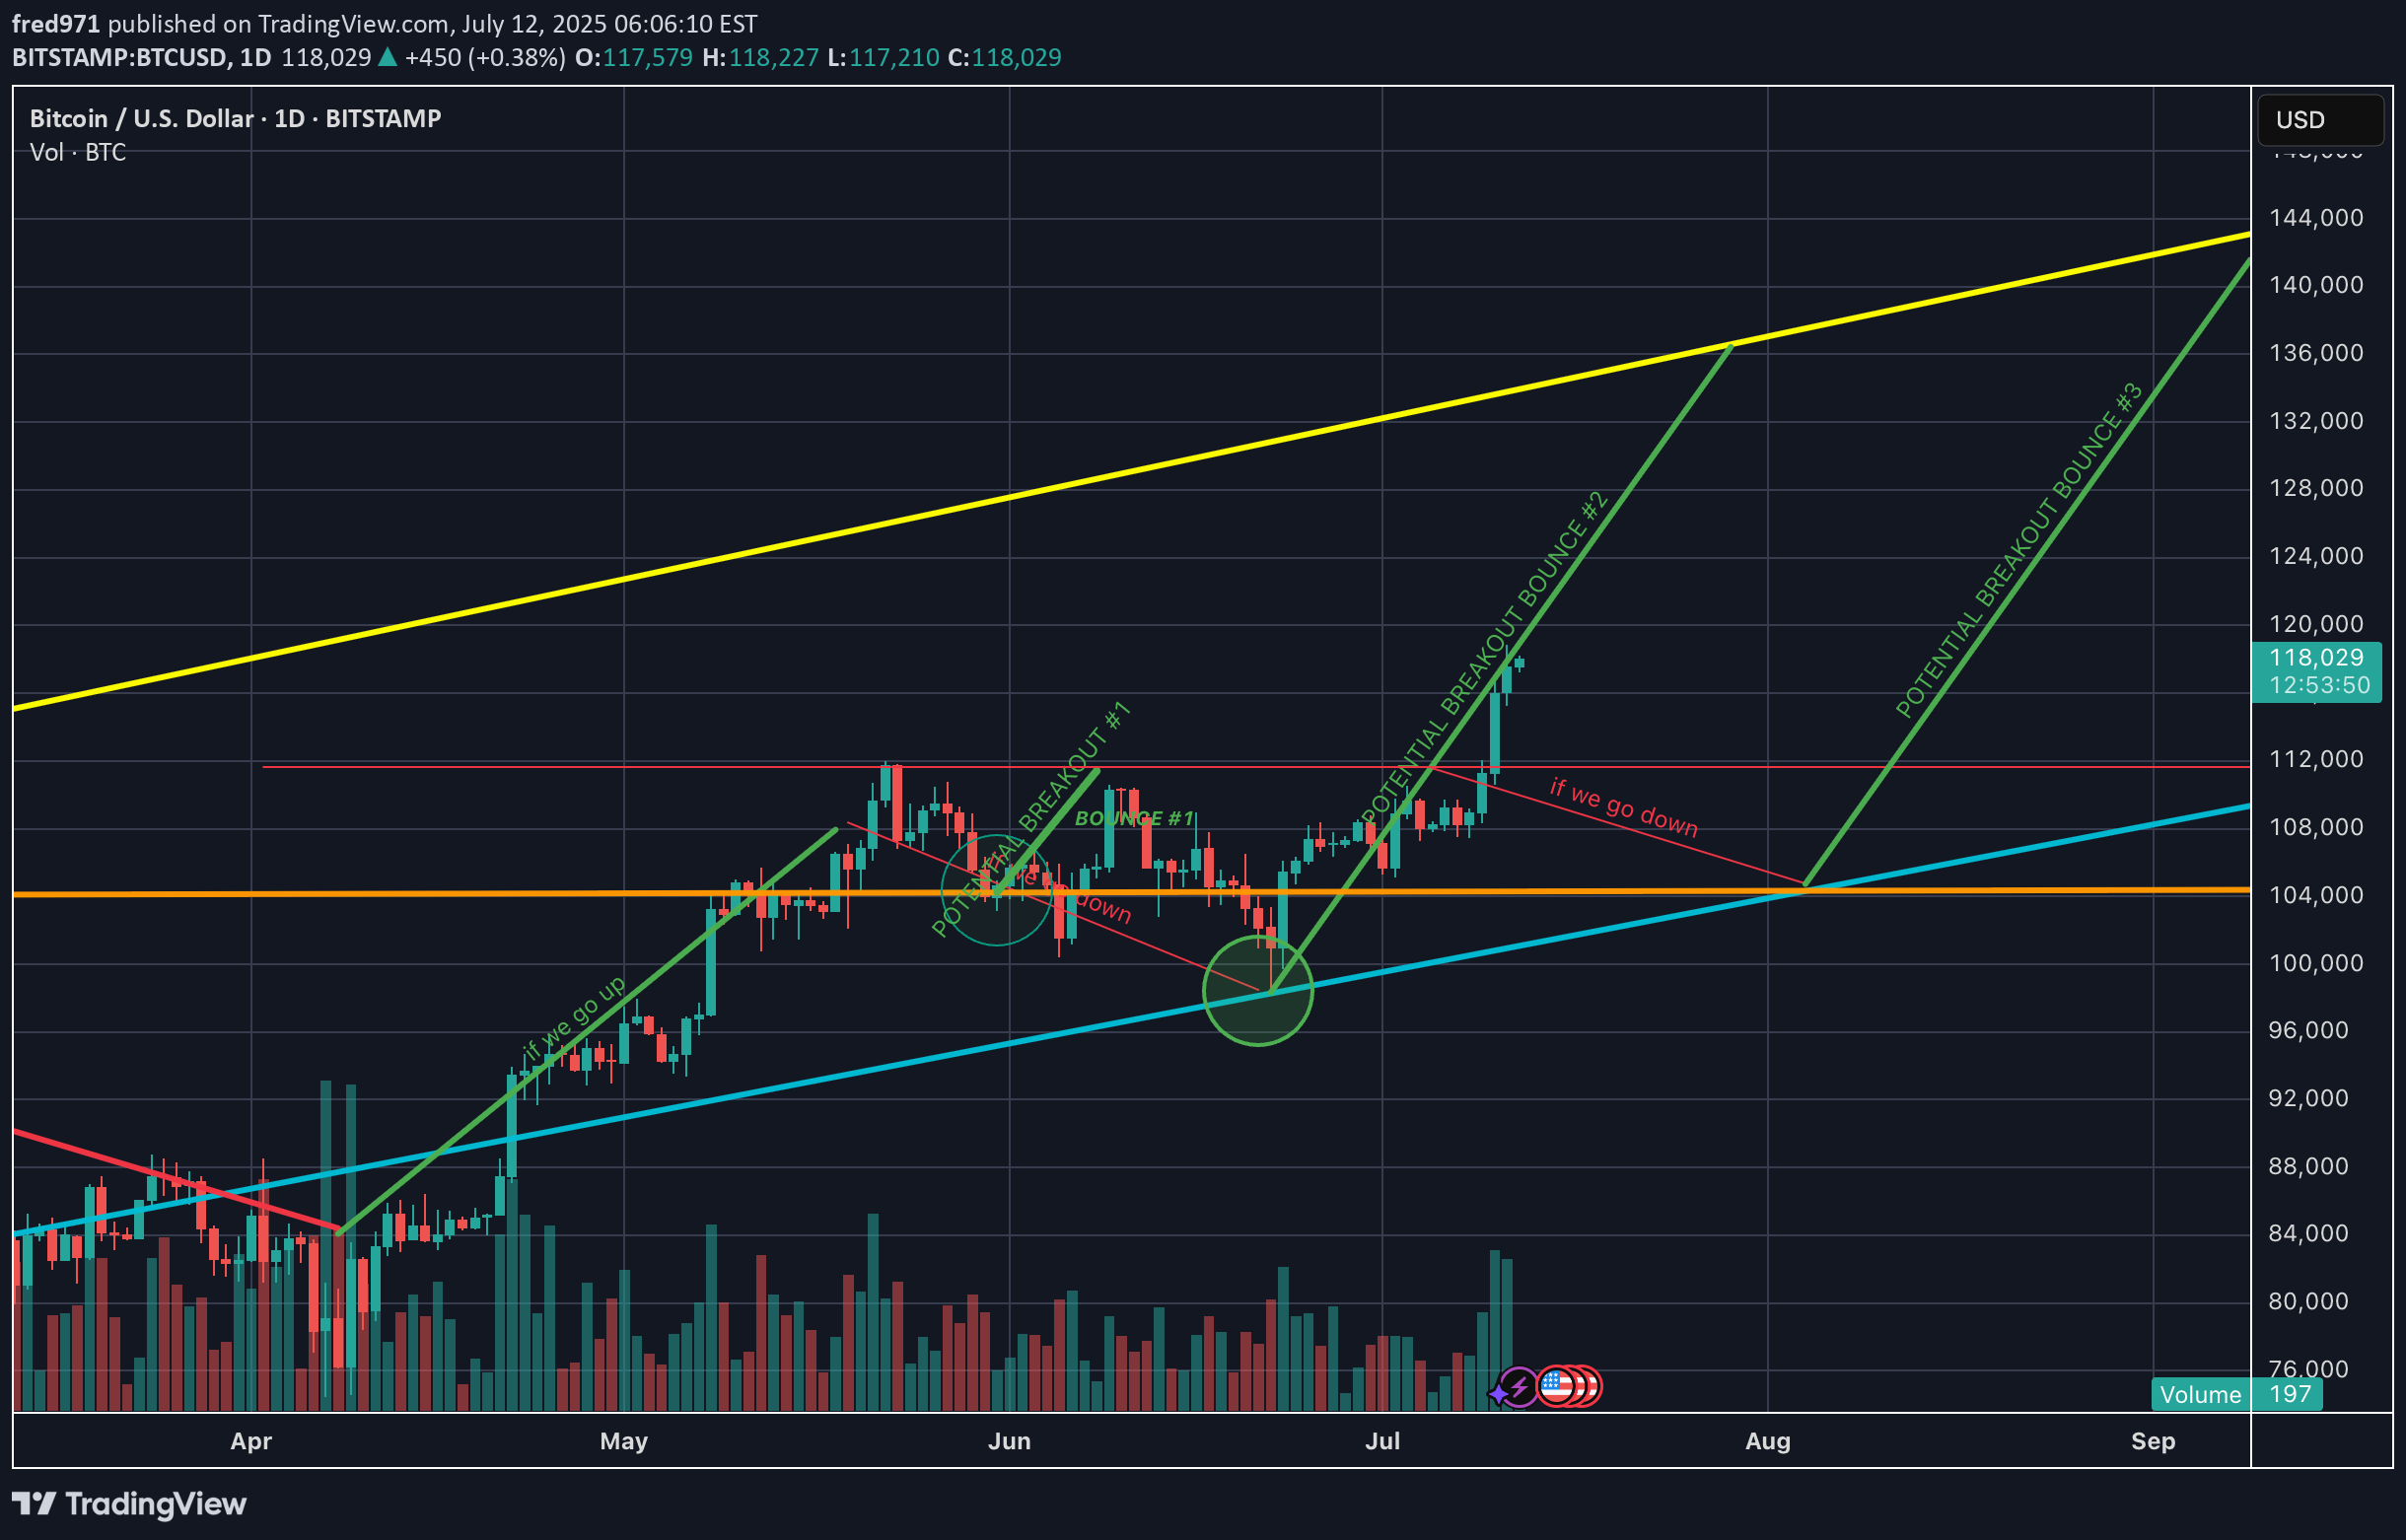
💁♂️💁♂️💁♂️ Ok, I have only taken 1 course of TA And somehow I am able to draw the perfect trajectory of the Course of BTC. Now the question is how high will we go... Follow for the next Prediction
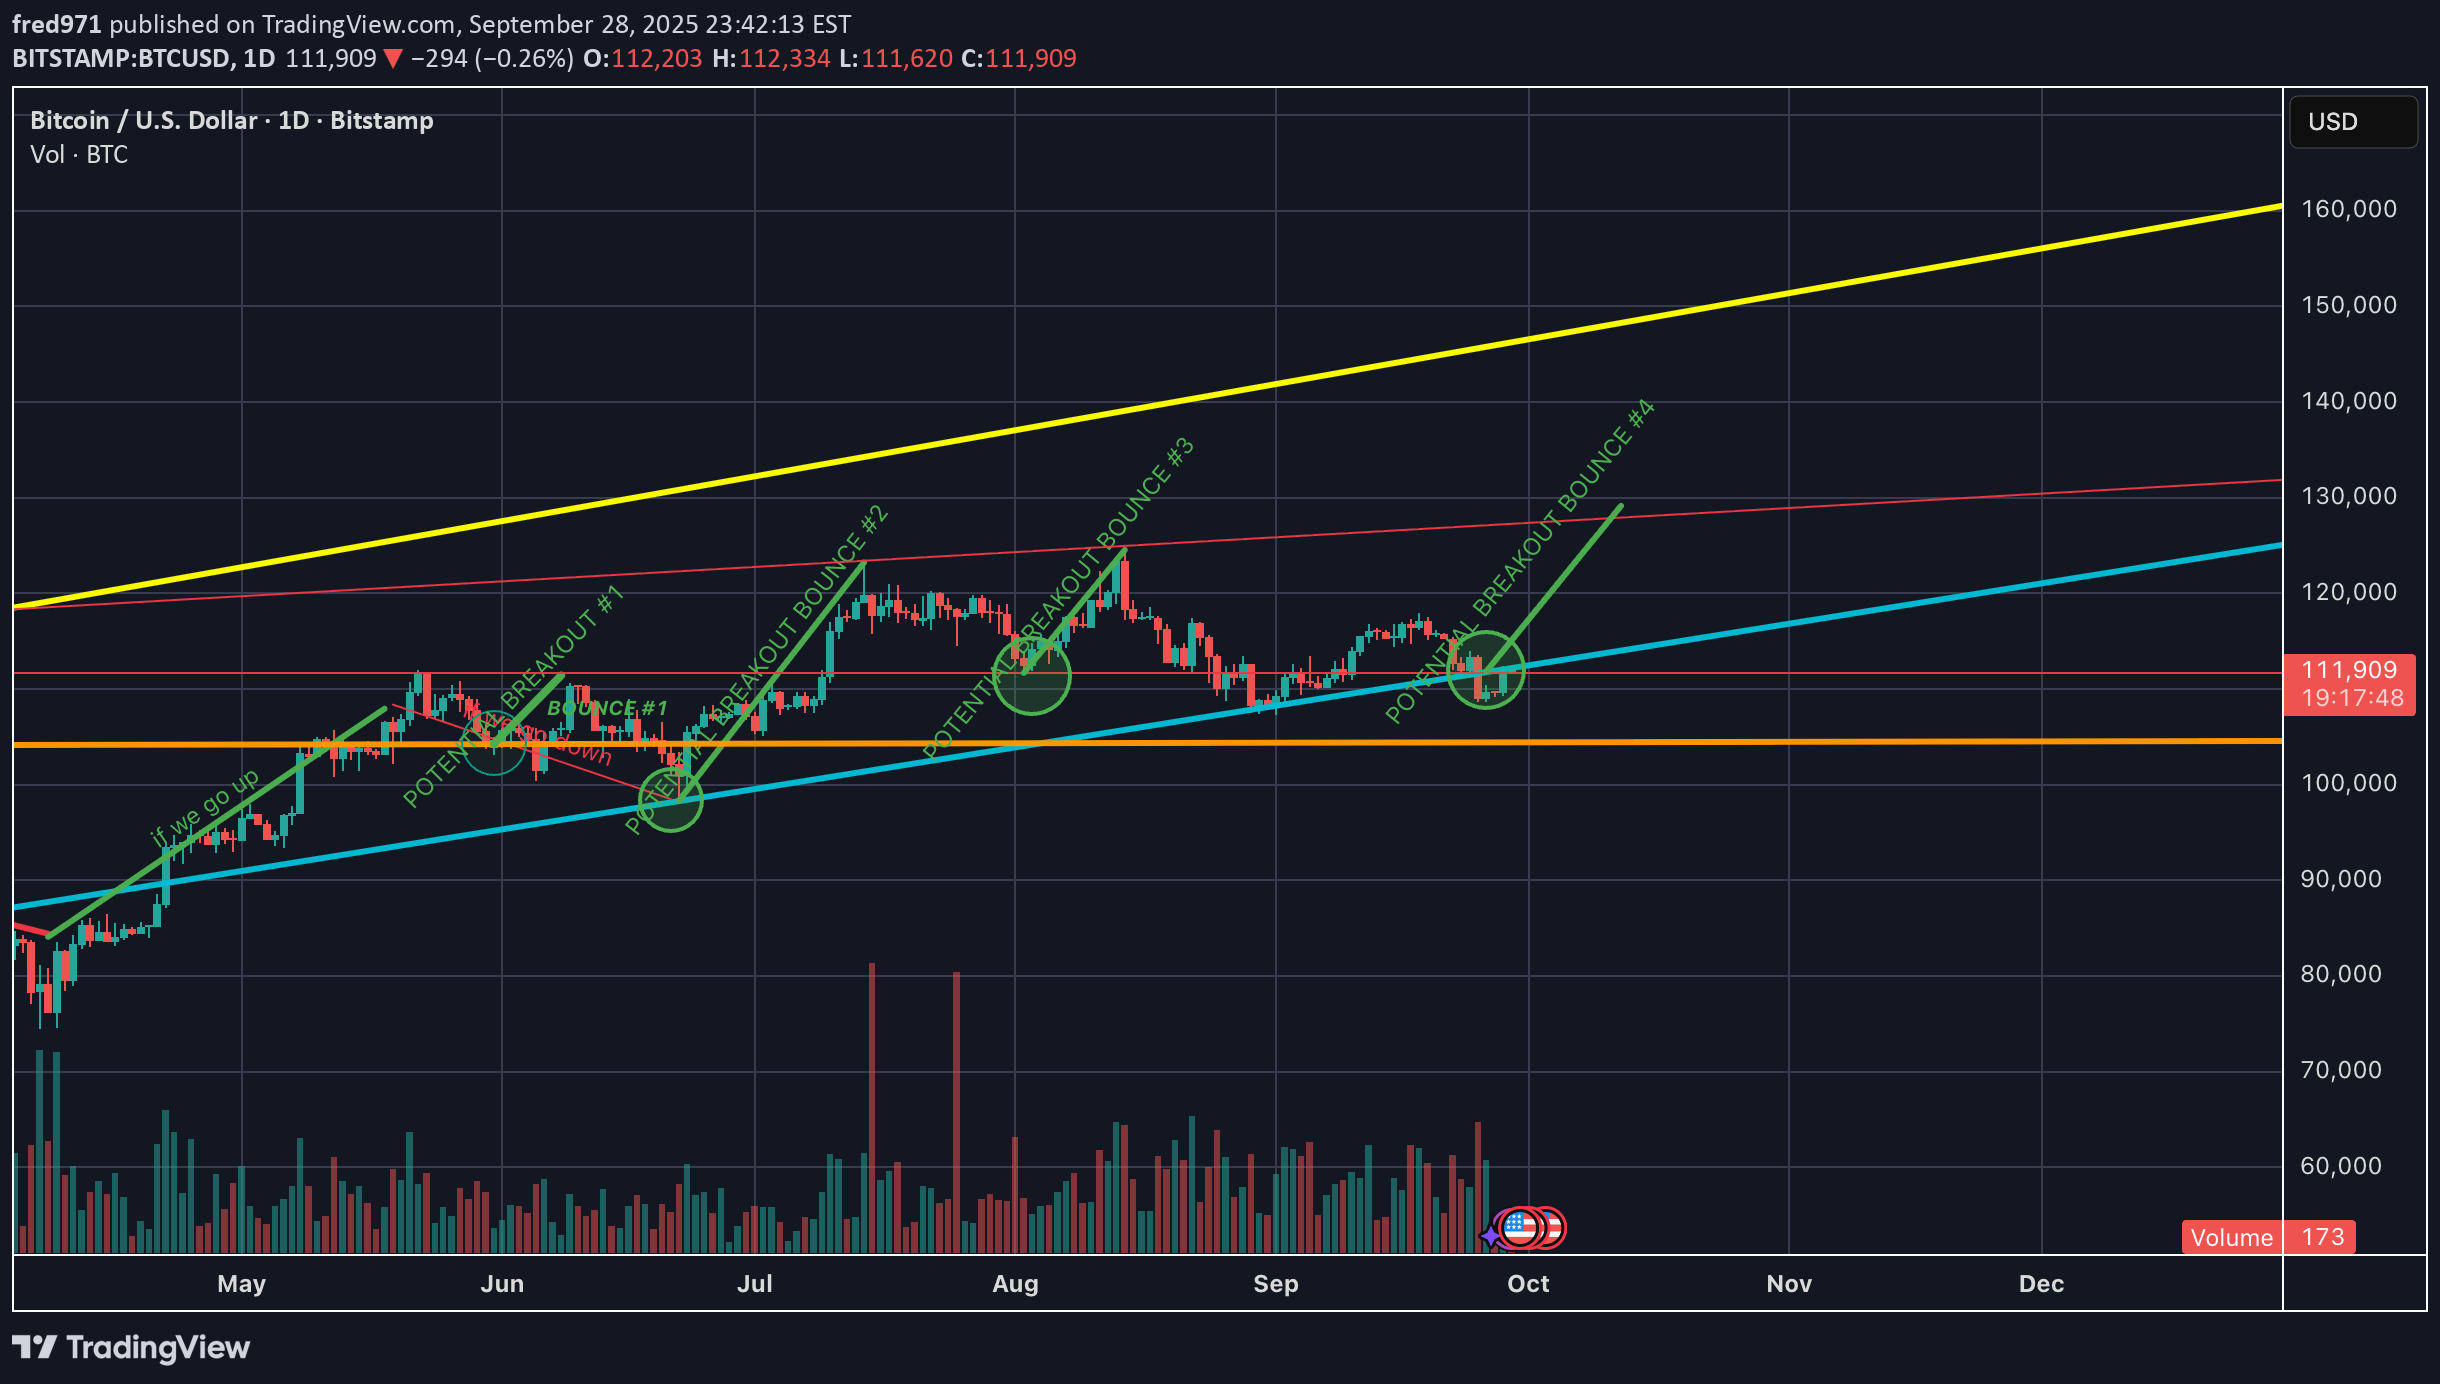
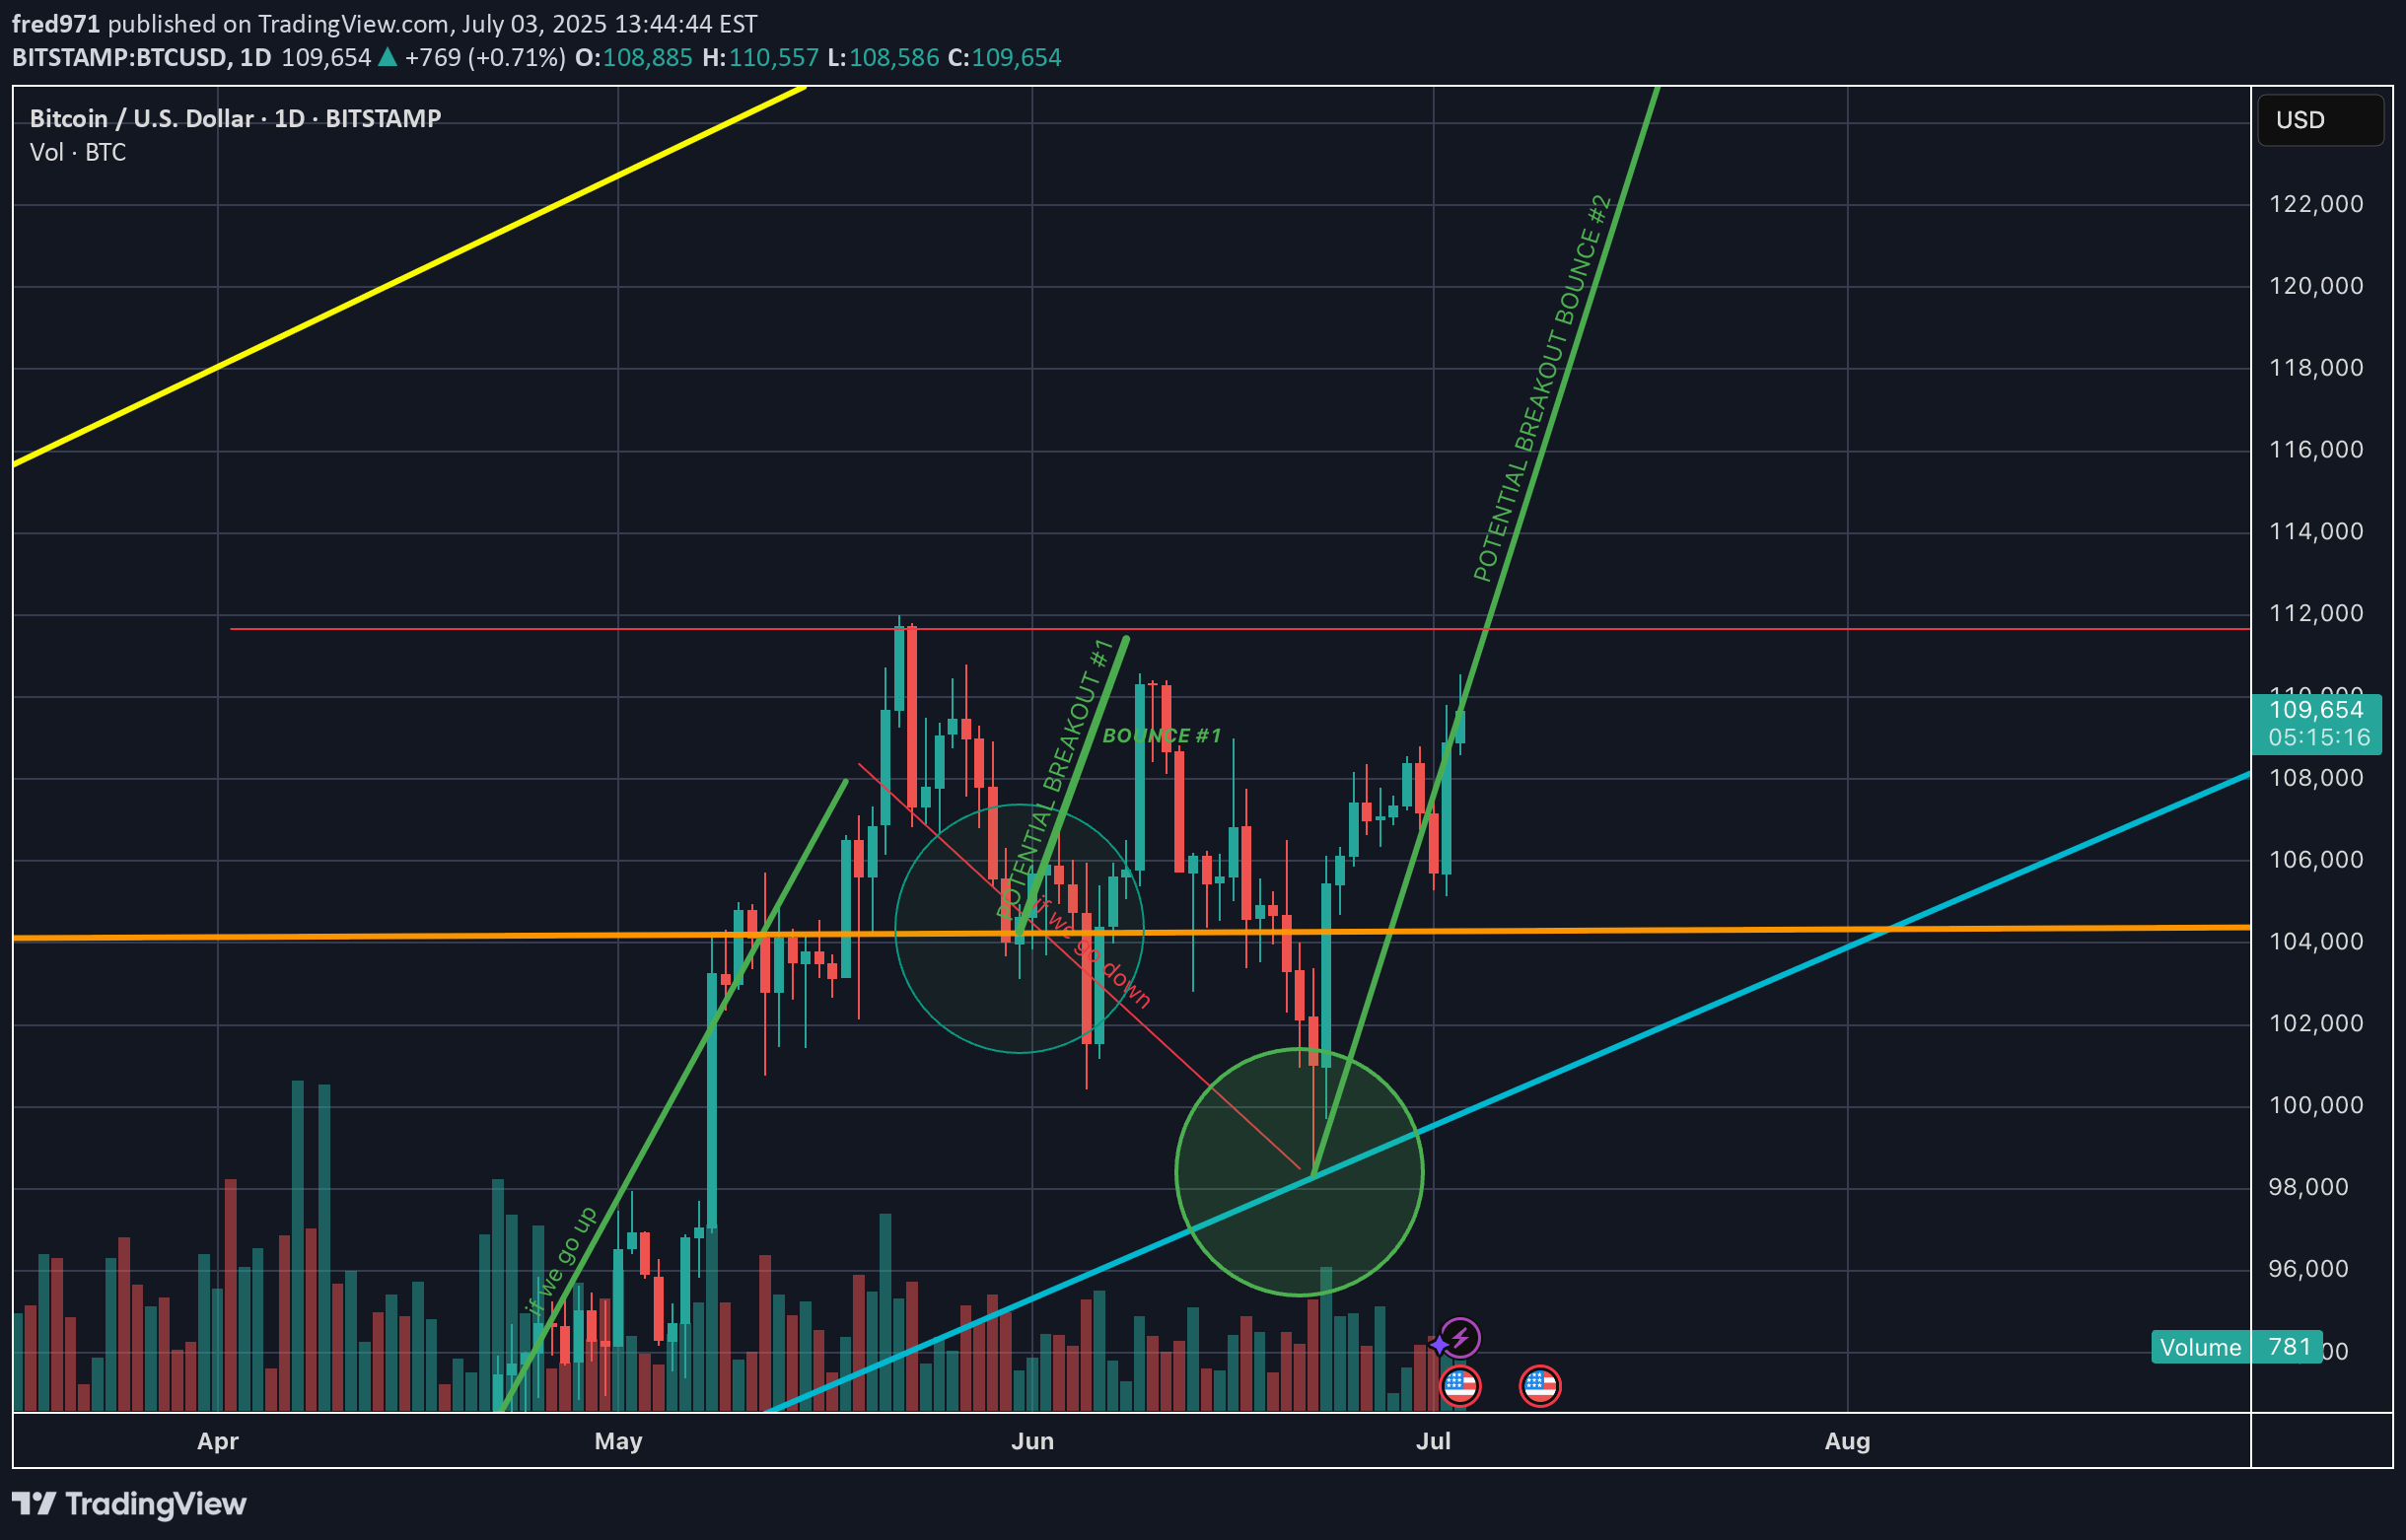
Are we breaking this resistance ? or not yet?
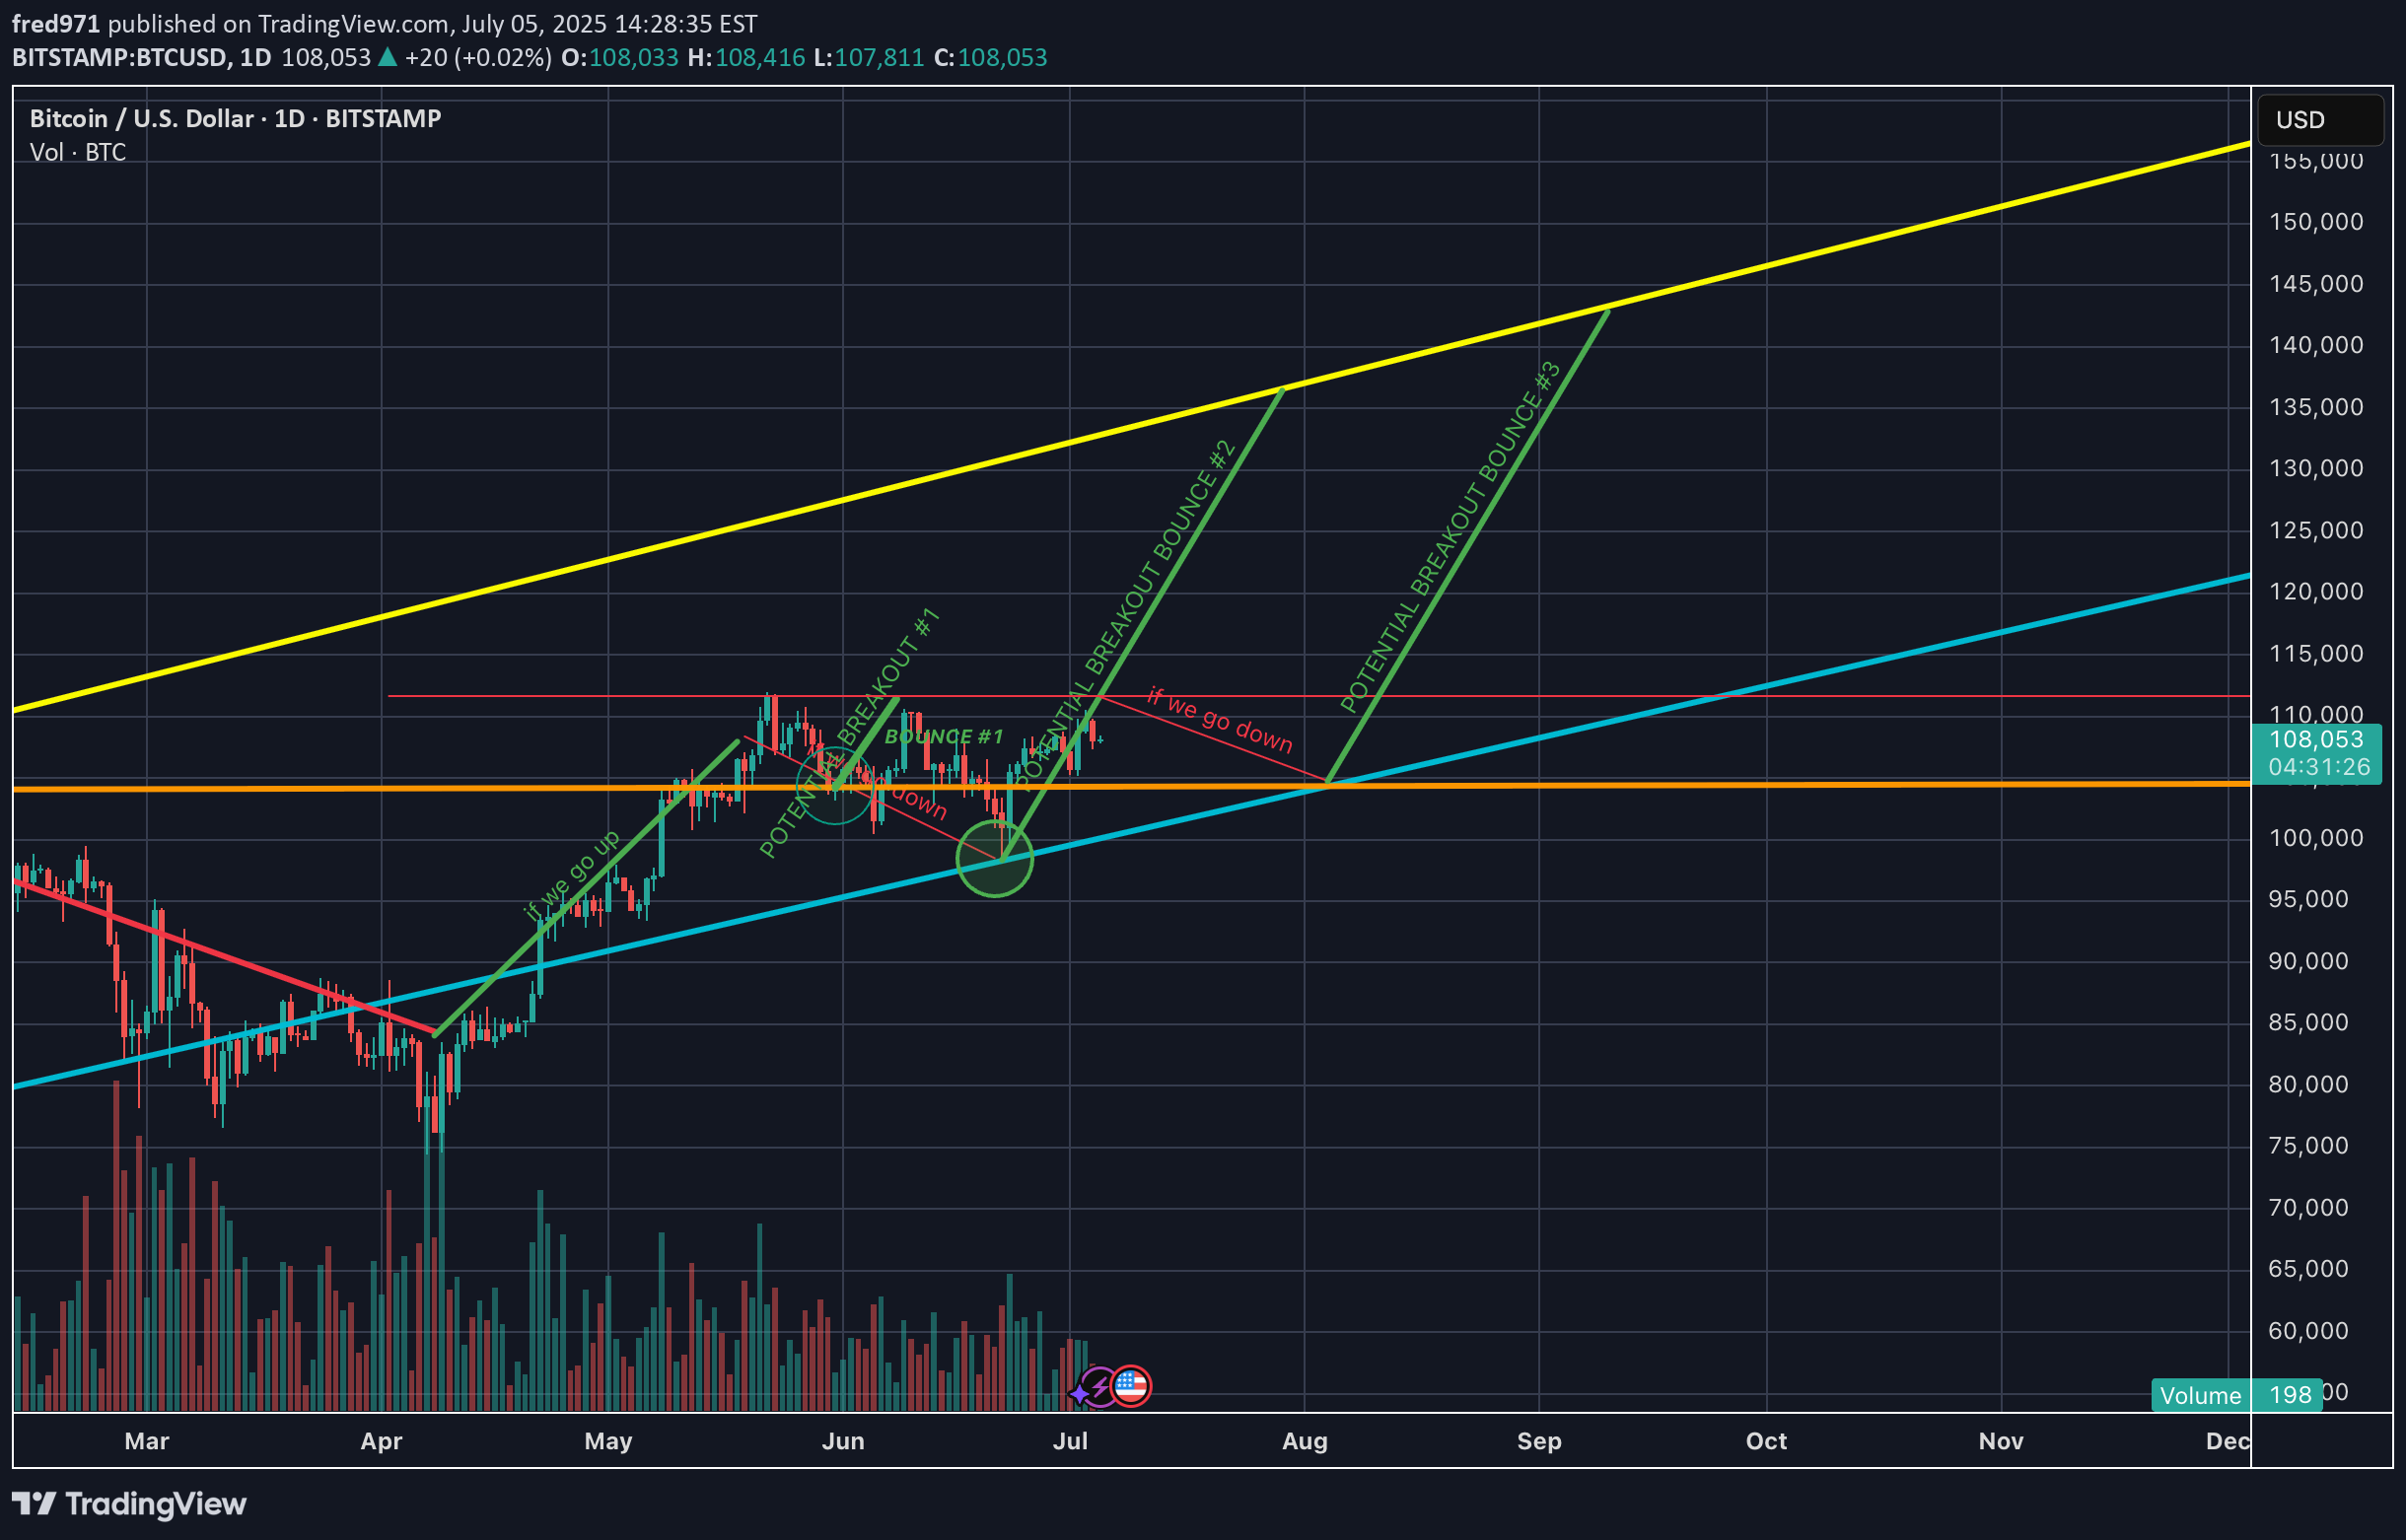
BTC is currently trading around $108,000, sitting at a key trendline support zone. The market is at a critical decision point, with two main scenarios: a bullish breakout or a rejection and move lower.🔍 Technical Structure OverviewChart timeframe: 1D (Daily)Major support: $104,000 (horizontal) & ascending trendline (cyan)Major resistance: $110,000–$112,000 zoneLong-term resistance channel: Yellow trendline capping BTC near $140,000Volume: Currently low — needs a spike to confirm any breakout🟢 Bullish ScenarioBTC bounces off the ascending trendline (current zone)A strong breakout above $112,000 with volume would confirm a Potential Breakout Bounce #2Targets:$120,000 (short-term)$130,000–$140,000 (upper yellow trendline in long-term channel)✅ Confirmation needed:Daily candle close above $112K with high volumeRSI rising above 50, MACD bullish crossover would help confirm move🔴 Bearish ScenarioBTC fails to hold the trendline and breaks below $104,000This confirms a rejection and a likely move toward $96,000If momentum weakens, this could turn into a deeper correction or sideways consolidationBTC is in a tight consolidation range, nearing a major decision point. A breakout above resistance could send prices to new local highs, while failure to hold trendline support will likely trigger a correction. Watch key levels carefully and let volume + momentum indicators confirm your trade.
look who was right... AGAIN
I wish I trusted my TA more, Maybe I'd do good $$$
WAW we ended up again following my imaginary lines ....

I'm seeing a potential upside: if war accelerates government spending, it could push central banks to print more money — and that could be fuel for Bitcoin.Historically, wars come with massive fiscal demands. Governments tend to ramp up military budgets, fund support packages, and stimulate their economies to manage instability — and that often leads to increased money printing.More fiat currency in circulation typically leads to inflation or a devaluation of purchasing power. In that kind of environment, investors and everyday people start looking for stores of value outside of traditional currencies — like gold, real estate… and now, Bitcoin.Bitcoin was literally born in response to central banks abusing the money printer. Its fixed supply — 21 million coins — makes it an attractive hedge against inflation and monetary debasement. If war accelerates global instability and fiscal irresponsibility, Bitcoin could benefit as a safe-haven asset.So yes — war is tragic. But in purely macroeconomic terms, if it triggers massive government spending, printing, and inflation, it could send Bitcoin flying.
Disclaimer
Any content and materials included in Sahmeto's website and official communication channels are a compilation of personal opinions and analyses and are not binding. They do not constitute any recommendation for buying, selling, entering or exiting the stock market and cryptocurrency market. Also, all news and analyses included in the website and channels are merely republished information from official and unofficial domestic and foreign sources, and it is obvious that users of the said content are responsible for following up and ensuring the authenticity and accuracy of the materials. Therefore, while disclaiming responsibility, it is declared that the responsibility for any decision-making, action, and potential profit and loss in the capital market and cryptocurrency market lies with the trader.