Technical analysis by fred971 about Symbol BTC on 7/5/2025

Are we breaking this resistance ? or not yet?
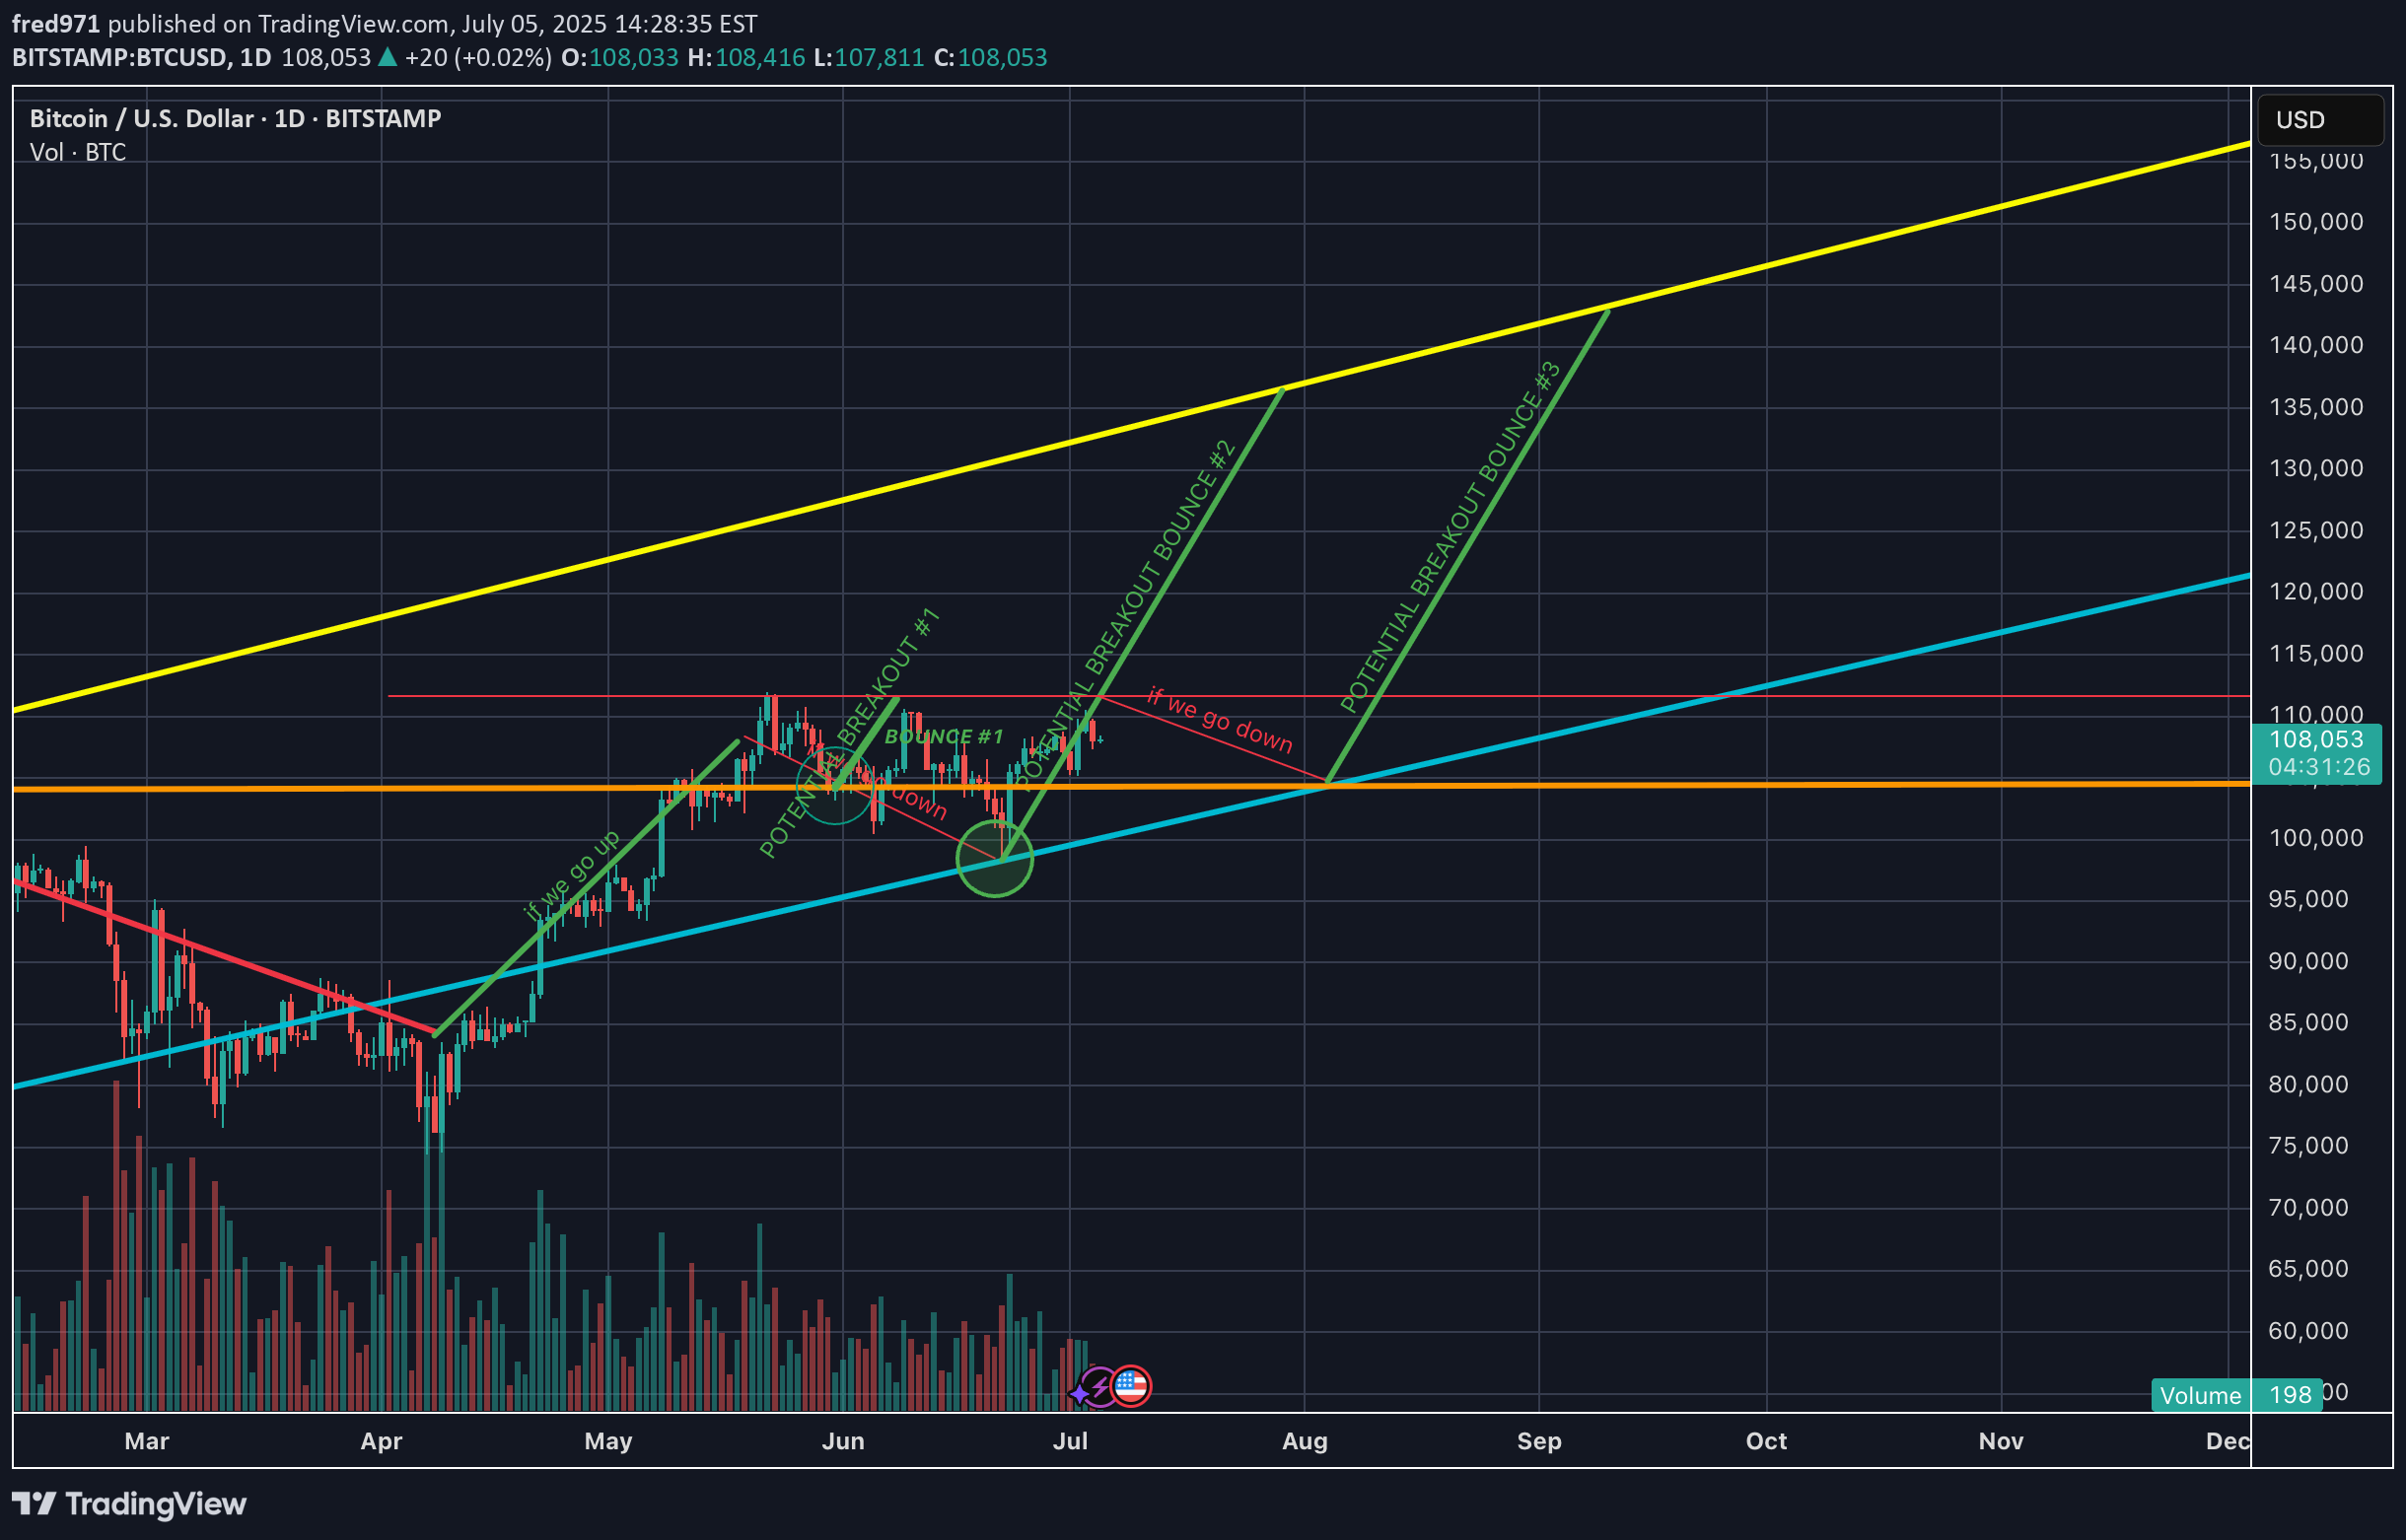
BTC is currently trading around $108,000, sitting at a key trendline support zone. The market is at a critical decision point, with two main scenarios: a bullish breakout or a rejection and move lower.🔍 Technical Structure OverviewChart timeframe: 1D (Daily)Major support: $104,000 (horizontal) & ascending trendline (cyan)Major resistance: $110,000–$112,000 zoneLong-term resistance channel: Yellow trendline capping BTC near $140,000Volume: Currently low — needs a spike to confirm any breakout🟢 Bullish ScenarioBTC bounces off the ascending trendline (current zone)A strong breakout above $112,000 with volume would confirm a Potential Breakout Bounce #2Targets:$120,000 (short-term)$130,000–$140,000 (upper yellow trendline in long-term channel)✅ Confirmation needed:Daily candle close above $112K with high volumeRSI rising above 50, MACD bullish crossover would help confirm move🔴 Bearish ScenarioBTC fails to hold the trendline and breaks below $104,000This confirms a rejection and a likely move toward $96,000If momentum weakens, this could turn into a deeper correction or sideways consolidationBTC is in a tight consolidation range, nearing a major decision point. A breakout above resistance could send prices to new local highs, while failure to hold trendline support will likely trigger a correction. Watch key levels carefully and let volume + momentum indicators confirm your trade.