
fishguru73
@t_fishguru73

What symbols does the trader recommend buying?
Purchase History
پیام های تریدر
Filter
مهمترین نمودار کلان بازار: آیا قیمتها به دام فومو (FOMO) رسیدهاند؟
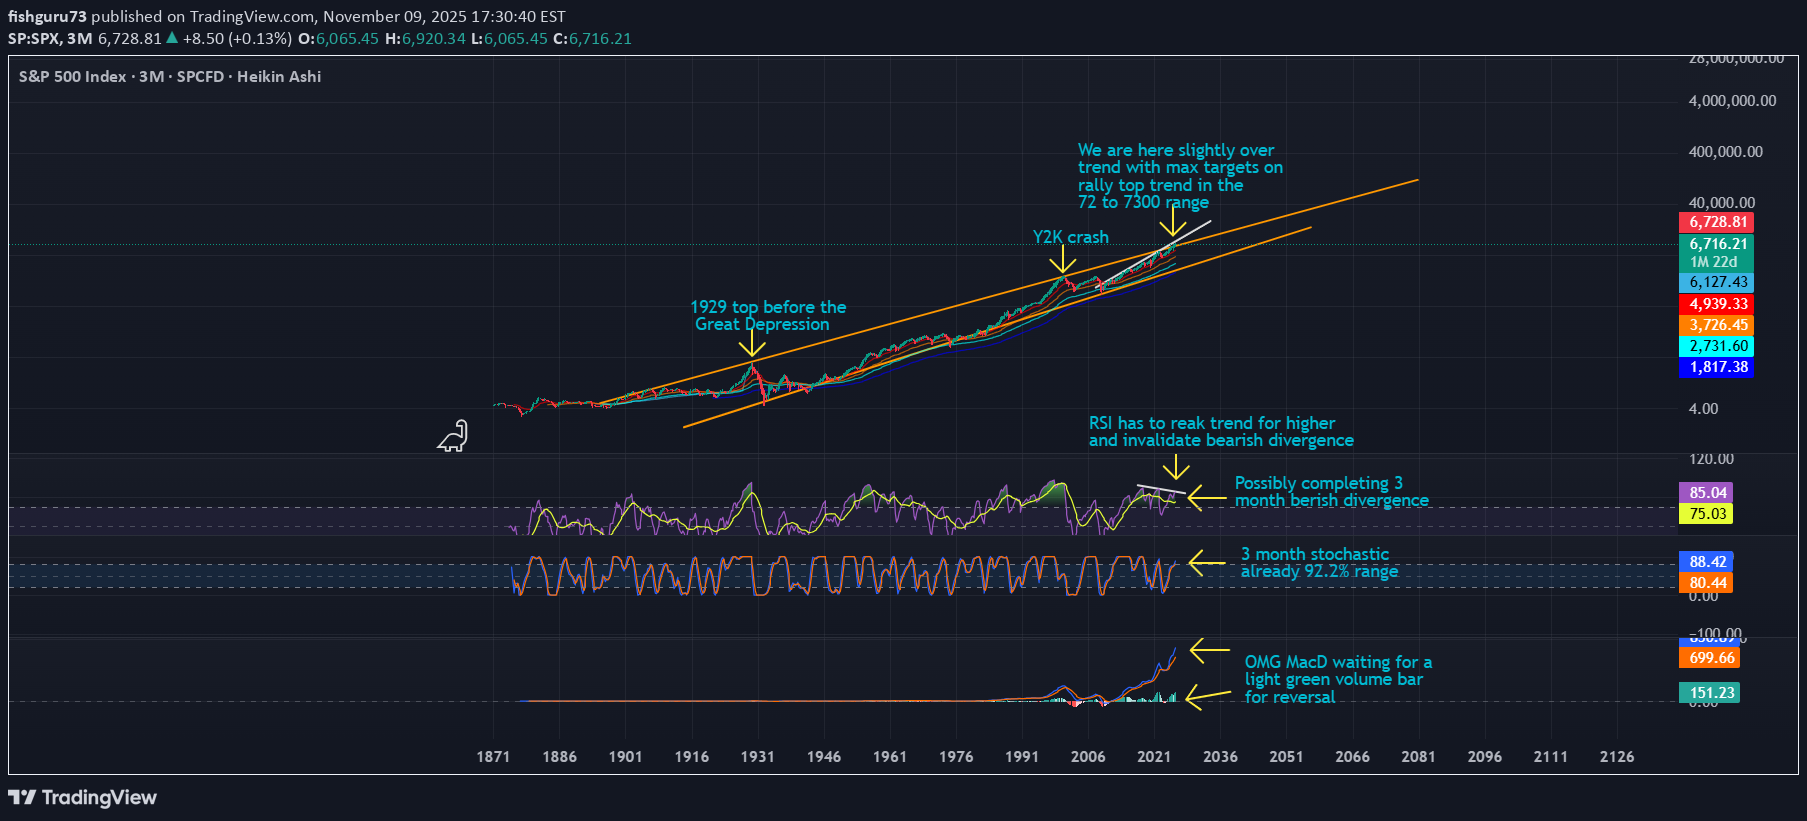
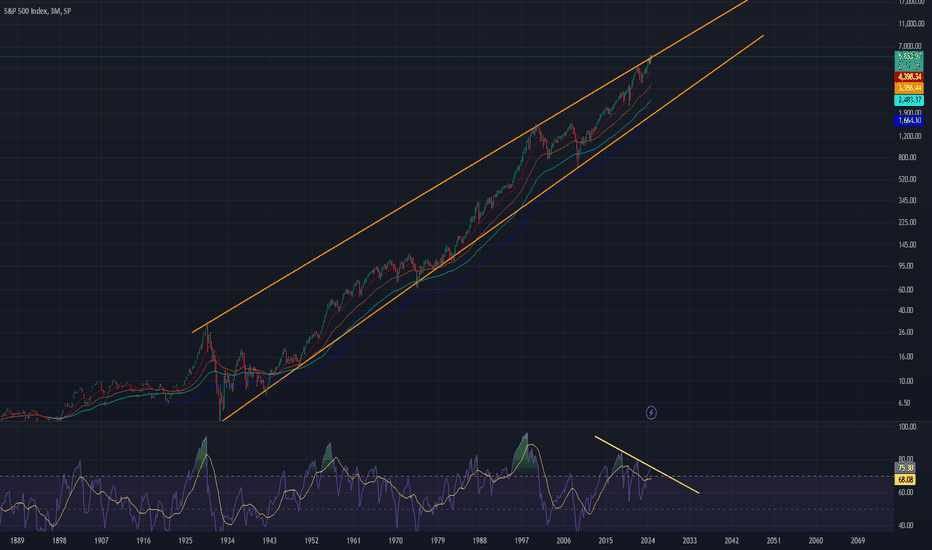
For the entire history of the SPX it has been trading max and low limits in an ascending wedge going back to the high and low of the Great Depression. We are currently slightly over the macro top trend with retail all in and influencers calling for higher targets. While it is possible that we rally, invalidating bearish divergence on the 3 month time frame is highly unlikely. Put simply, inflation is high, retail is broke, and there is no logical reason for institutional investors to be holding or buying here as there is a price at which there will be no exit liquidity because no one will be available to purchase stocks and other assets from smart money at higher prices. We already have weekly RSI in overbought status currently. We could invalidate 3 month divergence theoretically, but a liquidity crisis coupled with high inflation seems like the move over trend is bait to keep retail in a perpetual state of buying dips as investment firms slowly sell into their FOMO (fear of missing out.) It is, not only logical to take profits at these highs; it is imperative for anyone looking to preserve their funds until there are much lower prices.
The final rally or the beginning of hyper-inflation?
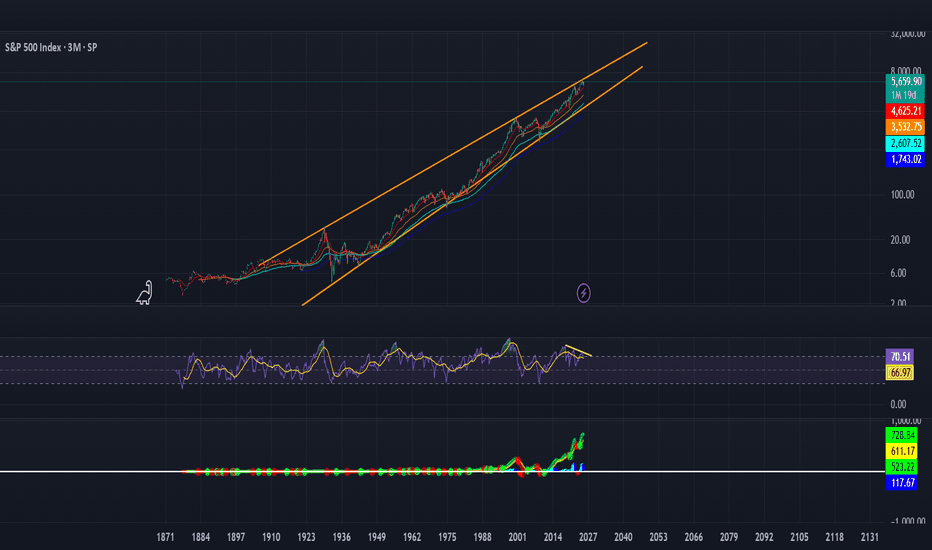
This is an ascending wedge, (65% chance of a break to the downside statistically,) that the S&P500 has been trading in for it's entire life cycle. All historical data points to a final topping process as market makers head back for the top trend to liquidate short positions that took positions on the last plunge. The former sell-off showed no signs of big money taking full exit from the market as it was quite gradual; allowing short positions to stack at back tests of key resistance areas. Therefore, it stands to reason that the oversold daily RSI was going to allow for a powerful bounce to catch shorts off guard. The market will not sell off largely until shorts have capitulated as exchanges and banks load up for a final rally to completely remove those positions and sell new highs. when this happens, there will be no gradual dump but, instead, a red waterfall with news about hyperbolic, impending disasters coming out after the largest institutions push the sell button. Breaking that top trend on the 3 month logarithmic chart would be a first in market history and denote hyper-inflation followed by the coming crash being even more violent then anyone believes is possible. It is a good time to start scaling out of the market little by little.
Top trend is the top for BTC every cycle going back 15 yrs

Taking profit has it's merits. This is the top for BTC historically. We may see a double top rally into 2026 as we did in 2021 but, for now, the overall weekly trend will be bearish even if we put a shoulder on the rally.
For noobs like you that buy market cycle tops.

I think anyone with a couple of brain cells can agree that anything that is a natural function of buying and selling should have no linear correlation. But, you may only have one so don't blow a fuse here Einstein.
The top is in

This long standing top trend is and will continue to be the cycle top
Here's why the BTC cycle top is in

Macro trends on high time frames aren't to be ignored.
Ascending wedge of all ascending wedges
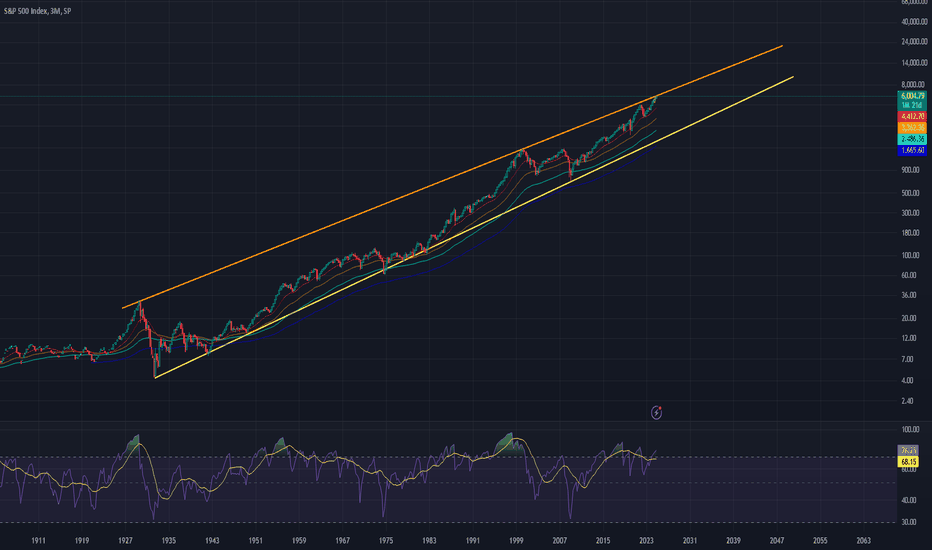
This is the macro top going back to the crash of 1929. Don't stay too long.
This is the top.
If you like eating losses in a depression, all in is the move.
If you're bullish on this, you need your hea examined.
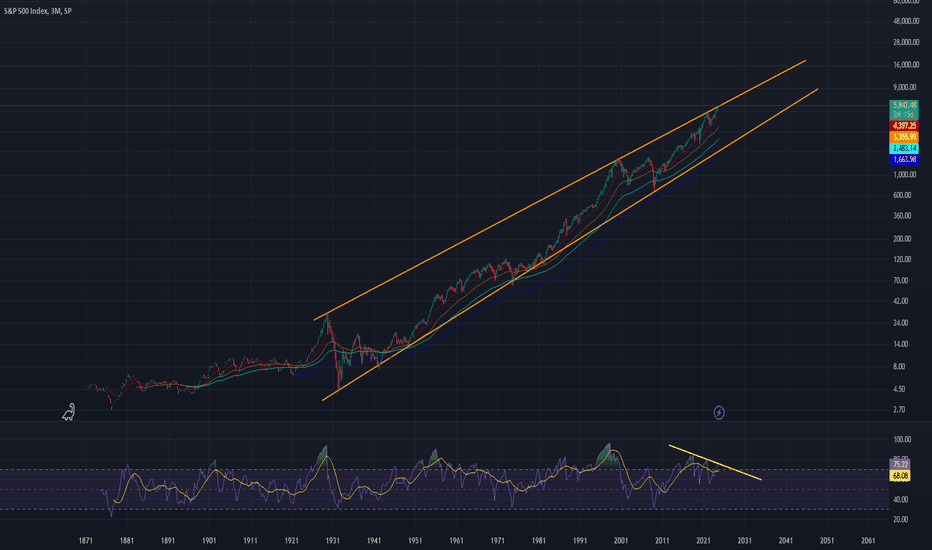
It's all in the title. This chart shows the entire market structure of the SPX from 1929 until now in an ascending wedge and just barely wicking over the top trend. We currently have met every pre-condition for a recession including a 2 year long yield curve inversion, bank unrealized losses 10X what they were prior to the crash of 2008, the Sahm rule having triggered with over a 1% spike in unemployment within the fiscal year, the first fed pivot to make the initial 50 basis points instead of 25, and the DXY on they way up. Bitcoin, and other assets will take damage when the SPX starts it's decline... possibly this week or next week.
Even a dummy should understand this
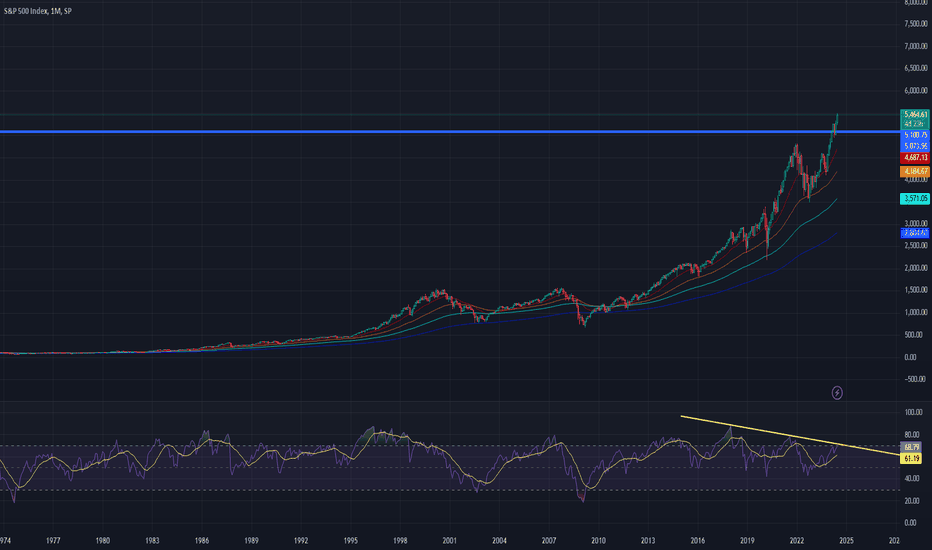
Wroking on a perfect 3 point trend touch on monthly bearish divergence. A multi-generational crash is coming. All of this while we have the longest period 10 yr bond yield curve inversion in market history and 10% of stocks holding 75% of the entire stock market cap as in 1929 before the great depression. Hold at your own risk and find out why they say don't invest more then you're willing to lose. Best case scenario for BTC would be USDT.D revisiting it's weekly bottom trend on the linear but momentum oscillators are sharply down and NDQ weekly has a gravestone doji. Look to Nvidia to be the determinant factor for bounces and remember that, when it dumps, algorithms will sell everything.
Disclaimer
Any content and materials included in Sahmeto's website and official communication channels are a compilation of personal opinions and analyses and are not binding. They do not constitute any recommendation for buying, selling, entering or exiting the stock market and cryptocurrency market. Also, all news and analyses included in the website and channels are merely republished information from official and unofficial domestic and foreign sources, and it is obvious that users of the said content are responsible for following up and ensuring the authenticity and accuracy of the materials. Therefore, while disclaiming responsibility, it is declared that the responsibility for any decision-making, action, and potential profit and loss in the capital market and cryptocurrency market lies with the trader.