Technical analysis by fishguru73 about Symbol SPYX on 10/16/2024
https://sahmeto.com/message/3675011

If you're bullish on this, you need your hea examined.
Neutral
Price at Publish Time:
$5,842.47
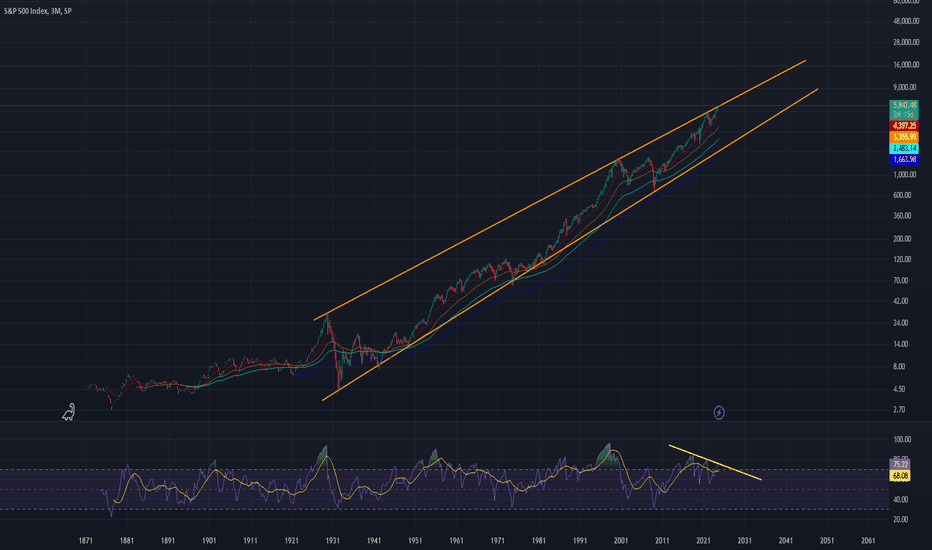
It's all in the title. This chart shows the entire market structure of the SPX from 1929 until now in an ascending wedge and just barely wicking over the top trend. We currently have met every pre-condition for a recession including a 2 year long yield curve inversion, bank unrealized losses 10X what they were prior to the crash of 2008, the Sahm rule having triggered with over a 1% spike in unemployment within the fiscal year, the first fed pivot to make the initial 50 basis points instead of 25, and the DXY on they way up. Bitcoin, and other assets will take damage when the SPX starts it's decline... possibly this week or next week.
Source Message: TradingView