
emreyavuz84
@t_emreyavuz84

What symbols does the trader recommend buying?
Purchase History
پیام های تریدر
Filter
emreyavuz84
EGLD در کف قیمت تاریخی: فرصت خرید با پاداش ریسک خیرهکننده تا 18 برابر!
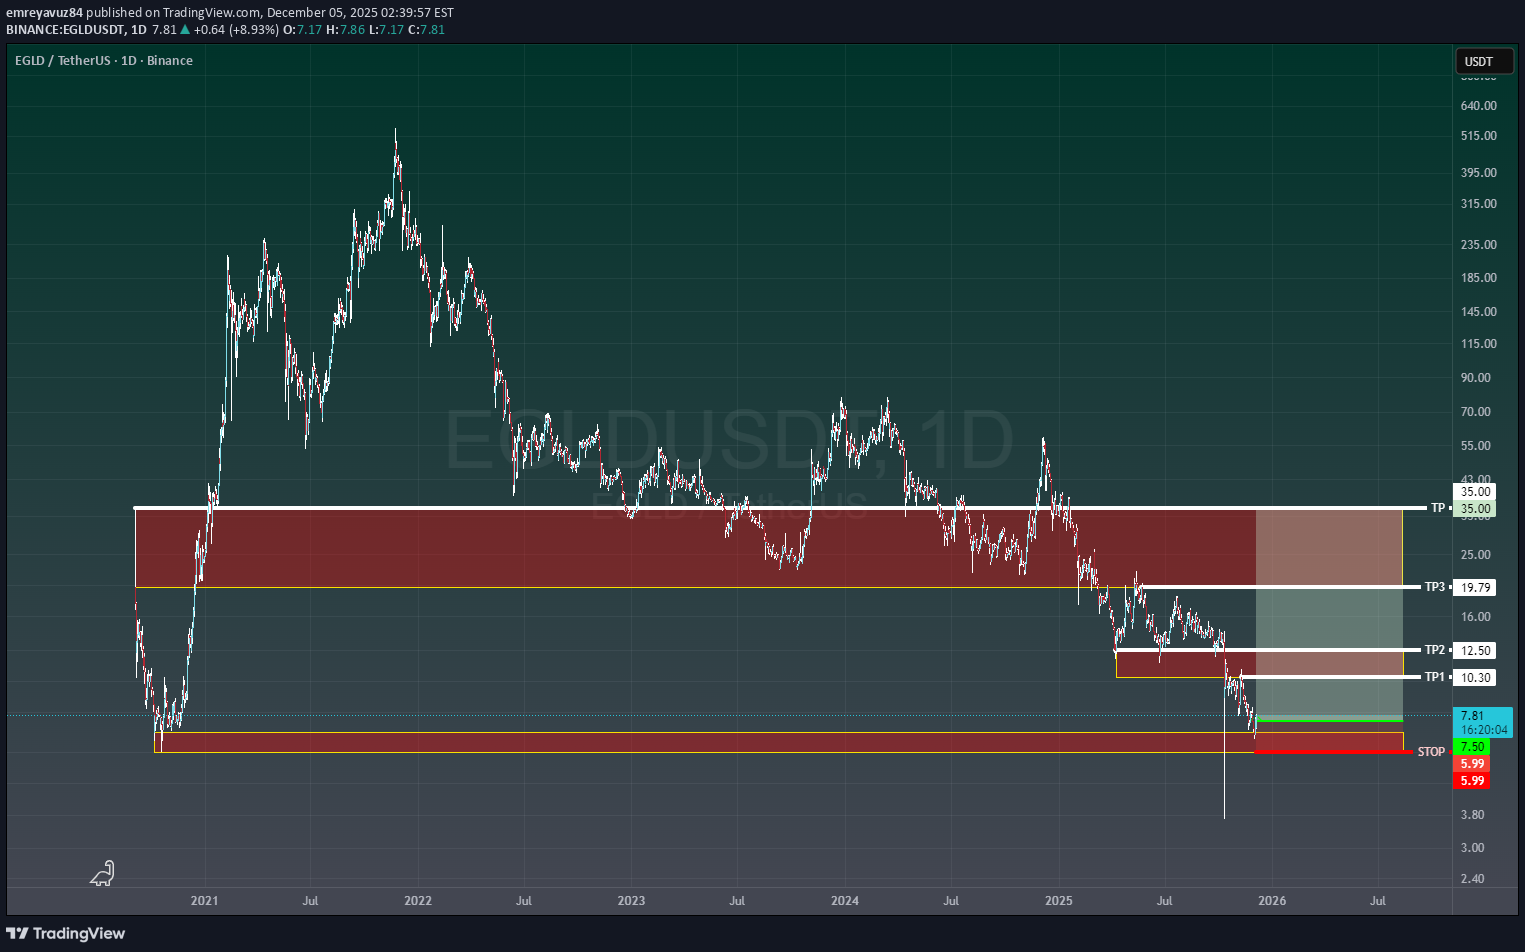
Chart Context: • Pair: EGLD/USDT • Timeframe: 1D • Exchange: Binance • Structure: Multi-year downtrend, now testing historical demand zone. Analysis: EGLD has completed a full cycle from its 2021 peak (> $500) into a prolonged structural decline. Price recently swept deep liquidity at $5–$6 , signaling capitulation and absorption. This zone aligns with historical demand and offers asymmetric risk/reward for tactical longs. Key Levels: • Entry: $7.50 • STOP: $5.99 (below capitulation wick) • TP1: $10.30 • TP2: $12.50 • TP3: $19.79 • TP4: $35.00 Risk/Reward Profile (Entry $7.50): • Risk: $1.51 • TP1: Reward $2.80 → 1.85R • TP2: Reward $5.00 → 3.31R • TP3: Reward $12.29 → 8.14R • TP4: Reward $27.50 → 18.21R • Blended R (25% scale-out each TP): ~7.88R Execution Plan: • Initial STOP: $5.99 • Scale-out: – TP1: 10% – TP2: 20% – TP3: 30% – TP4: 40% • Trail: – Move to break-even after TP1 – Structure-based trailing after TP2 – ATR trail after TP3 Market Maker Perspective: • Liquidity sweep into $5 zone suggests inventory accumulation. • Path of least resistance: fill inefficiencies toward $10–$12, then target buyside liquidity near $20+. • Macro trend remains bearish; this is a counter-trend play , not a confirmed reversal until $15+ is reclaimed. Risk Disclaimer: This is not financial advice . Crypto assets are highly volatile. Manage risk strictly and size positions conservatively.
emreyavuz84
سولانا (SOL) در نقطه سرنوشت: آیا قیمت به ۱۰۰۰ دلار میرسد یا سقوط میکند؟
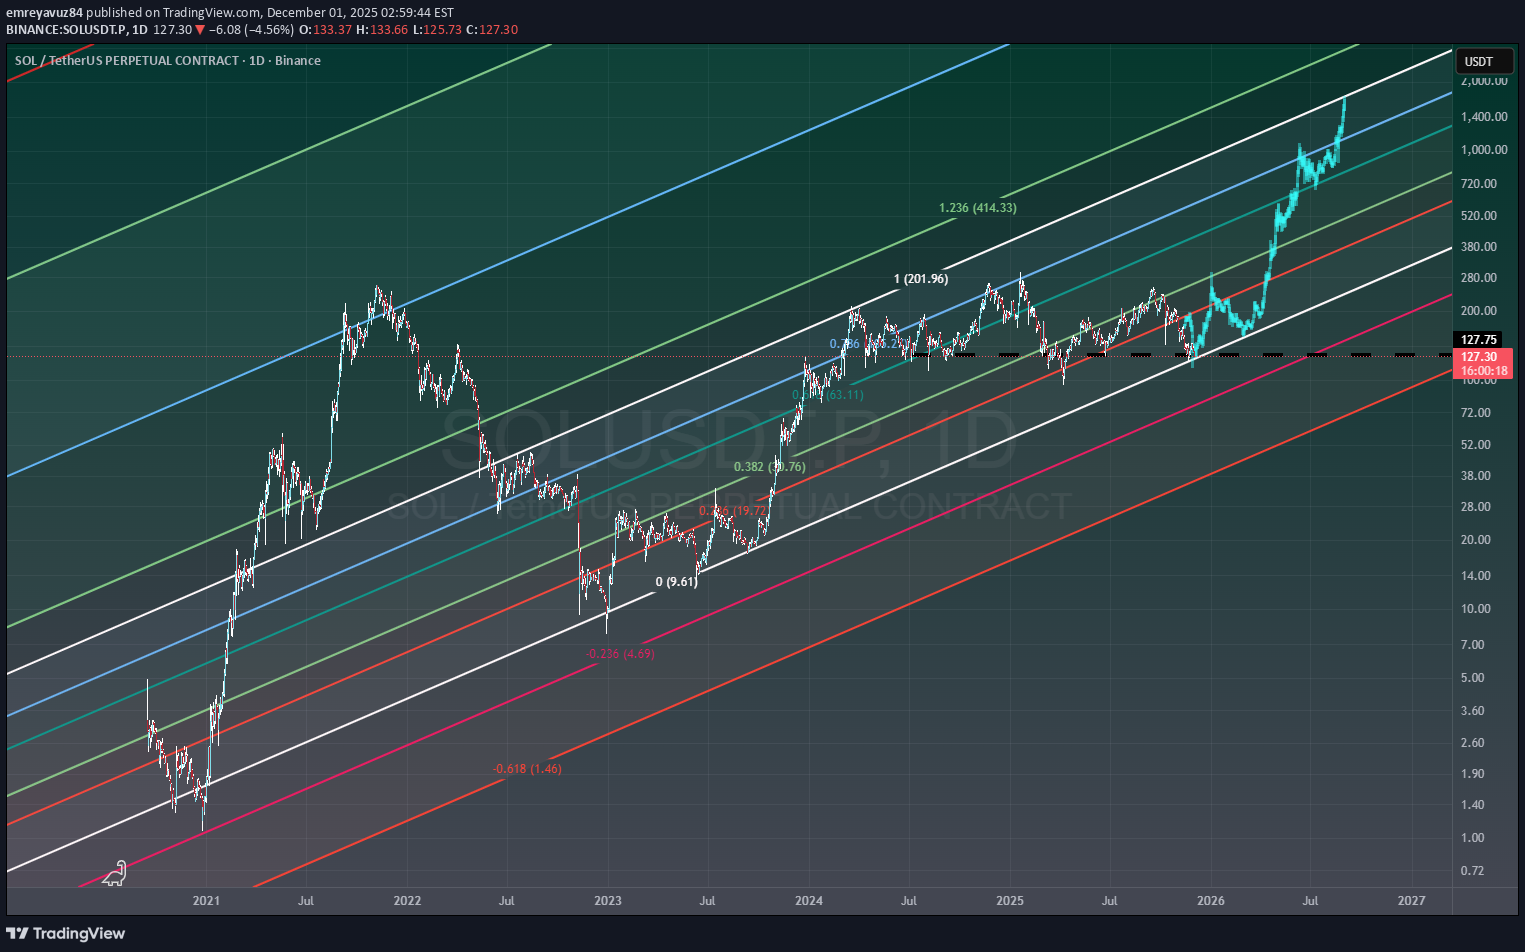
According to fib channels, since 2020 September we only see one time degradation of SOL in late December 2020 which responded from -0.236 and starts its rally. Now we are in the same zone . and have two different scenario in hand: 1. Fib 0 is trying to support the price once again. if we lose this support, price will see 75-80 support level around Fib -0.236 . Do not want to share any worse scenario but it is also be catastrophic if price lose support of Fib -0.236 . 2. As a positive scenario, Until the end of 2027 we will see the price will rush to the Fib 1 (Approx 1K) We will see which scenario is going to be validated, but just fingers are crossed for the 2nd scenario.
emreyavuz84
We found the Next LUNA :)

This is again lunatic futuristic and crazy idea. but who knows? Currently in weekly timeline, we had a shark pattern occurring. We reached the C point but still has an option to raise till 173.484 which is Fib 1.618 for A-B. so if this occurs, we will have our next LUNA here. D target will be around 10 cent. (%99.75 fall) as I said, this is a lunatic idea... please invest with your own research...
emreyavuz84
RSI Uptrend Not broken - Yet

When you check the RSI you may lead to a divergence but somehow also RSI support lane is holding the BTC uptrend. There are couple of ideas floating on my mind. 1. With a good cash flow, we may see an incredible uprising on BTC price which lead us to break 44500 / 47200 resistance up to 50K 2. If we lose the RSI support, as there is a gap in CME index near 39800, we may decline to there really quick. and rest will be all related with support at that zone. If we did not get support here, we may see a huge decline in price to 35K ( ~%10 decline in price) In both ways, we are on the verge of huge (~%10) action. Let's see where we will end up.
emreyavuz84
Lets bake a Bake, shall we ?

This is some futuristic, optimistic, lunatic, crazy idea. but who know ? lets follow up the opportunity. Targets are really promising. Seer indicator is also leads in the long position already. Just need to follow up. SRSI and also RSI is also in a condition where we can able to reach these targets.Bake reached the neck. watch from here for right shoulder.I dropped of the BAKE as it is enough for me. Nearly hit the Head target. Soooo we did a nice work here... Don't forget to follow me up on twitter / X and TelegramForget the follow up. we nearly hit the target with handle and cup :D
emreyavuz84
All deals are on the table

There is 3 HS/IHS for BTC. This is the latest one I see. Older HS and IHS companions points 13300 - 9800 range. (Failure IHS and HS scenarios. You can find these on previous published ideas.) With this new IHS, I put all deals on the table...
emreyavuz84
TOMO =? TOBO

I never trust influencer / speculative / Over-Volatile parities, also I had to share what I see. There is a possible H&S pattern forming. Targets are around %40 for Shoulder ( 2.2797), %85 for Head (2.996) from possible neck line...
emreyavuz84
BTCUSDT.P Dreams are coming true

Our dreams are going to be true ? It seems yes. we got the right shoulder, we crossover the neck, and raised close to the Shoulder target WITHOUT neck retest. If possible retest happens, we will see the price fall between 26.5K - 25.2K which is enough to confirm the IHS then we will see 31.8K and 35K step by step. Let's follow up it here
emreyavuz84

emreyavuz84
New BNXUSDT S/R

New Tokens are distributed with scale of 1/100. S/R also generated with this scale from old BNX ATH : Light Blue Highest ATH-HIGH Trend: Fuschia S/R's : Yellow Lowest ATL - LOW Trend : Green ATL : Red Daily LHL Trend-based fib also added.
Disclaimer
Any content and materials included in Sahmeto's website and official communication channels are a compilation of personal opinions and analyses and are not binding. They do not constitute any recommendation for buying, selling, entering or exiting the stock market and cryptocurrency market. Also, all news and analyses included in the website and channels are merely republished information from official and unofficial domestic and foreign sources, and it is obvious that users of the said content are responsible for following up and ensuring the authenticity and accuracy of the materials. Therefore, while disclaiming responsibility, it is declared that the responsibility for any decision-making, action, and potential profit and loss in the capital market and cryptocurrency market lies with the trader.