
ehmopi
@t_ehmopi

What symbols does the trader recommend buying?
Purchase History
پیام های تریدر
Filter
ehmopi
BTCUSDT, ELLIOTT WAVE ANALYSIS

This chart represents a technical analysis of Bitcoin based on the Elliott Wave Theory. It appears that the analyst has used this pattern to predict future price movements. Let's break it down:1. Elliott Wave Pattern:Waves (1) to (5) indicate a large upward movement, typically consisting of five main waves.In this chart, each sub-wave (1, 2, 3, 4, 5) is nested within larger waves, confirming a bullish pattern.Wave (3) is usually the longest and strongest wave, which is clearly visible here.2. Trend Lines:The two sloping yellow and white lines form an ascending channel.The price moves within this channel, with the upper line representing resistance and the lower line acting as support.3. Future Projection:Wave (4) seems to be complete, and Wave (5) is forming, typically indicating a final upward move before a major correction.According to this analysis, the price could reach the range of $140,000 to $160,000.4. Analysis Validity:If the price can sustainably remain above the midline (dashed line), this analysis will be stronger.Breaking below the lower trend line would invalidate the analysis, potentially leading to a deeper correction.✅ Conclusion:This analysis points to a strong bullish trend that, if realized, could be highly profitable. However, as with any technical analysis, these predictions are not guaranteed, and investments should always be made with caution and risk management.This is a personal analysis and not a recommendation to buy or sell!
ehmopi
ETHUSDT DIVERGENCE
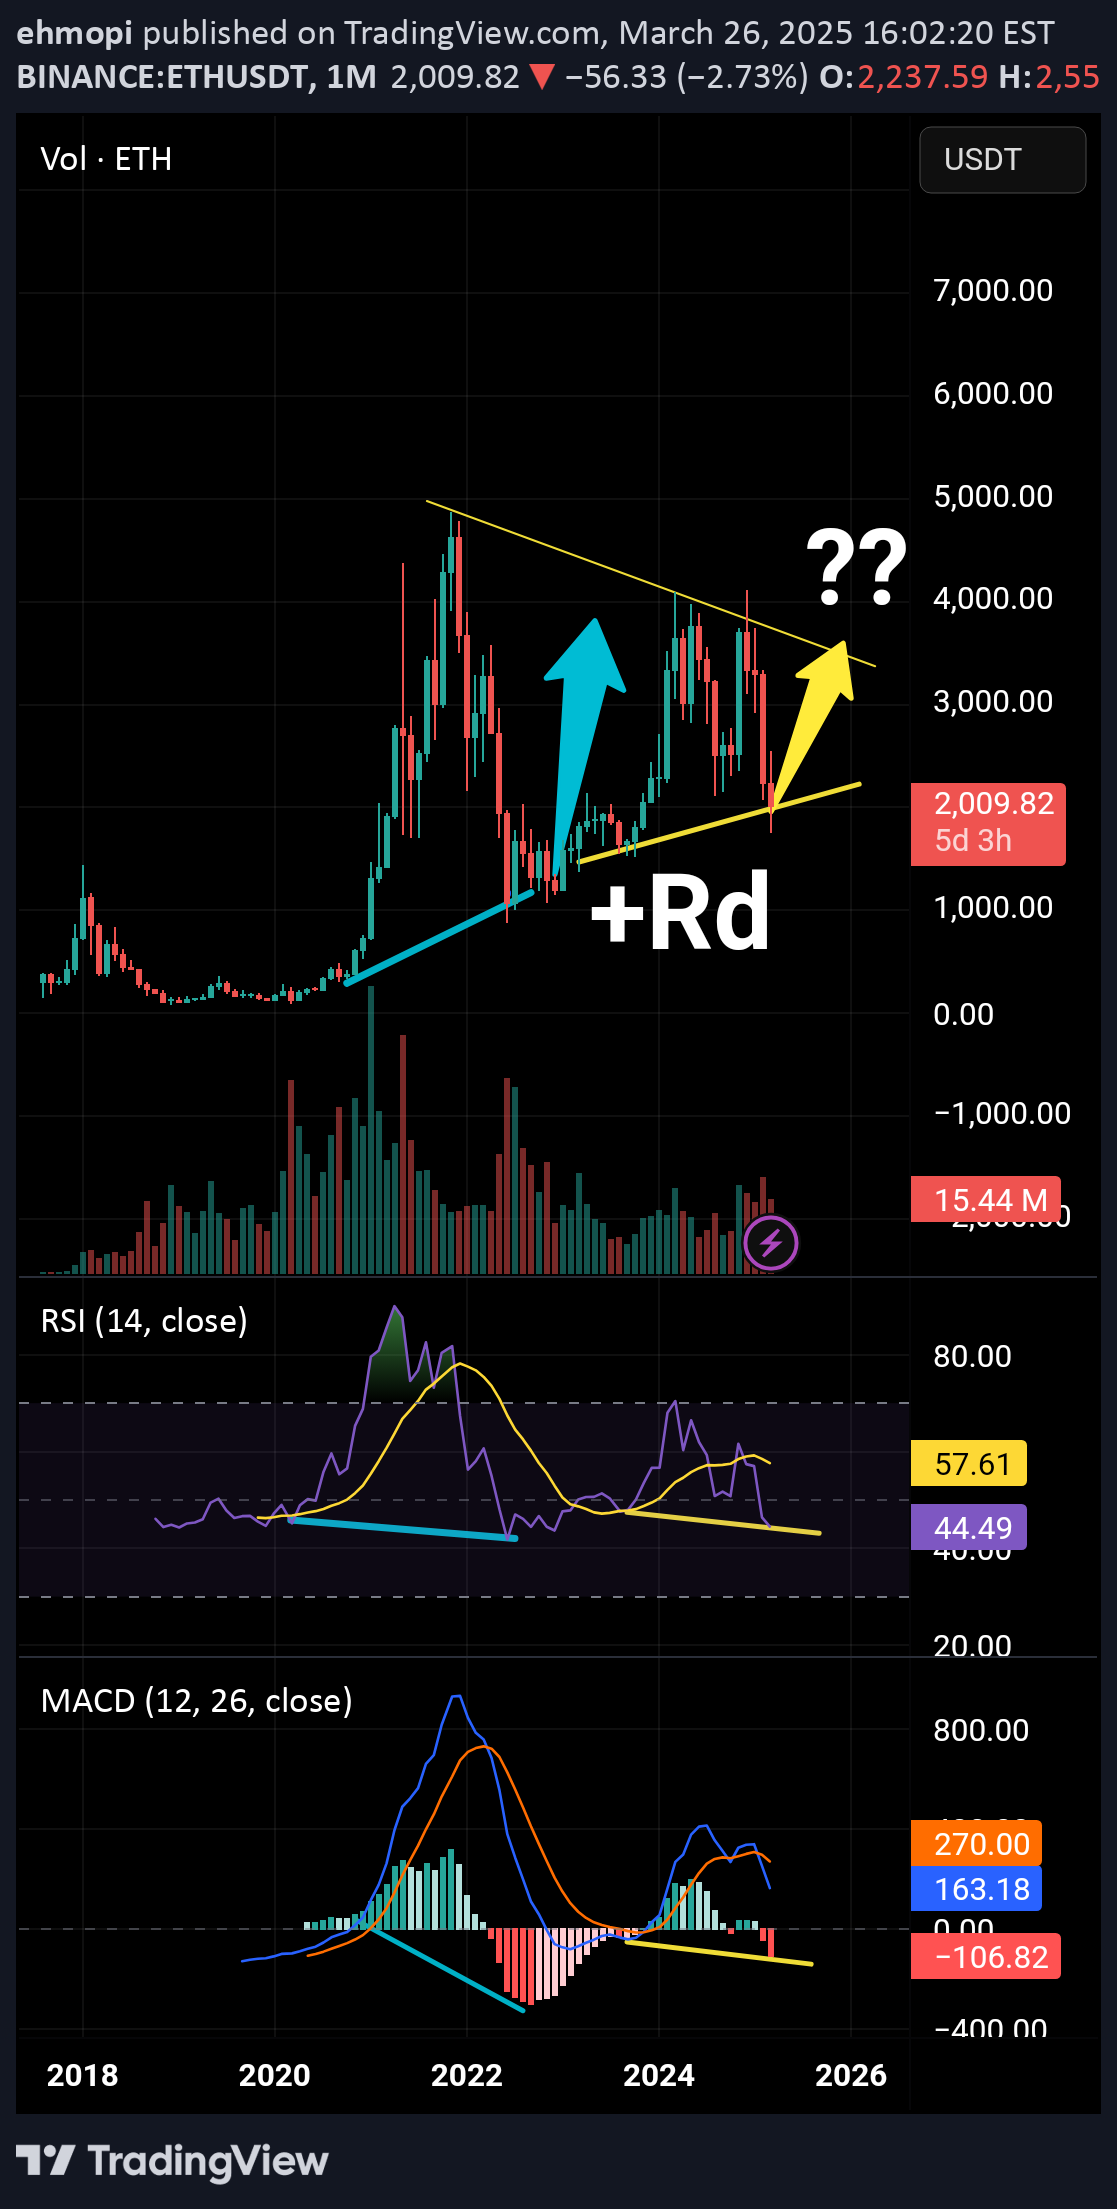
HiThis is a technical analysis chart of Ethereum (ETH/USDT) on a 1-month timeframe. Here’s a breakdown of what’s happening in the chart:1. Triangle Pattern (Yellow Lines)The price is forming a symmetrical triangle, with resistance around $4,000 and support near $1,500-$2,000.A breakout above the upper trendline could signal a bullish move.A breakdown below support may indicate further downside.2. Divergences & IndicatorsRSI (Relative Strength Index): Shows a potential bullish divergence (price making higher lows while RSI makes lower lows).MACD (Moving Average Convergence Divergence): Indicates weakening bearish momentum, possibly setting up for a bullish reversal.3. Possible Scenarios (Yellow Arrow & Question Marks)The yellow arrow suggests a possible breakout toward the $4,000 level.The question marks indicate uncertainty—whether ETH will break upwards or get rejected at resistance.ConclusionETH is at a critical decision point.If it breaks above the triangle resistance, it could rally toward new highs.If it fails and gets rejected, it may test lower support levels.
ehmopi
ETH ELLIOTT WAVE ANALYSIS

This chart appears to be an Ethereum (ETH) price analysis with Elliott Wave Theory applied. It presents two possible scenarios:1. Bullish Scenario (Green Path):A potential upward move toward ~$3,000.After a pullback, a continuation towards ~$4,000+.2. Bearish Scenario (Red Path):A rise toward ~$3,000, but failing to break resistance.A sharp decline below current levels, possibly toward ~$1,200.Would you like help interpreting this further or discussing potential trading strategies?
Disclaimer
Any content and materials included in Sahmeto's website and official communication channels are a compilation of personal opinions and analyses and are not binding. They do not constitute any recommendation for buying, selling, entering or exiting the stock market and cryptocurrency market. Also, all news and analyses included in the website and channels are merely republished information from official and unofficial domestic and foreign sources, and it is obvious that users of the said content are responsible for following up and ensuring the authenticity and accuracy of the materials. Therefore, while disclaiming responsibility, it is declared that the responsibility for any decision-making, action, and potential profit and loss in the capital market and cryptocurrency market lies with the trader.