Technical analysis by ehmopi about Symbol ETH: Buy recommendation (3/26/2025)

ehmopi
ETHUSDT DIVERGENCE
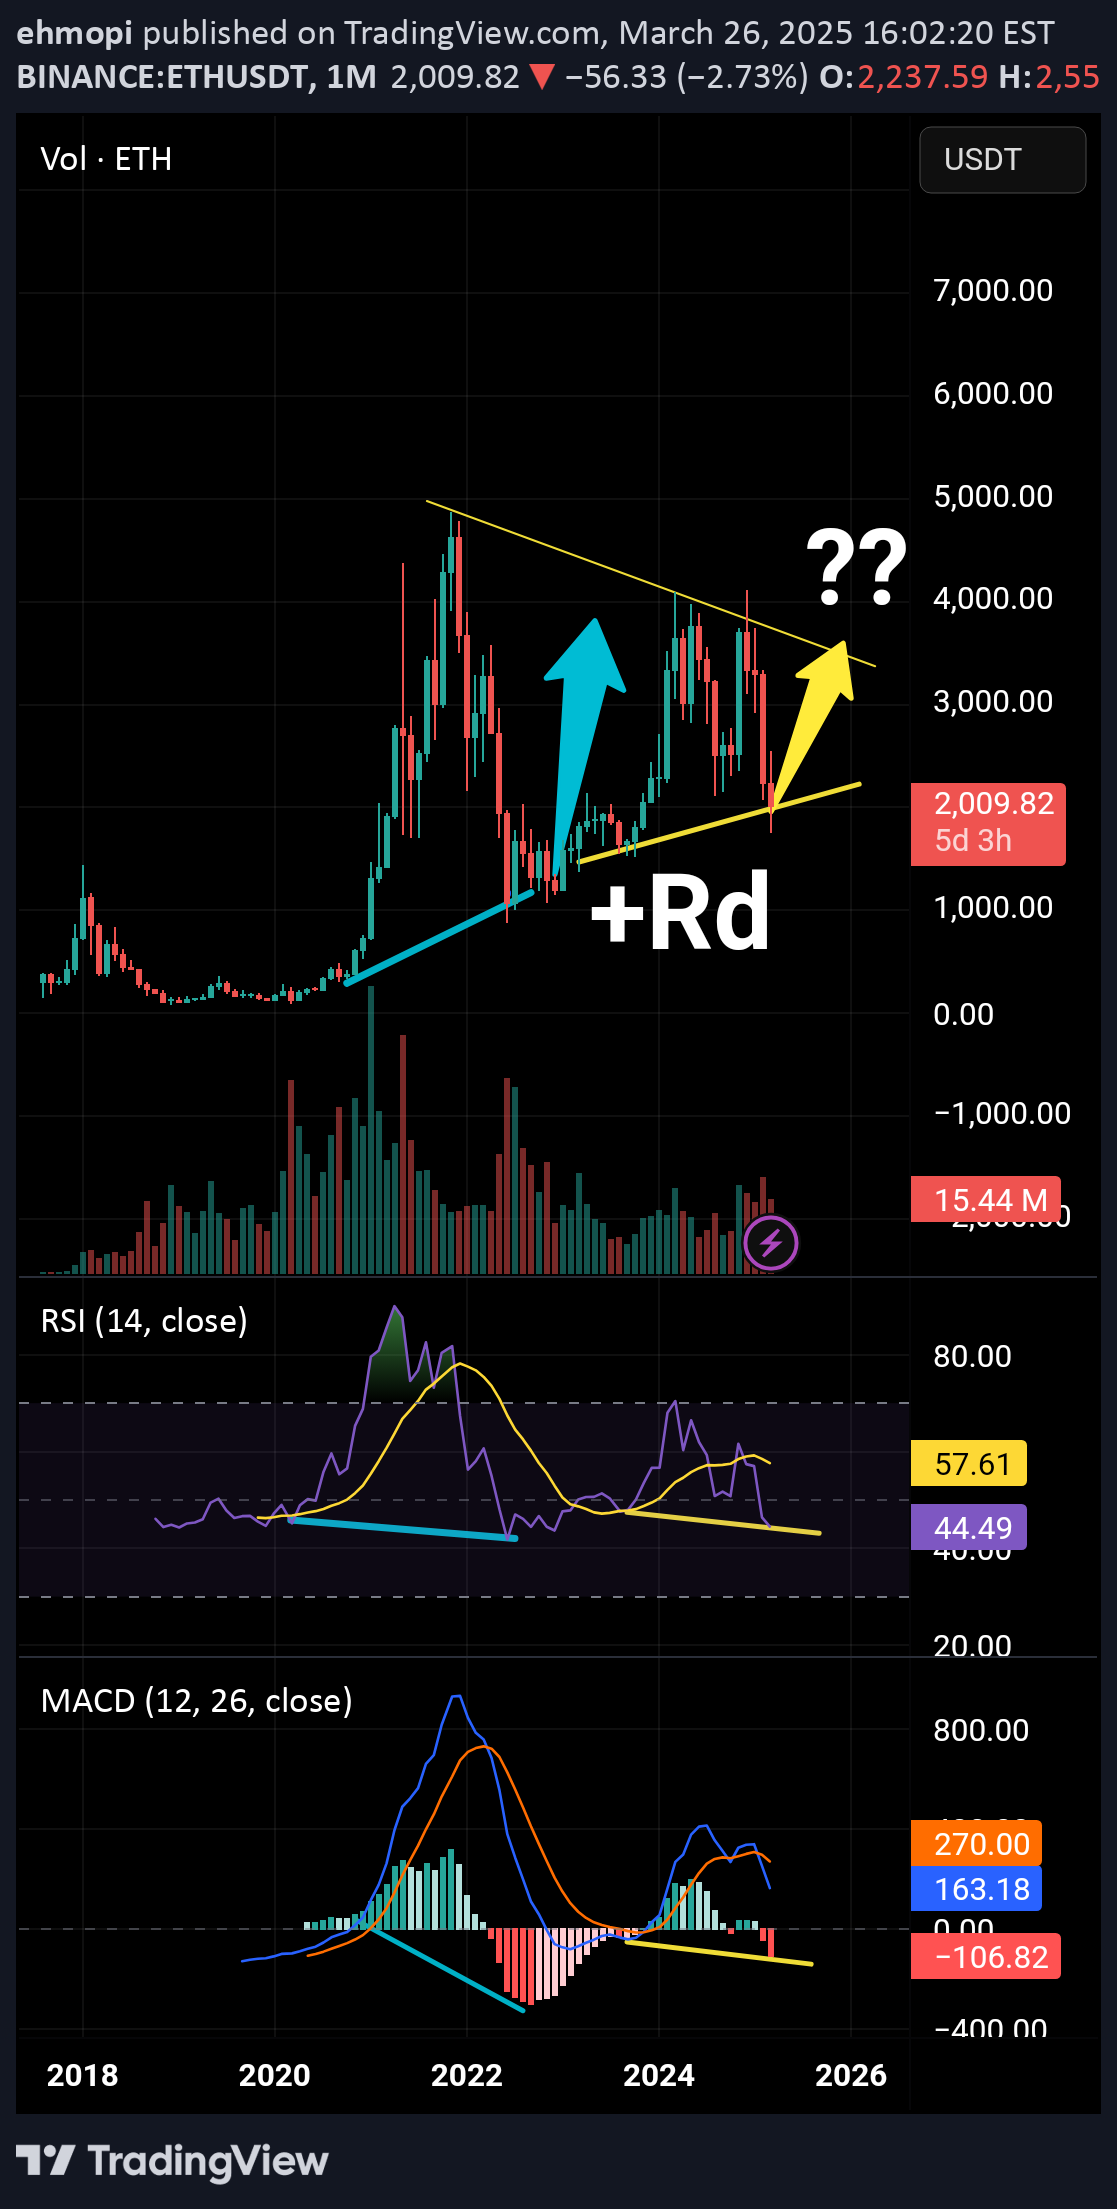
HiThis is a technical analysis chart of Ethereum (ETH/USDT) on a 1-month timeframe. Here’s a breakdown of what’s happening in the chart:1. Triangle Pattern (Yellow Lines)The price is forming a symmetrical triangle, with resistance around $4,000 and support near $1,500-$2,000.A breakout above the upper trendline could signal a bullish move.A breakdown below support may indicate further downside.2. Divergences & IndicatorsRSI (Relative Strength Index): Shows a potential bullish divergence (price making higher lows while RSI makes lower lows).MACD (Moving Average Convergence Divergence): Indicates weakening bearish momentum, possibly setting up for a bullish reversal.3. Possible Scenarios (Yellow Arrow & Question Marks)The yellow arrow suggests a possible breakout toward the $4,000 level.The question marks indicate uncertainty—whether ETH will break upwards or get rejected at resistance.ConclusionETH is at a critical decision point.If it breaks above the triangle resistance, it could rally toward new highs.If it fails and gets rejected, it may test lower support levels.