
drporta
@t_drporta

What symbols does the trader recommend buying?
Purchase History
پیام های تریدر
Filter
SOLANA PART 2

This is a 72min chart. For further explanation look at part 1. This chart shows a consolidation taking place between the range's levels 0.5 and 0.382. Can not have a candle close below 51.41. That invalidates this idea. Targets shown at the upper part of the range.
New Solana consolidation pattern!

New Solana consolidation pattern! This idea I will explain in 2 different charts. This is the "micro" (and the super micro is seen in the 1 min chart). I'll post a 72min chart next to this one where one can clearly see the levels. Anyhow, consolidation is taking place at the 0.5 and currently at the 0.382 level. This las micro pattern of consolidation has an entry point at 53.11 (remember this number) Further micro patterns may have a different entry point, but all of this is happening at the macro zone between 0.5 and 0.382. This consolidation has its target at the 69-71 level which is again a huge move. Lets see what happens. Don't forget to look at chart 2 for this idea.
Solana’s target defined.

Idea combines Dow, Wyckoff and Fibonacci Market maker just drew Solanas range with a surgical rebound at the 0.382 level. Could go as low as 0.5 without being weird (45.13) Expect some type of consolidation and will be looking like the top is in. Will do its thing and then go to the target zone. Wouldn’t expect to run this level, it then again anything could happen. Just an idea, trying to figure out the market’s maker view. Exiting price action!
How to buy a bull run

Combining Dow, Wyckoff, Fibonacci. This is a 18 min chart From wick low to wick high. Notice how the buying was done at the 0.236 level acknowledging it had already been bought at the 0.382 Price then stalls at the -0.382 (mirror image)
Trying to jump into NEO
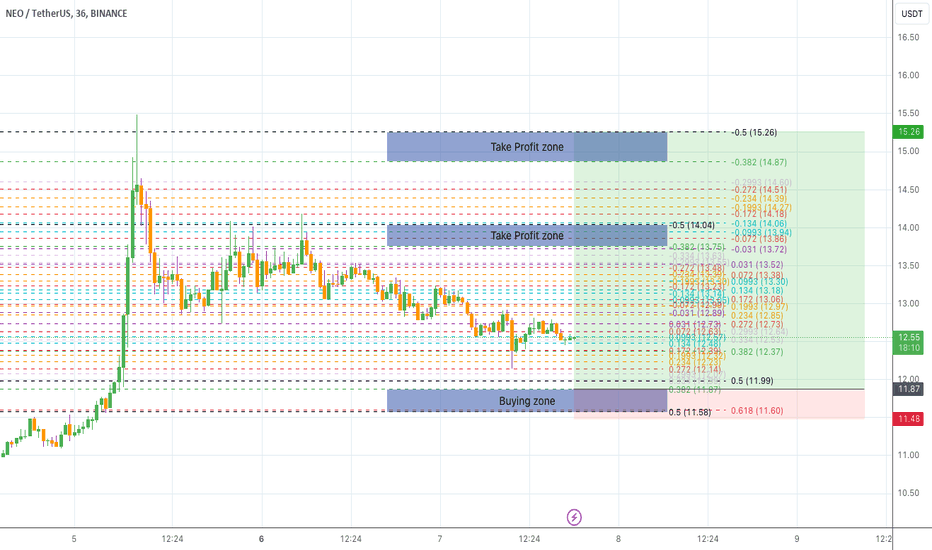
Ideas combine Dow theory, Wyckoff and Fibonacci. No other indicator used. Neo is currently moving down after a huge selloff. After careful examination and looking for the equilibrium zone, it is found that highest probability zone for optimal buying sits between 11.87 - 11.58 area (between the 0.382 - 0.05 levels) A candle-close below 11.58 will invalidate the idea. Looking at a 36 min chart here.
Solana ready for takeoff!

Beautiful accumulation pattern! Solana is ready for another leg up. Modified Fibonacci levels shown perfectly respected. Target levels for this leg should at the very least take it to the 47 level Why 72min chart? One might find it easier to divide the day by percentages. 1 day 1440 min 10% of the day 144min 5% or the day 72min Also I just like that 144 is a Fibonacci number
Making sense of Bitcoin's price action

This idea combines Wyckoff theory, Dow theory and modified Fibonacci. I'm trying to make sense of the "random" price action. Buying low... (what is low) and Selling high... (what is high) Enjoy!.
Medium-term view on Bitcoin

This idea combines Dow theory, Wyckoff theory and modified Fibonacci retracements and extension. Also uses fractal theory and focuses on movement's size proportions. In the proportion shown, Bitcoin was bought at the -0.382 extension and has been doing its thing going up since then. Recently crossed de middle section of the Fibonacci (area between 0.031 and -0.031) and is completing its "mirror image" from the -0.134 to the 0.134 level where is stalling at the moment. Will possibly complete the other 2 "mirror images" shown at the -0.272 - +0.272 level and at the -0.382 - + 0.382 Could easily go all the way up to the +0.5%. where one would expect a pullback and further analysis would indicate if it could go higher. Medium term bitcoin is going back to 49412.00
The train hasn't left the station! Solana perfect retrace levels

This is an idea that combines Wyckoff theory, Dow theory and modified Fibonacci retracements and extensions. Simply put and visually very clear. There is accumulation at the 0.382 level and now at the 0.236. Possible leg up coming once the buying is done. Expect a 17% move up to the 47.06 level. (-0.5% extension). Good luck
Disclaimer
Any content and materials included in Sahmeto's website and official communication channels are a compilation of personal opinions and analyses and are not binding. They do not constitute any recommendation for buying, selling, entering or exiting the stock market and cryptocurrency market. Also, all news and analyses included in the website and channels are merely republished information from official and unofficial domestic and foreign sources, and it is obvious that users of the said content are responsible for following up and ensuring the authenticity and accuracy of the materials. Therefore, while disclaiming responsibility, it is declared that the responsibility for any decision-making, action, and potential profit and loss in the capital market and cryptocurrency market lies with the trader.