
dennishrndz
@t_dennishrndz

What symbols does the trader recommend buying?
Purchase History
پیام های تریدر
Filter
Signal Type
dennishrndz

Last 5–7 Days of candles:-Series of small-bodied candles with long wicks, especially on top → indecision and rejection from higher levels- Several failed attempts to close above $2.30 (61.8% Fib) → strong selling pressure at resistance- May 30–31 candle: Small red body, closes near the low of the day → mild bearish continuation- Volume decreasing → no major buyer absorption yetThe current setup looks like a descending triangle / flat support with lower highs.Price broke slightly below the horizontal line around $2.17 — bearish structure breakdown if confirmed with follow-throughPrice closes below $2.15, ideally under $2.10 on strong volume.Would signal "failure to hold" the short-term range → leads to move toward next strong support at $2.00–$1.95If $1.95 fails to hold on daily close → next leg lower to:- $1.61 (38.2% Fib) — strong buy level- Possibly even $1.29 in a broader flush-out (only if Bitcoin also drops)*Drop your comment or thoughts on XRP**REMEMBER, everything is probability, nothing is investment advice. Educational only!
dennishrndz

Watching $7.30 for Rebuy Zone After Support FailsTRUMPUSD just broke key EMAs and is testing long-term support. Watching for buy zones near $9–7.30. Targeting a bounce toward 13.50–17.20 on recovery.Volume is increasing on red days, RSI shows bearish momentum at 38, and a bearish divergence has triggered. The 23.6% Fib level at $17.22 has now become a strong resistance barrier.Support is breaking. Don’t try to be a hero mid-fall. Let price come to you. The real value lies near $7.30–9.00, and the best profits will come on the reversal. Trim into strength, not into weakness.*REMEMBER, everything is probability, nothing is investment advice. Educational only!
dennishrndz

TRUMP/USD is holding firm at a major confluence zone; the bottom of a month-long consolidation box and a clean uptrend line that’s been respected since early May.Price is compressing just above the $12.30–$12.50 support zone, setting the stage for a potential breakout attempt if demand holds. Volatility has dried up, signaling accumulation.Technical Breakdown: Support: ~$12.30 horizontal + rising trendline Resistance 1: ~$13.50 (mid-range reaction zone) Resistance 2: ~$14.80–$15.00 (top of the range) Breakout Target: $16.40 (April high), $18.80 (fib extension)Strategy: Buy Zone: $12.30–$12.60 (trendline support) Add-on: Break and hold above $15.00 Stop: Close below $12.00 or trendline violation Invalidation: Breakdown with volume under $12.00Let price confirm strength above $13.50 and volume surge above $15 — don’t chase, trade the structure, not the emotion.*REMEMBER, everything is probability, nothing is investment advice. Educational only!
dennishrndz

XRP/USD is trading above a long-term rising trendline, consolidating tightly in a bullish compression pattern.This setup resembles a classic “coiled spring,” with price tightening just above key support. We’ve had consistent higher lows since late 2024, and the current structure favors a breakout over $2.70, which would open the door for a run to $3.50 and $5.00+1. Trendline Support: Clean bounce from ~$2.00, higher lows holding since November 20242. Resistance: Horizontal resistance at $2.70 is the breakout level3. RSI: Neutral (~50.88), resetting for a fresh move4. MACD: Bullish crossover, momentum building slowly5. Volume: Declining — typical before breakout patternsA. Buy Zone: $2.00–$2.20 (support touch)B. Breakout Add-on: Over $2.70 with strong volume*Risk management is key. The longer this consolidates above trendline support, the stronger the breakout move will be. Of course, all is probability, but this is what I'm seeing. **Clearly this isn't investment advice, only educational. ALWAYS seek a professional when investing.
dennishrndz
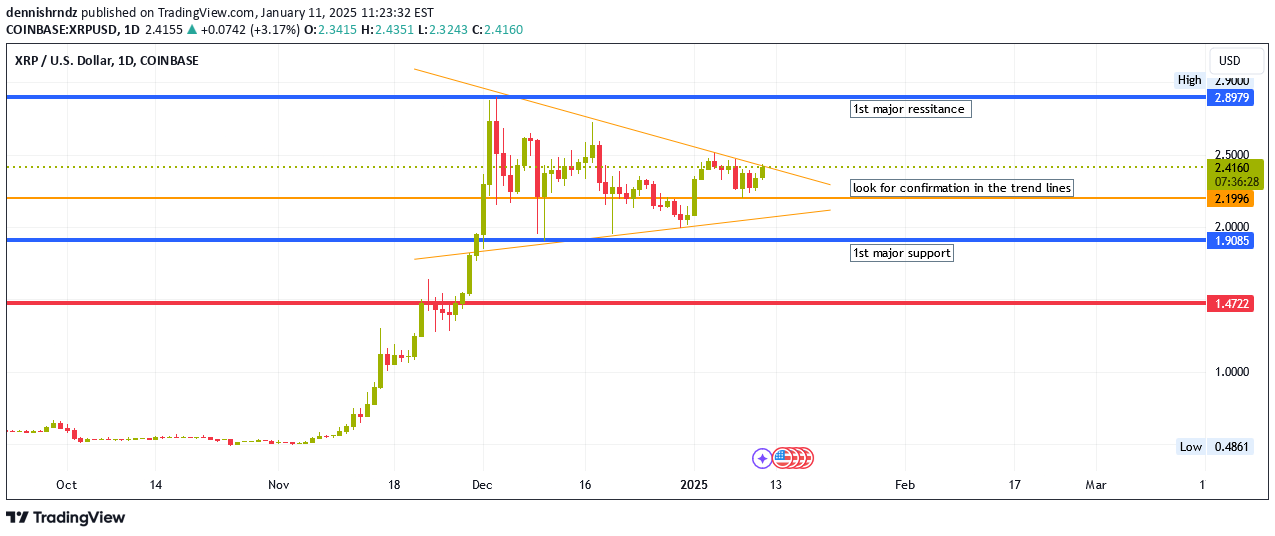
XRP is maintaining its bullish momentum, with the price currently at $2.405, up 2.58% on this Saturday morning. The cryptocurrency's next major resistance level appears to be around $2.50, while a significant support level is observed at approximately $1.902If XRP breaks below the $1.90 support, there's a possibility it could decline further to around $1.303. However, it's crucial to note that XRP has shown strong performance recently, adding 58,000 new wallets since the start of 2025 and experiencing an 18% market cap rise in the first three days of the new year.As always, it's essential to look for confirmation of any price movements and conduct your own thorough research before making any investment decisions. This is not financial advice.
Disclaimer
Any content and materials included in Sahmeto's website and official communication channels are a compilation of personal opinions and analyses and are not binding. They do not constitute any recommendation for buying, selling, entering or exiting the stock market and cryptocurrency market. Also, all news and analyses included in the website and channels are merely republished information from official and unofficial domestic and foreign sources, and it is obvious that users of the said content are responsible for following up and ensuring the authenticity and accuracy of the materials. Therefore, while disclaiming responsibility, it is declared that the responsibility for any decision-making, action, and potential profit and loss in the capital market and cryptocurrency market lies with the trader.