
cyscalpingvip
@t_cyscalpingvip

What symbols does the trader recommend buying?
Purchase History
پیام های تریدر
Filter
cyscalpingvip
BTC/USDT Analysis – 30-Minute Chart (OKX)

BTC/USDT Analysis – 30-Minute Chart (OKX)Key Support Levels:Immediate support: 82,596 USDTStronger support: 81,900 USDT (Potential entry point)Stop-loss: Below 79,426 USDT (Risk management)Key Resistance Levels:First resistance: 84,326 USDTNext resistance: 85,726 USDT (Major supply zone)Higher targets: 87,702 – 88,547 USDTIndicators & Market Structure:BTC is testing a short-term support after a bearish move.The Stochastic RSI shows an overbought condition, signaling a potential retracement.The EMA 20, 50, 100, and 200 are showing mixed signals; BTC needs to break above EMA 100 to confirm bullish momentum.The MACD histogram is showing early signs of bullish momentum.Trade Plan:Bullish case: If BTC holds 82,596 – 81,900 USDT, a reversal towards 84,326 – 85,726 USDT is possible.Bearish case: If BTC drops below 81,900 USDT, further downside towards 79,426 USDT may happen.📌 Summary:BTC is at a crucial level, consolidating around support. If it holds above 82,596 USDT, we could see a bounce toward 85,726 USDT. However, a break below 81,900 USDT could trigger more downside. Monitor price action carefully before entering a position. 🚀
cyscalpingvip
DOT/USDT Analysis – 1D Chart (OKX)

DOT/USDT Analysis – 1D Chart (OKX)Support Levels:First support: 4.239 USDTNext support: 3.652 USDT (Key Demand Zone)Resistance Levels:First resistance: 6.008 USDTNext resistance: 7.652 USDT (Supply Zone)Major resistance: 9.476 – 11.654 USDTEntry Points:Potential buy zone around 3.652 USDT, which aligns with demand support.A breakout above 6.008 USDT could signal bullish momentum toward 7.652 USDT.If DOT drops below 3.652 USDT, further downside movement is possible.Risk Assessment:If the price fails to hold 3.652 USDT, it may enter a deeper downtrend.Stop-loss should be placed below 3.652 USDT to limit risk.Trade Conditions:DOT is currently in a bearish trend, but a potential bullish reversal is forming.If it breaks the descending wedge pattern, we may see a move towards 6.008 USDT.A breakout above 7.652 USDT could confirm a stronger bullish trend.📌 Summary:DOT is trading near a key support zone. If it holds above 4.239 – 3.652 USDT, a bullish reversal is possible. A move above 6.008 USDT could confirm further upside. However, if it falls below 3.652 USDT, it may continue the bearish trend. 🚀
cyscalpingvip
GMT/USDT Analysis – 1D Chart (OKX)

GMT/USDT Analysis – 1D Chart (OKX)Support Levels:First support: 0.0501 USDTNext support: 0.0478 USDTKey support: 0.0407 – 0.0401 USDTResistance Levels:First resistance: 0.0953 USDT (Supply Zone)Next resistance: 0.1517 USDTMajor resistance: 0.1974 – 0.2638 USDTEntry Points:If the price holds above 0.0501 USDT, it may be a potential long entry opportunity.A breakout above 0.0953 USDT could lead to a further move towards 0.1517 USDT.If the price drops below 0.0478 USDT, selling pressure may increase.Risk Assessment:If the price falls below 0.0401 USDT, it could drop further to 0.0107 USDT.Stop-loss should be placed below 0.0401 USDT.Trade Conditions:GMT is in a strong downtrend but currently forming a potential bottoming structure.If it breaks above 0.0953 USDT, there could be a bullish reversal.If it fails to hold 0.0501 USDT, the downtrend may continue.📌 Summary:GMT is at a crucial support zone. If it holds above 0.0501 USDT, it could attempt a bullish recovery. However, if it fails to break above 0.0953 USDT, further downside movement is possible. Watch price action closely before making a decision. 🚀
cyscalpingvip
Ethereum (ETH/USDT) Analysis – 4H Chart (OKX)

Ethereum (ETH/USDT) Analysis – 4H Chart (OKX)Support Levels:First support: 1,912 USDTNext support: 1,911 USDT – 1,909 USDTKey support: 1,889 USDTResistance Levels:First resistance: 1,933 USDT (Supply Zone)Next resistance: 2,048 USDTMajor resistance: 2,244 USDT (Fibonacci 0.382 zone)Entry Points:If the price holds above 1,911 - 1,912 USDT, it could be a Long entry opportunity.If the price breaks 1,933 USDT with strong buying volume, it may test 2,048 USDT.If the price drops below 1,889 USDT, selling pressure may increase.Risk Assessment:If the price breaks 1,889 USDT, it may drop further to 1,876 - 1,753 USDT.Stop-loss should be placed below 1,876 USDT.Trade Conditions:ETH is currently in a consolidation phase, with key resistance at 1,933 USDT.A breakout above this level could lead to a test of 2,048 USDT and beyond.A breakdown below 1,889 USDT may trigger further selling pressure.📌 Summary:ETH is in a potential rebound phase. If it holds above 1,911 - 1,912 USDT, there is a chance for an uptrend. However, if it falls below 1,889 USDT, it could decline further. Watch out for volume and price action before making a trade decision. 🚀
cyscalpingvip
SOLUSDT (30M) Analysis - Should You Short?

📉 SOLUSDT (30M) Analysis - Should You Short?Based on the 30-minute timeframe, SOL is currently trading at 132.85 USDT (-0.52%). Here’s an analysis to help you decide whether to open a short position.⸻🔎 Factors Supporting a Short Position✅ Bearish Signal (50% Down)•Increased selling pressure with indicators signaling a potential downtrend.✅ Fibonacci Retracement Suggesting Downside Targets•TP1: 130.31 USDT (-4.5%)•TP2: 128.48 USDT (-6%)•TP3: 126.64 USDT (-7.6%)•TP4: 124.02 USDT (-9.8%)•TP5: 122.46 USDT (-11%)•TP6: 120.69 USDT (-12.9%)✅ EMA 20 Acting as Resistance•If the price stays below the EMA 20, it could confirm a continued downtrend.✅ Key Support Level at 130.11 USDT•If SOL breaks below this level, the price may drop further toward 128 - 126 USDT.⸻🚨 Risk Factors to Consider Before Shorting❌ Support at 130.11 USDT May Cause a Bounce•Monitor whether SOL holds above this level before entering a short position.❌ Stop Loss at 139.93 USDT (If the Price Reverses Upward)•If SOL breaks above the 136 - 139 USDT resistance zone, it could flip bullish instead.⸻📊 Recommended Trading Strategy📌 Short Entry Conditions:•If SOL closes below 130.11 USDT, a short position targeting 128 - 126 USDT could be considered.•If SOL retests the 136 - 139 USDT resistance and gets rejected, a short entry may be valid.📌 Long Entry Conditions (If Trend Reverses to Bullish):•If SOL breaks above 139 USDT, wait for confirmation before considering a long position.⸻✅ Final Recommendation•Wait for a break below 130.11 USDT before shorting for better confirmation.•Set a stop loss at 139.93 USDT to manage risk.•Use volume and RSI indicators for further validation.📉 Overall: Shorting is viable if SOL breaks below 130.11 USDT, but monitor support levels closely! 🚨
cyscalpingvip
ETHUSDT (4H) Analysis - Support, Resistance & Profit Opportunit

🔥 ETHUSDT (4H) Analysis - Support, Resistance & Profit OpportunitiesBased on the ETHUSDT (4H) chart, here are key support and resistance zones that can guide your trading decisions.⸻📌 1. Key Support & Resistance LevelsPrice Level (USDT)RoleSignificance2,858.82Strong ResistanceSell target if price tests this level2,732.76Fibonacci 0.886 ResistancePotential retracement point2,622.17Fibonacci 0.786 ResistanceKey level for bullish continuation2,436.40Fibonacci 0.618 ResistanceIf broken, potential bullish trend shift2,305.91First ResistanceBreaking above could lead to further gains2,125.10First SupportKey level for buyers to step in1,928.14Current PriceAttempting recovery1,861.48Secondary SupportImportant level for a rebound1,753.00Strong SupportIf broken, potential further downside1,492.03Stop Loss LevelBelow this, long-term downtrend risk increases⸻📊 2. Trading Strategies💰 ✅ Long (Buy) Strategy•Wait for a retest at the support zone 1,861 - 1,753 USDT•Set a Stop Loss below 1,700 USDT•Target Take Profit (TP) levels at 2,125 - 2,305 - 2,436 USDT🔥 Aggressive Entry:•If the price breaks above 2,305 USDT with strong volume, consider a Follow Buy targeting 2,436 - 2,622 USDT⸻📉 ❌ Short (Sell) Strategy•If price rejects at 2,305 - 2,436 USDT with bearish signals (Bearish Engulfing / Shooting Star)•Set a Stop Loss above 2,450 USDT•Target TP levels at 2,125 - 1,928 - 1,861 USDT⚠️ If price breaks below 1,753 USDT, it may drop further to 1,500 USDT⸻🔎 3. Key Signals to Watch✅ If price breaks 2,305 USDT with high volume, bullish continuation is likely.❌ If price gets rejected at 2,305 - 2,436 USDT, a pullback may occur.⚠️ If price breaks below 1,753 USDT, strong selling pressure could follow.⸻💡 Summary•ETH is recovering from 1,928 USDT support•Breaking 2,305 USDT could lead to 2,436 - 2,622 USDT•Failure to break could result in a retest of 1,861 - 1,753 USDT
cyscalpingvip
RUNE/USDT Technical Analysis

RUNE/USDT Technical Analysis1. Current Market Conditions:- Price trading at 1.079 USDT- Showing signs of recovery from recent downtrend- Volume increasing on recent bullish moves- Currently testing resistance levels2. Key Technical Levels:- Major resistance at 1.214 USDT- Immediate resistance at 1.192 USDT- Support established at 1.006 USDT- Secondary support at 0.980 USDT3. Technical Indicators:- Price attempting to break above EMA cluster- Potential bullish reversal forming after 70% retracement- Volume profile showing accumulation at current levels- Early signs of trend reversal with higher lows formingTrading Recommendations:1. Short-term Strategy:- Look for long entries near 1.066 USDT support- Initial target at 1.192 USDT- Stop loss below 1.006 USDT- Consider scaling in positions on pullbacks2. Risk Management:- Maximum position size 1-2% of trading capital- Use tight stops due to high volatility- Consider partial profit taking at resistance levels- Leverage should be kept minimal (1-2x maximum)3. Key Points to Monitor:- Break above 1.192 could trigger stronger rally- Watch for rejection at EMA cluster- Volume confirmation on breakouts- Overall market sentiment affecting alt coinsSummary: RUNE shows potential bullish reversal signs after significant downtrend. Conservative traders should wait for confirmation above 1.192 while aggressive traders can look for entries at current levels with strict risk management.
cyscalpingvip
ADAUSDT Technical Analysis

ADAUSDT Technical Analysis1. Current Market Situation:- Price trading around 0.7278 USDT- Strong downtrend with consistent lower lows and lower highs- Volume showing increased selling pressure- Trading below all major EMAs indicating bearish momentum2. Technical Levels:- Major resistance at 0.8190 USDT- Immediate resistance at 0.7823 USDT- Current support at 0.6922 USDT- Next critical support at 0.6263 USDT3. Technical Indicators:- EMAs in bearish alignment- Price contained within a descending channel- RSI showing oversold conditions- Volume profile indicates distribution phaseTrading Recommendations:1. Short-term Strategy:- Avoid counter-trend buying- Look for short opportunities on rebounds- Key entry for shorts near 0.7823 resistance- Set Stop Loss above 0.81902. Risk Management:- Keep position sizes small (1-2% of portfolio)- Use tight stops due to high volatility- Consider scaling out of positions- Avoid high leverage in current market conditions3. Key Levels to Watch:- Primary resistance: 0.8190 USDT- Critical support: 0.6263 USDT- Channel resistance: 0.7823 USDTSummary: ADAUSDT remains in a strong bearish trend. Conservative traders should wait for clear reversal signals before considering long positions. Short-term traders can look for short opportunities at resistance levels with strict risk management.
cyscalpingvip
Gold Chart Analysis (XAUUSD)
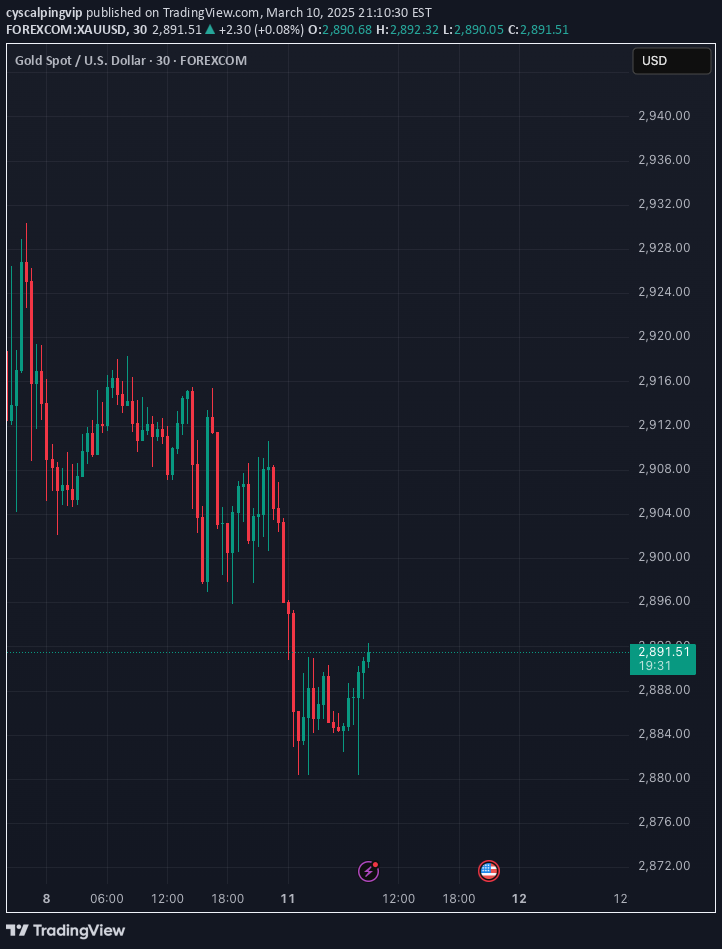
Gold Chart Analysis (XAUUSD)1. Current Situation:- Gold price is around 2,890 USD- Price is consolidating after a downward movement- Increased trading volume in the support zone2. Technical Points:- Key resistance at 2,920 USD- Support level at 2,885 USD- EMA lines showing Bearish Cross signals3. Trading Signals:- Bull Signal at 50% Retracement level- Volume Profile shows accumulation at support- RSI in Oversold zone indicating potential reboundRecommendations:1. Short-term:- Consider buying at support 2,885 USD- Place Stop Loss below 2,880 USD- Take Profit at resistance 2,920 USD2. Risk Management:- Use Position Size no more than 2-3% of portfolio- Be cautious of market opening gaps- Set Trailing Stop to secure profits3. Factors to Monitor:- Fed interest rate policy- USD volatility- International geopolitical tensionsSummary: Gold price is at an interesting point for short-term buying opportunities, but careful risk management is required while closely monitoring external factors.
cyscalpingvip
BTCUSDT Chart Analysis

BTCUSDT Chart Analysis1. Current Trend:- Price is around 78,716 USDT- Continuous selling pressure- High trading volume during downtrend indicating strong selling momentum2. Technical Points:- Key resistance at 83,167 USDT- Next support level at 76,000 USDT- EMA lines showing strong downward momentum3. Trading Signals:- Market is in oversold condition- 2 Early Signal Flips detected- Caution advised for short positions due to sharp decline and potential technical reboundRecommendations:1. Short-term:- Not recommended to enter long positions at current levels- Wait for clear reversal signals- For short positions, wait for rebound opportunities2. Risk Management:- Set Stop Loss at 80,000 USDT if shorting- Take Profit target at 76,000 USDT support level- Limit leverage to maximum 2x during high volatility3. Mid to Long-term:- Consider accumulating when price tests 76,000 USDT support- Monitor trading volume for confirmation- Prepare contingency plan if price breaks below key support levels
Disclaimer
Any content and materials included in Sahmeto's website and official communication channels are a compilation of personal opinions and analyses and are not binding. They do not constitute any recommendation for buying, selling, entering or exiting the stock market and cryptocurrency market. Also, all news and analyses included in the website and channels are merely republished information from official and unofficial domestic and foreign sources, and it is obvious that users of the said content are responsible for following up and ensuring the authenticity and accuracy of the materials. Therefore, while disclaiming responsibility, it is declared that the responsibility for any decision-making, action, and potential profit and loss in the capital market and cryptocurrency market lies with the trader.