
cryptosoracle
@t_cryptosoracle

What symbols does the trader recommend buying?
Purchase History
پیام های تریدر
Filter
cryptosoracle
Long Position DOGE/USDT

🚨 DOGE/USDT – 15-min Outlook: Early Signs of a Bullish Reversal?Following to my recent accurate prediction for a big fall on DOGE/USDT:And a related long prediction on a strong support level of 0.1321 on this post which touched and rebounded where DOGE is now 0.1500: now after tapping into the critical macro support level of 0.1300, DOGE posted a sharp rebound, hinting at a potential mid-term trend reversal.🔹 Current Price: 0.1500🔹 Possible Long Zone: 0.1419 – 0.1340🔹 Target Resistance: 0.1660 (+16% potential upside or even more)📈 Price is currently forming higher lows along a rising intraday trendline. However, a healthy pullback into the Possible Long Zone could provide a premium entry for bulls targeting the 0.1660 resistance—and possibly beyond.🐕 This zone coincides with a previous liquidity sweep and demand reaction, suggesting strong institutional interest. A successful defense here could mark the beginning of a broader recovery leg, even hinting at the early stages of a larger bullish cycle for DOGE.🧠 Key Levels to Watch:Support to Hold: 0.1419Invalidation: Below 0.1340Breakout Confirmation: Clean candle close above 0.1525This setup could shape the next wave of momentum—smart money is watching. Are you?
cryptosoracle
Long Position XRP/USDT

🚨 XRP/USDT – Intraday Outlook (15-min Chart)After reacting strongly to the mid-term support at 1.630, XRP has been climbing steadily and is now testing short-term trendline support to break it down to 1.8153.🔹 Current Price: 1.93🔹 Support Zone to Watch: 1.8153 – 1.7083 (Possible Long Zone)🔹 Upside Target: 2.15+📉 A short-term pullback toward the Possible Long Zone could offer a high-probability long setup. If bulls step in around that level, we might see a trend continuation toward the 2.15 or even higher regions, signaling a potential bullish reversal on the mid-term.📊 With the overall recovery trend still holding, traders should watch for a break-retest setup or a bullish confirmation in the demand zone.🧠 Smart Play: Patience is key. Let the price come to your level and watch for confluence.What do you think? Is XRP ready to reverse for good?
cryptosoracle
Short Position TON/USDT

🔻 TON/USDT – Key Rejection at Supply ZoneThe price just tapped into the Possible Short Zone (3.226–3.348) and is showing early signs of rejection.📉 Short Bias ActivatedThis zone aligns with a prior breakdown level + unfilled imbalance, making it a prime area for institutional sell interest.🔹 Entry Area: 3.225 – 3.348🔹 Target: 2.770 (⚠️ Major demand zone)🔹 Risk Invalidation: Clean break above 3.348🧠 Why it matters:This move is textbook liquidity engineering—pullback into prior supply, where smart money might reload shorts before a potential move toward the 2.77 demand floor.
cryptosoracle
Long Possible Zone TON/USDT

⚡ Toncoin (TON/USDT) – Bullish Reversal in Play? 📈TON just tapped into a high-confluence Long Zone between $2.80 – $2.337, which acted as a powerful demand area during the last consolidation phase in late March. After a sharp drop today, price is now sitting at a key decision level. 🟢🔹 Long Zone: $2.80 – $2.337🔹 Historical Support: Held in late March before a significant run🔹 Target: $4.20📈 If price holds this zone, we could see a strong bullish reversal toward the $4.20 region or above. The descending wedge pattern hints at a textbook accumulation-to-expansion setup—but only with proper confirmation. 🚀🟢 High reward-to-risk setup for swing traders watching for trend shifts.⚠️ Don’t rush in. Look for signs of strength before entering. Are you bullish on TON/USDT? Let’s discuss! 👇
cryptosoracle
Long Position CAKE/USDT
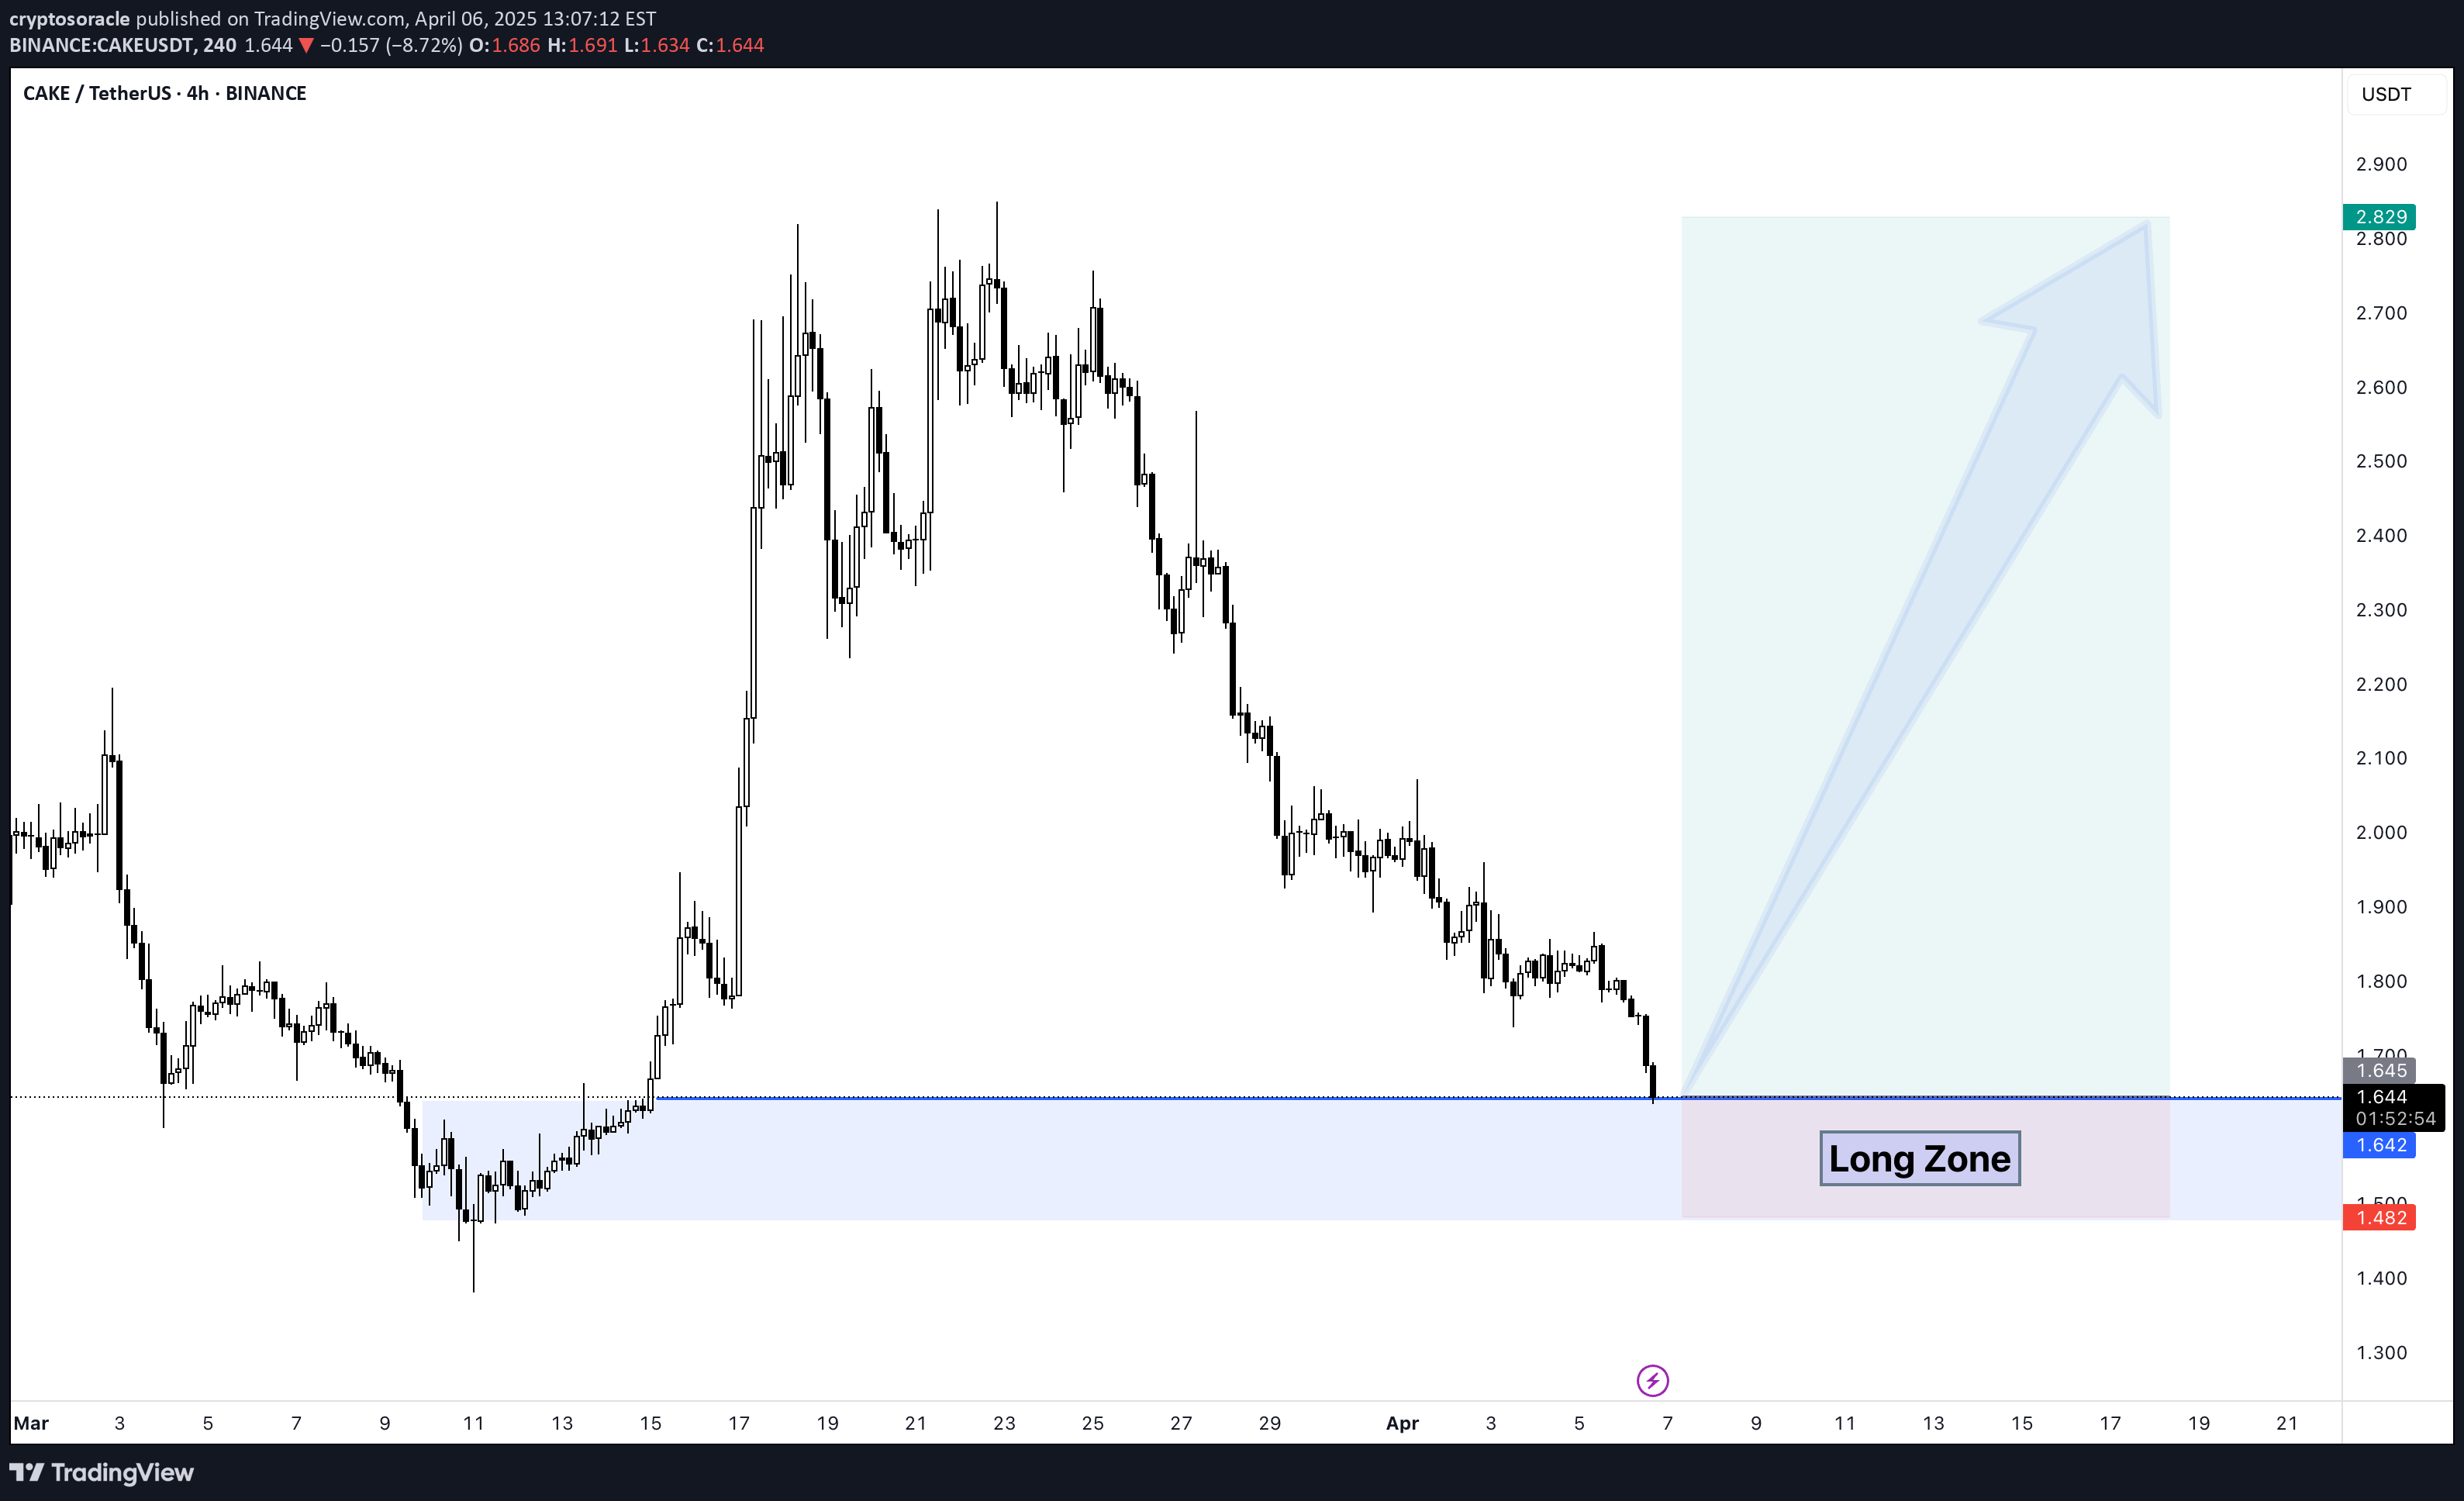
PancakeSwap (CAKE) has entered a critical Long Zone between $1.48 – $1.64, where price historically found strong support before a major Long rally. After a prolonged downtrend, we’re now approaching a potential reversal zone.🔹 Long Entry Zone: $1.48 – $1.64🔹 Potential Upside Target: $2.82+🔹 Rationale: Previous bounce zone + strong demand area🟢 This is a high-reward opportunity for patient bulls waiting for a bottom formation. Watch closely for early signs of strength — if price holds and confirms a reversal, we may see a sharp push to the upside.⚠️ Reminder: No entry without confirmation and risk management.
cryptosoracle
Short Position SOL/USDT

#SingalSOL/USDT🔴 Short Position 🎲 Entry1 @ 123.75🎲 Entry2 @ 125.12✅ Target1@ 121.79✅ Target2 @ 119.93✅ Target3 @ 116.55✅ Target4 @ 112.38✅ Target5 @ 103.78❌ Stop Loss @ 132.32Leverage: 5XMargin: 10% of Wallet Balance⚠️"Take Care of Risk Management for Your Account"
cryptosoracle
Short Position BTC/USDT

Bitcoin is approaching a key Short Zone between $83,443 – $84,616, a region where previous price action has shown clear rejections. This resistance zone is marked in red on the chart. We’re currently hovering just below that at $83,000.🔹 Short Entry Zone: $83,443 - $84,616🔹 Target Profit (TP): $80,233🔹 Risk/Reward Ratio: Solid RRR setup for disciplined traders📌 If price re-tests this zone and fails to break higher, this could be an ideal area for short entries with a clean downside toward the TP zone highlighted in green.⚠️ Always manage your risk. Wait for rejection confirmation signals before entering.
cryptosoracle
Possible Scenario BTCUSDT

Bitcoin remains at a critical level. After breaking out of the descending channel (blue lines), a drop towards $73,700 is likely, which serves as a key support zone for potential long positions.
cryptosoracle
Possible Scenario for AVAX/USDT

Possible Scenario for AVAX/USDT:1. Price Action: The price is within a descending channel marked by the blue lines. This suggests a bearish trend as the price has been making lower highs and lower lows. 2. Potential Scenarios: - The **green arrow** indicates a potential bullish scenario, where the price might break out to the upside, aiming toward a target of around $31.84. - The **red arrow** suggests a bearish scenario, where the price might break down further, potentially testing the lower support level near $11.91.3. Key Levels: - **Resistance**: Around the $31.84 level (shown in red), which could be a strong resistance zone if the price attempts a recovery. - **Support**: Near the $11.91 level (shown in green), which could act as strong support if the downtrend continues.
cryptosoracle
Long Position ATOM/USDT

🚀 ATOM/USDT – Falling Wedge Breakout in ProgressThe price just broke out of a falling wedge for retesting the major support zone (🔵 4.32 to 4.185). This is a classic bullish reversal setup forming at the right spot.📈 Long Bias ActivatedMomentum is building for a potential multi-TP run if the breakout holds.🟢 LONG Position Entry: 4.32 to 4.185✅ Target1@ 4.383✅ Target2 @ 4.456✅ Target3 @ 4.552✅ Target4 @ 4.663🔴 Risk Level: Invalid below 4.185🧠 Why it matters:Wedge formations often lead to explosive breakouts. With the structure forming at demand, this could be a liquidity sweep followed by a rally.POINT: Next Possible 🔴 Short Zone could be around 4.666
Disclaimer
Any content and materials included in Sahmeto's website and official communication channels are a compilation of personal opinions and analyses and are not binding. They do not constitute any recommendation for buying, selling, entering or exiting the stock market and cryptocurrency market. Also, all news and analyses included in the website and channels are merely republished information from official and unofficial domestic and foreign sources, and it is obvious that users of the said content are responsible for following up and ensuring the authenticity and accuracy of the materials. Therefore, while disclaiming responsibility, it is declared that the responsibility for any decision-making, action, and potential profit and loss in the capital market and cryptocurrency market lies with the trader.