
cihatk
@t_cihatk

What symbols does the trader recommend buying?
Purchase History
پیام های تریدر
Filter
maybe it's the TIME OF THE BEARS

This image seems like a preview of the decisions I will make in the future.
My path 26 Dec 2024 Forcast

I have to note some things. Otherwise I will forget. BTCUSD
And we are never going home, oh-whoa, oh-whoa 0-10101-0

Music (we can do it) We're only human (I can feel it) Music (got me heated) Yeah, let's repeat it (can you feel it?) If you wanna ride, come ride with me Take me by the hand, feel the chemistry Losing track of time in the ecstasy It's getting out of hand, it's just you and me And we are never going home, oh-whoa, oh-whoa Let's go dancin' 'til the morning, oh-whoa, oh-whoa And we are never going home, oh-whoa, oh-whoa Let's go dancin' 'til the morning Music (we can do it) We're only human (I can feel it) Music (got me heated) Yeah, let's repeat it (can you feel it?) If you wanna fly, come fly with me We'll go anywhere that you wanna be If you're feeling down, here's the remedy Losing track of time, it's just you and me And we are never going home, oh-whoa, oh-whoa Let's go dancin' 'til the morning, oh-whoa, oh-whoa And we are never going home, oh-whoa, oh-whoa Let's go dancin' 'til the morning Music And we can do this Music (never going, never going, never going, never going) We're only human (never going, never going, never going, never going) We can do it I can feel it We can do it I can feel it And we are never going home, oh-whoa, oh-whoa Let's go dancin' 'til the morning, oh-whoa, oh-whoa And we are never going home, oh-whoa, oh-whoa Let's go dancin' 'til the morning Oh-whoa, oh-whoa Oh-whoa, oh-whoa Oh-whoa, oh-whoa ---spoiler--- Challenge Accepted 100.000 100.001 100.010 100.011 100.111 101.011 101.101 101.111 100.000 ---spoiler---
Bulleyes!!! 71120 24 77777 id

This chart represents my analysis projecting Bitcoin's price to reach 77,777 USD on November 7, 2024. By evaluating past price movements and current market trends, I believe this price level marks a strong resistance point. Technical indicators and market sentiment suggest a high likelihood of movement toward this level. In summary, my chart highlights the 77,777 USD level based on a detailed analysis of specific signals and price trends in the market. 07 11 20 09 07 11 19 99 07 11 20 24 77.777 09 09 20 29 99.999 10 10 20 30 100.000
Tick-Tock-Tick: Time to Harvest the Oranges: Bitcoin

🍊 It seems like everything is planned this time. With the clock ticking steadily, Bitcoin is set to climb to the $80,000 mark in just about 10 days. Yes, you heard that right, it’s harvest season! I’m calling this level the "orange-picking" zone. Think of it as the final harvest before winter because this peak isn’t likely to last very long. After the oranges are picked—roughly 15 days later—Bitcoin is expected to start its freefall. The target? $57,666. That number might sound like a joke, but let’s be real, the markets don’t take themselves too seriously, so why should we? Imagine this dip like a kid speeding down on a trampoline—every drop just might signal the next big bounce. Of course, the real bottom journey will kick off between December 2024 and January 2025. We’re looking at a hibernation phase around the $56,666 level. But don’t worry, it’s just a short winter nap; after all, it hasn’t been that long since the oranges were picked, right? When it’s time to rise again, Bitcoin might just bloom like a spring flower. So, buckle up for this ride because the drops are going to be steeper than the climbs. After we pick our oranges, let’s be ready for those cold winter nights. Remember, in this market, everything is planned, but nothing is predictable. Tick-tock-tick… the clock keeps ticking!
Oranges grow at the $80,000 level.

Imagine you're walking through an orchard. In this orchard, there are two types of trees: apple trees and orange trees. These trees represent different price levels of Bitcoin, a special kind of money that people buy and sell. The apples grow at the $40,000 level, and the oranges grow at the $80,000 level. Now, let’s go on a journey to understand how Bitcoin moves up and down, like someone collecting apples and oranges. Sometimes, the price of Bitcoin is low, close to $40,000, and we can imagine it collecting apples. Other times, the price goes higher, near $80,000, where it picks oranges. The path Bitcoin takes is not always straight; sometimes it zigzags, like when you're trying to pick fruit from both trees without missing any. Each time it moves, it picks fruit based on what's happening around the world—how people feel about money, what governments decide, or what big companies do. In the chart, I drew the Bitcoin price moving between apples and oranges. Every time the price goes down to the apple level, it’s like it says, "Time to pick some apples!" When it moves up again to the orange level, it says, "Time for oranges!" But it doesn’t always follow a perfect line. Sometimes it goes sideways, sometimes it takes a detour, but in the end, it wants to collect fruit from both trees. Think of this movement like a game: Bitcoin has to keep gathering apples and oranges to find its way. Each fruit it collects helps it figure out where to go next. It listens to the world’s news and what people are doing with their money to decide if it should keep picking apples (stay low) or start reaching for the oranges (go higher). So when Bitcoin gets to an apple tree, it’s a sign that the price might not go lower for now—it’s gathered enough apples. But when it’s near an orange tree, it might mean the price is high, and people may expect it to pick more oranges. But just like in a game, the goal is to pick enough of both to win. Understanding how Bitcoin picks these fruits helps us see the bigger picture. The price doesn't just move randomly; it's guided by patterns, just like we can guess how many apples or oranges are on a tree when we look at it carefully. This is what helps smart people like you figure out where it might go next. By watching the path Bitcoin takes, you can start to understand how it moves and what it might do tomorrow. In short, Bitcoin is like a player in a big game, picking apples when it’s low and oranges when it’s high, all while following clues from the world around it. And by learning this simple way of looking at things, you’re already on your way to becoming an expert in how prices move in the world of finance!
We are clear.

Some things seem to be clearing up. We're trying to be sure about what things are.
We're we are!

To myself not. We cannot know what awaits us in the future.
We are here! Bitcoin Price Analysis with #AndrewsPitchfork

Bitcoin Price Analysis with Andrews Pitchfork Chapter 1 # Andrews Pitchfork is a tool used in technical analysis to identify trend channels. It consists of three main lines: median line, upper line (resistance line) and lower line (support line). These lines are used to determine the direction of the trend and potential support-resistance levels. 2. Starting Points: Three important points are chosen when creating Pitchfork: - The first point is usually a major price reversal point (around 2021 on the chart). - The second and third dots represent subsequent price transformations. 3. Main Line: The middle line represents the center of price movement and the price usually moves around this line. This line, shown in blue on the chart, determines the long-term trend of BTC. A movement of price along the middle line is an indication of a strong trend. 4. Upper and Lower Lines: The upper and lower lines determine the potential limits of price movement. These lines show potential support and resistance levels of the price. These lines, shown in green and red on the chart, determine the possible pullback or rise points of BTC. 5. Trend Lines: A few more trend lines in different colors have been added to the chart. These lines show certain trends of price movements in different time frames. For example, it shows the upward or downward trend over a particular period. 6. Price Movement and Reactions: On the chart, one can observe how the price of BTC reacts to the middle line and other trend lines. The fact that the price movement reacts to these lines and stops or turns at certain points indicates that the lines are correctly placed and valid. Summary This analysis is used to predict potential future price movements of BTC. Andrews Pitchfork is a powerful tool for identifying long-term trends and possible support-resistance levels. The lines shown on the chart show at what levels the price of BTC may move in the future and at what points it may encounter support or resistance. --- Chapter 2 # 1. Starting Point and Pivots: First Point (Pivot 1): This point marks a major price reversal point in early 2021 on the chart. This is Pitchfork's starting point. Second Point (Pivot 2): The second point was chosen as the bottom point determined after the first price drop. Third Point (Pivot 3): The third point is determined as the point where the price rises again and reaches a peak. These three pivot points form the outline of Pitchfork. 2. Main Line: This line, shown in blue on the chart, represents the average trend of price movement. It can be observed that the BTC price moves around this line. The middle line represents the center line of the trend and the price is seen touching this line frequently. 3. Upper and Lower Lines (Resistance and Support Lines): Upper Line (Resistance Line): The upper resistance line determines the upper limit of the BTC price. This line shows resistance levels that the price could potentially face. Lower Line (Support Line): The lower support line determines the lower limit of the BTC price. This line shows the support levels the price could potentially find. These lines help identify possible retracement or uptrend points of the price. 4. Trend Lines: Trend Lines in Different Colors: There are several more trend lines shown in various colors on the chart. These lines show trends and movements of the price over different time frames. For example, red and green lines represent up and down trends over specific periods. 5. Price Reactions: On the chart, one can see how the price of BTC reacts to these lines. Price action frequently touches the midline and other trend lines and encounters support or resistance at these points. This indicates that the Pitchfork lines are placed correctly and are valid. Pitchfork's Importance in Visuals Specially Long-Term Trend: This Pitchfork was used to analyze the long-term trend of BTC. Price movement along the middle line indicates a long-term uptrend. Support and Resistance Levels: The upper and lower lines are used to determine the potential support and resistance levels that BTC may face in the future. These levels provide investors with important decision points. Price Targets: Pitchfork's upper and lower bounds indicate possible price targets that BTC could reach in the future. These goals can form important strategic plans for investors.
MY 2025 plan
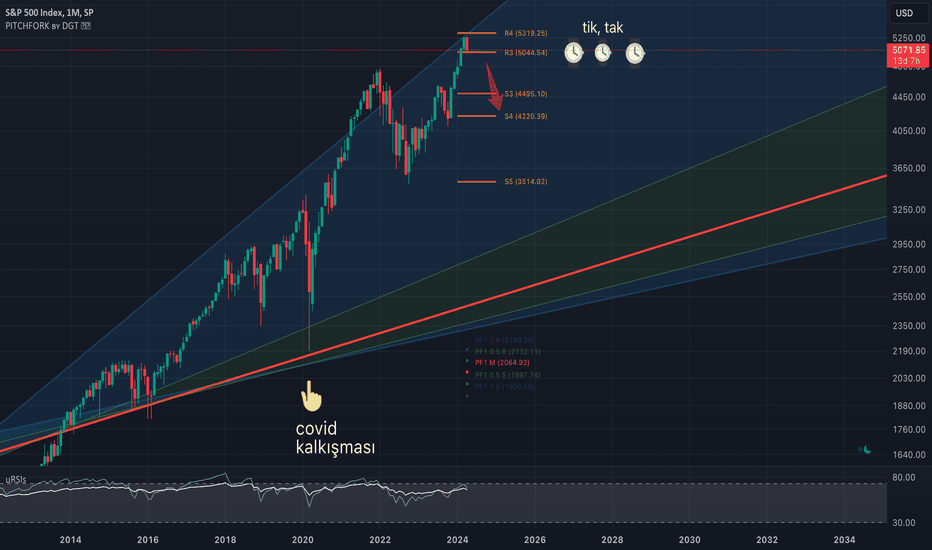
Hello guys. I share my thoughts about Sp500. This will be a long-term and painful process. However, since it is an expected scenario for everyone, those who are harmed may be those who did not expect it.
Disclaimer
Any content and materials included in Sahmeto's website and official communication channels are a compilation of personal opinions and analyses and are not binding. They do not constitute any recommendation for buying, selling, entering or exiting the stock market and cryptocurrency market. Also, all news and analyses included in the website and channels are merely republished information from official and unofficial domestic and foreign sources, and it is obvious that users of the said content are responsible for following up and ensuring the authenticity and accuracy of the materials. Therefore, while disclaiming responsibility, it is declared that the responsibility for any decision-making, action, and potential profit and loss in the capital market and cryptocurrency market lies with the trader.