
burakkesmeci
@t_burakkesmeci

What symbols does the trader recommend buying?
Purchase History
پیام های تریدر
Filter
burakkesmeci
The Real Signal Isn’t BTCUSD — It’s the Bitcoin/Gold Ratio!
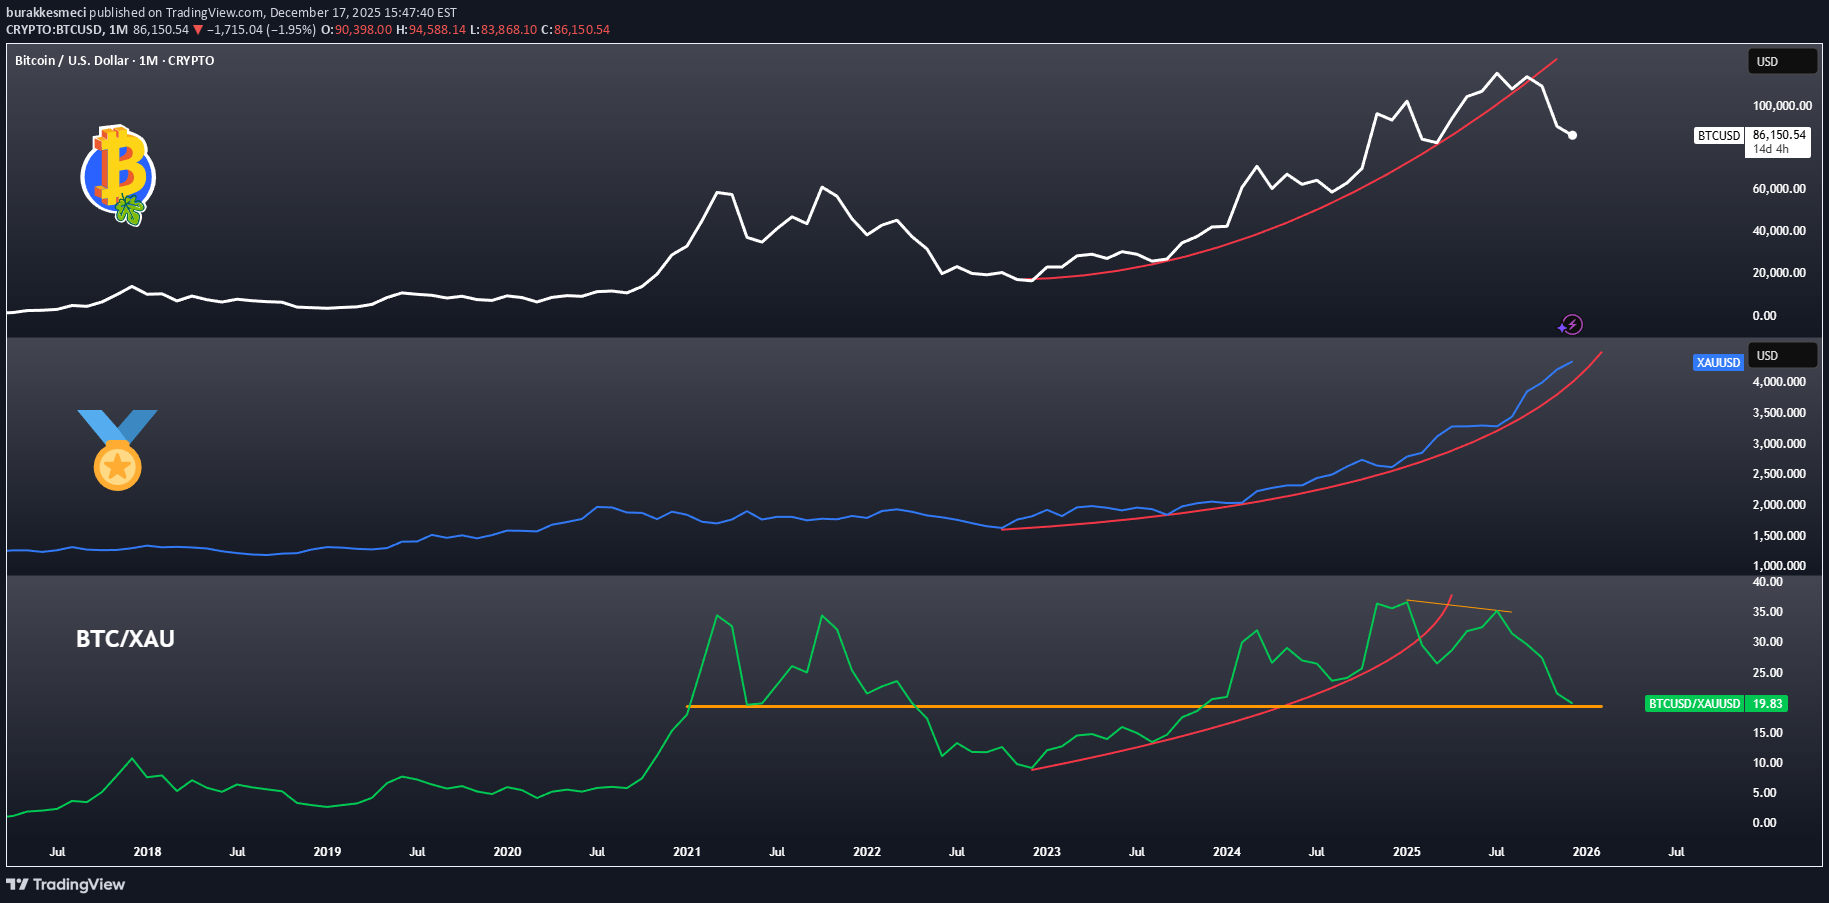
When we read BTCUSD, XAUUSD, and the BTC/Gold ratio together on a monthly logarithmic chart, the real story is told not by price, but by the ratio. Even if Bitcoin looks strong in USD terms, rallies tend to slow down whenever Bitcoin loses strength against gold. So why does this happen? Let’s break it down with 3 key points. • 19.43 stands out as a critical threshold for the BTC/Gold ratio (orange). During the 2020–2021 bull market, this level marked a local bottom, after which Bitcoin launched its second parabolic move and rallied up to $69K. • After the 2021 peak, the ratio moved against Bitcoin and stayed below the critical 19.43 level for nearly two years, during which Bitcoin experienced a severe bear market. From November 2022 onward, the ratio strengthened again in Bitcoin’s favor, leading to a rally that carried BTC as high as $124K. • However, starting in July 2025, the BTC/XAU ratio failed to break above its previous peak and began forming lower highs. This signaled a shift in favor of gold. As the ratio declined, the preference for safe-haven assets became more dominant and clearly showed that Bitcoin is still not perceived by investors as a short-term risk-off asset. In periods of uncertainty, capital once again preferred flowing into gold rather than into risky assets like Bitcoin. Conclusion If the BTC/Gold ratio can hold above 19.43, Bitcoin may enter a new phase of relative strength against gold. Otherwise, gold’s leadership is likely to continue, implying a period where Bitcoin may rise in USD terms but remain relatively weak. The real question is this: Will Bitcoin make its next parabolic move, or will it remain in gold’s shadow for a while longer?
burakkesmeci
Bitcoin/Altın Rasyosu Gerçek Hikayeyi Anlatıyor!
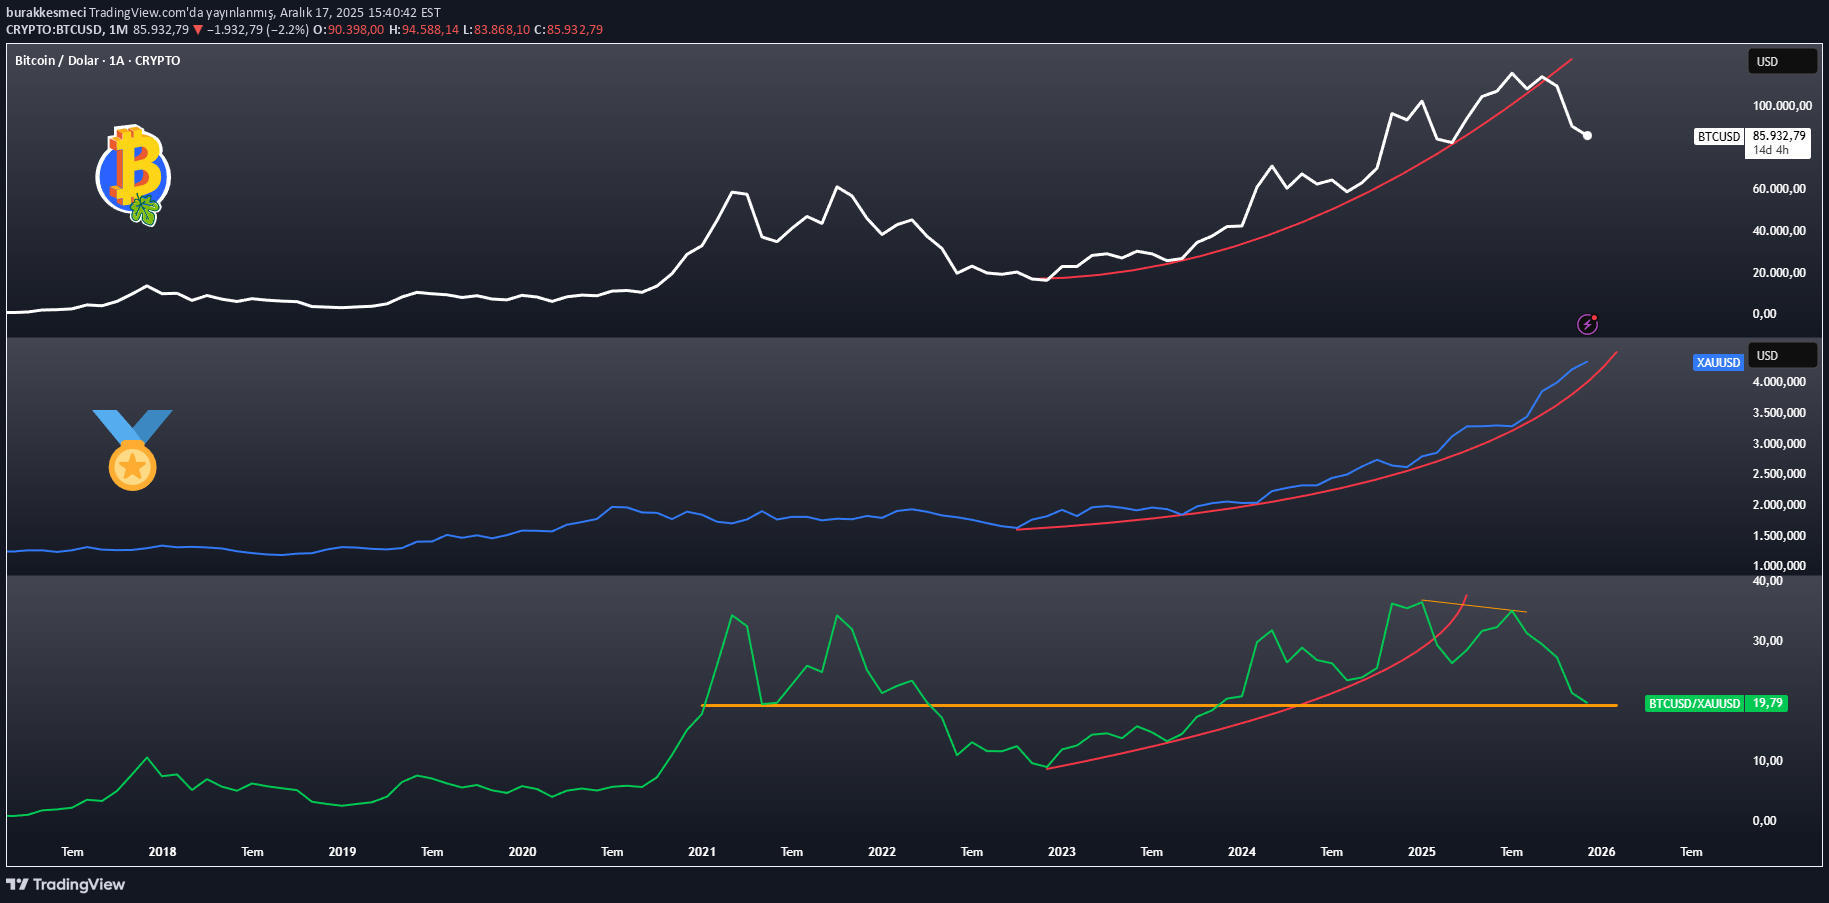
When we read BTCUSD, XAUUSD and BTC/Gold parities together on the monthly logarithmic chart, the ratio tells the real story, not the price. Even if Bitcoin seems strong on a dollar basis, rallies either slow down in periods when it loses its strength against gold. But why? Let's explain this with 3 prominent details. • We see that there is a critical threshold in the BTC/Gold ratio at 19.43 (orange). In the 2020–2021 bull rally, this level was a local bottom and Bitcoin rose to 69K with the second parabolic movement. • After the 2021 peak, the ratio moved against Bitcoin and remained below the critical threshold of 19.43 for about 2 years, and Bitcoin experienced a very serious bear season. Then, starting from November 2022, the ratio strengthened again in favor of Bitcoin and we experienced an increase of up to 124K in Bitcoin. • However, as of July 2025, the BTC/XAU ratio could not exceed its previous peak and started to make descending peaks. This heralded that the ration would move in favor of gold. As the ratio decreases, it has proven that the "safe haven" preference prevails and that Bitcoin, in particular, is still not seen as a risk-off instrument by investors in the short term. In other words, capital again preferred to turn to gold during periods of uncertainty, rather than risky assets (BTC). Conclusion If the BTC/Gold ratio can hold above 19.43, we can move into a phase where Bitcoin regains strength against gold. In the opposite scenario, gold's leadership continues; This indicates a period when Bitcoin remained relatively weak even if it rose in dollar terms. The real question is: Will Bitcoin make the next parabolic move, or will it stay in gold's shadow for a while longer?
burakkesmeci
Why Does Ethereum Need a Weekly Close Above $3,100?
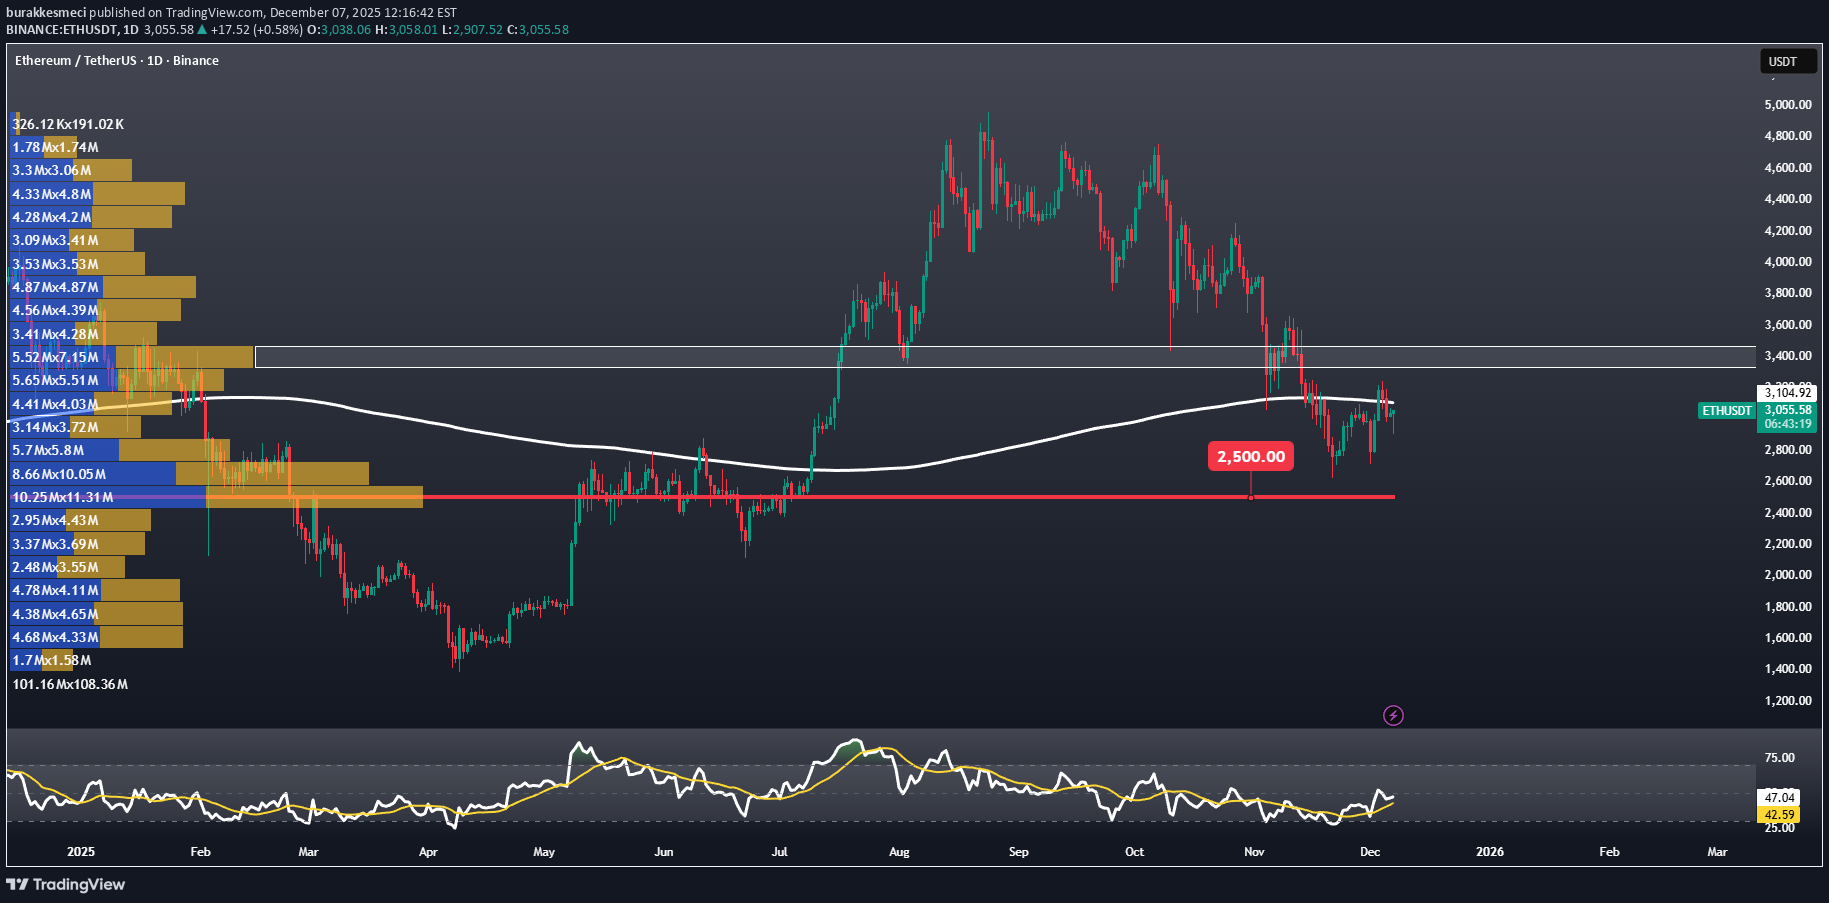
Why Does Ethereum Need a Weekly Close Above $3,100? Ethereum is currently trading around $3,035, while the SMA365 sits near $3,100. A weekly close above this level would give ETH investors some breathing room. If ETH can secure a close above the SMA365, we could expect a relief rally toward $3,689, especially considering the uninterrupted decline since the $4,755 top. On the other hand, the $2,500 zone remains a critical support. Looking at ETH’s recent price action, this level aligns with a high-volume node on the FRVP, making it a key area of interest. Staying above it supports the bullish scenario — but the fact that ETH hasn’t been able to shift this “high-volume settlement zone” upward for months means it also acts like a magnet. The white zone on the chart is a strong candidate for the next YTS (New High-Volume Settlement). For ETH to rebuild positive momentum, it needs to trade and settle between $3,350 – $3,450 for a while. In other words, Ethereum must push this liquidity cluster upward by roughly $850–900 (around 38%) — a classic characteristic of bull markets. In conclusion: purely from a technical perspective, the weekly close at $3,100 is critical. Above it, the path opens toward $3,600 — below it, there is room to revisit $2,500. Thank you for reading. If you found this analysis helpful, please consider sharing 🙏
burakkesmeci
ETH'de 3,100 seviyesi neden önemli?
Why should Ethereum's weekly close be above 3,100? The price of Ethereum is currently 3,035. ETH's SMA365 is roughly 3,100. With future closings above this level, Ethereum investors can breathe a little easier. In the case of Ether, which has been falling breathlessly since the 4,755 level, we can expect a reaction rise up to the 3,689 level, if ETH closes above SMA365. On the other hand, the 2,500 level is still critical. When we watch the last ETH price action, this is the FRVP heavy clearing level. Being above this level supports the positive scenario, but it also acts as a magnet for ETH, which has not been able to move the "heavy exchange level" up for months. Especially the white box is a candidate to become the new YTS, ETH needs to exchange between 3,350 - 3,450 for a while and make this level the new YTS for a positive scenario. It should move this heavy exchange level up by about $850 - $900 (38%), characteristic of a bull rally. As a result, just looking at the technical data, 3,100 will be critical for the weekly close. We have a way to go up to 3,600 for closings above and 2,500 for closings below. Thank you for reading, please share if you think it was useful 🙏
burakkesmeci
سیگنال خرید بیت کوین پس از 250 روز: آیا ترس به پایان رسید؟
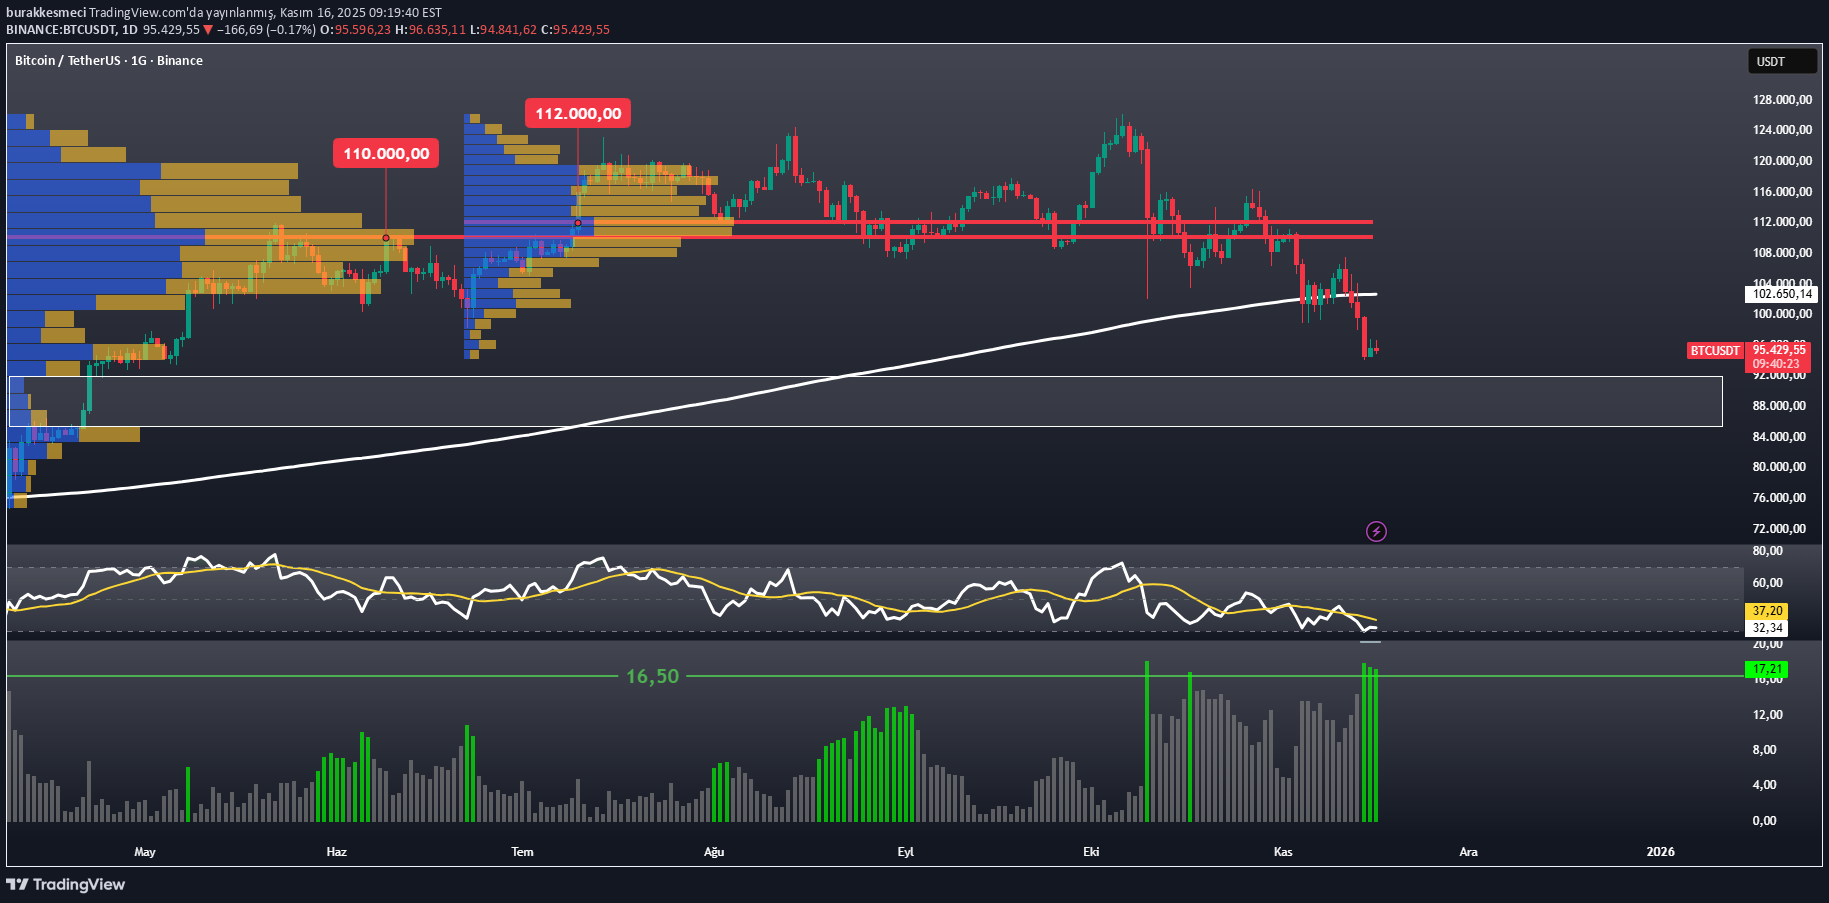
Bitcoin VIX(fear) score produced a repurchase signal after 250 days. This alone does not mean that Bitcoin will return from here. This signal may grow stronger (if the decline continues into oversold territory). But let's see what the technical data says. Reminding that we examine the data on a daily basis, we can state that the RSI received a reaction from exactly the 30 point region. There is no need for excitement, especially without seeing rising bottoms in the RSI (for possible positive divergence). In addition, our VIX metric remained above 16.50 points for 2 consecutive days after 250 days, generating a serious buy signal. However, this alone is not enough. Bitcoin When we examine the FRVP levels, below 95K is a small gap. There is no volume until 85K, it can reach 85K in a single candle if it closes below 95K. BTC who rested a little between 95K - 96K, changed hands, and made volume may get stronger (in the short term). ✅Result We stated in "Starting the Week" that, by many metrics, Bitcoin is in the 95K - 110K area of the playing field. Current data shows market makers prefer 95K. It is possible that BTC, resting here, will make a REACTION rise up to 110K. There will be a decision area of 110K (FRVP YTS). Closings below increase seller pressure (see November 3, 2025). On the other hand, 95K is the most critical level I will follow in the short term, there is a 10K step gap below it. Thanks for reading, please share if you think it was helpful 🙏
burakkesmeci
تک اندیکاتور جادویی: با SMA365 خرس و گاو بیتکوین را تشخیص دهید!
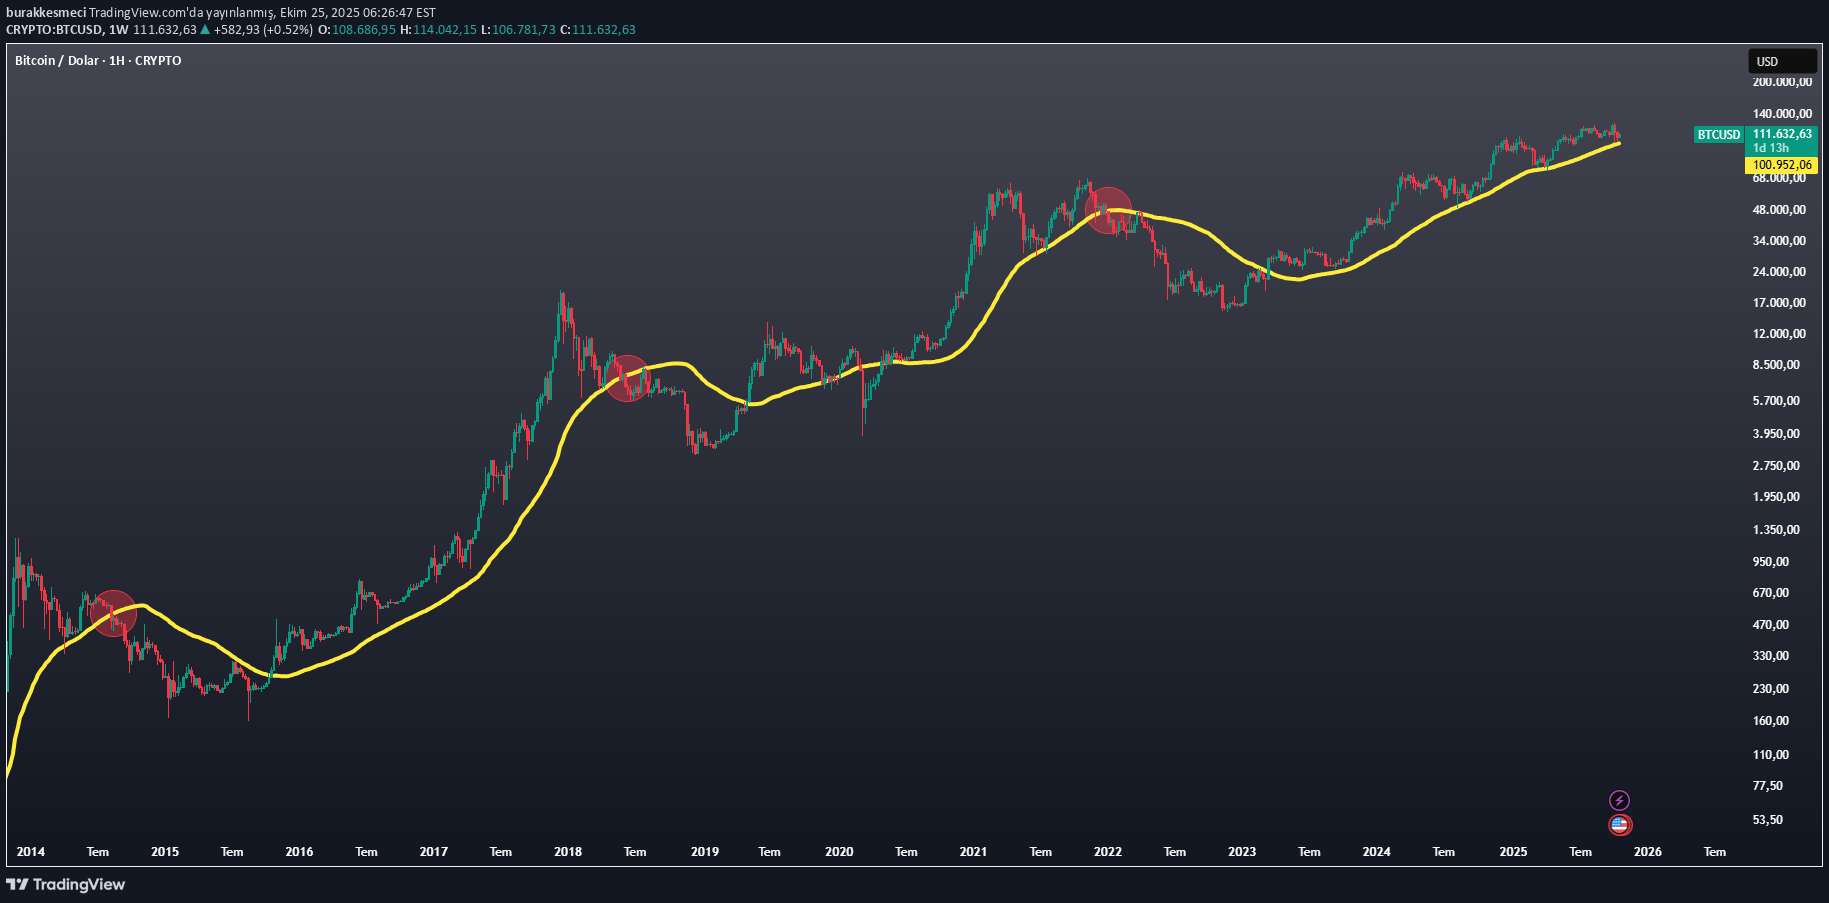
One moving average is enough for you to understand the difference between bear and bull in Bitcoin. There's no need to split hairs. The chart is weekly, but the moving average I use in the chart is SMA365 (daily). In summary, a BEAR will not come without seeing a weekly close under SMA365. Covid, Japan Carry Trade crisis etc. Put crises aside. Turn it on for trend tracking. Follow SMA365, you don't need 40 tools!
burakkesmeci
دو نشانه خطرناک در نمودار بیت کوین: هشدار جدید تحلیلگران!
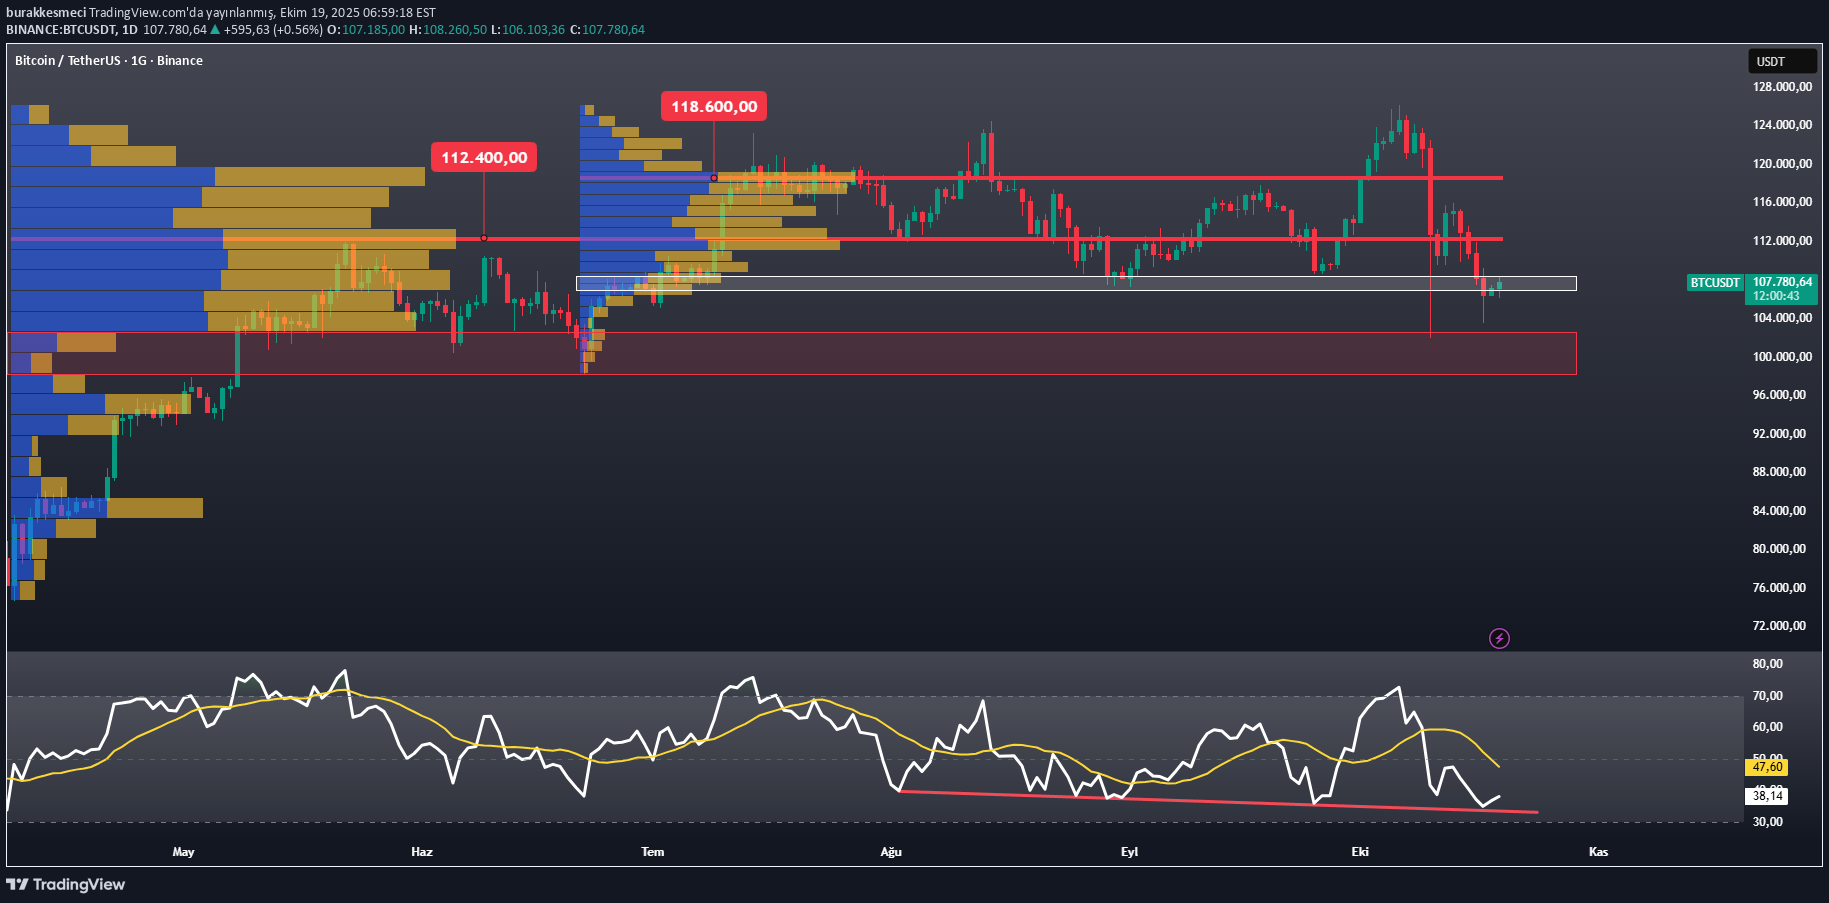
There have been 2 negative developments in the Bitcoin trend that I have been following for months. The first of these is that the FRVP intense clearing level, which I have been following since April 2025 (the last rising trend), has undergone a downward revision. The FRVP intensive exchange level, which is around 118K, is currently 112.4K. It is very critical for it to be below or above this level in the short-medium term. As long as it remains below 112.4K, we can expect seller pressure to increase. Secondly, the RSI (daily period) has been making descending bottoms since August 2, 2025. This situation is unpleasant, there is no sign of trend reversal yet, at least in this period. There is no need to smile until we see rising bottoms in RSI and closes above SMA14. Thanks for reading.
burakkesmeci
Bitcoin Haftalık Trend Analizi
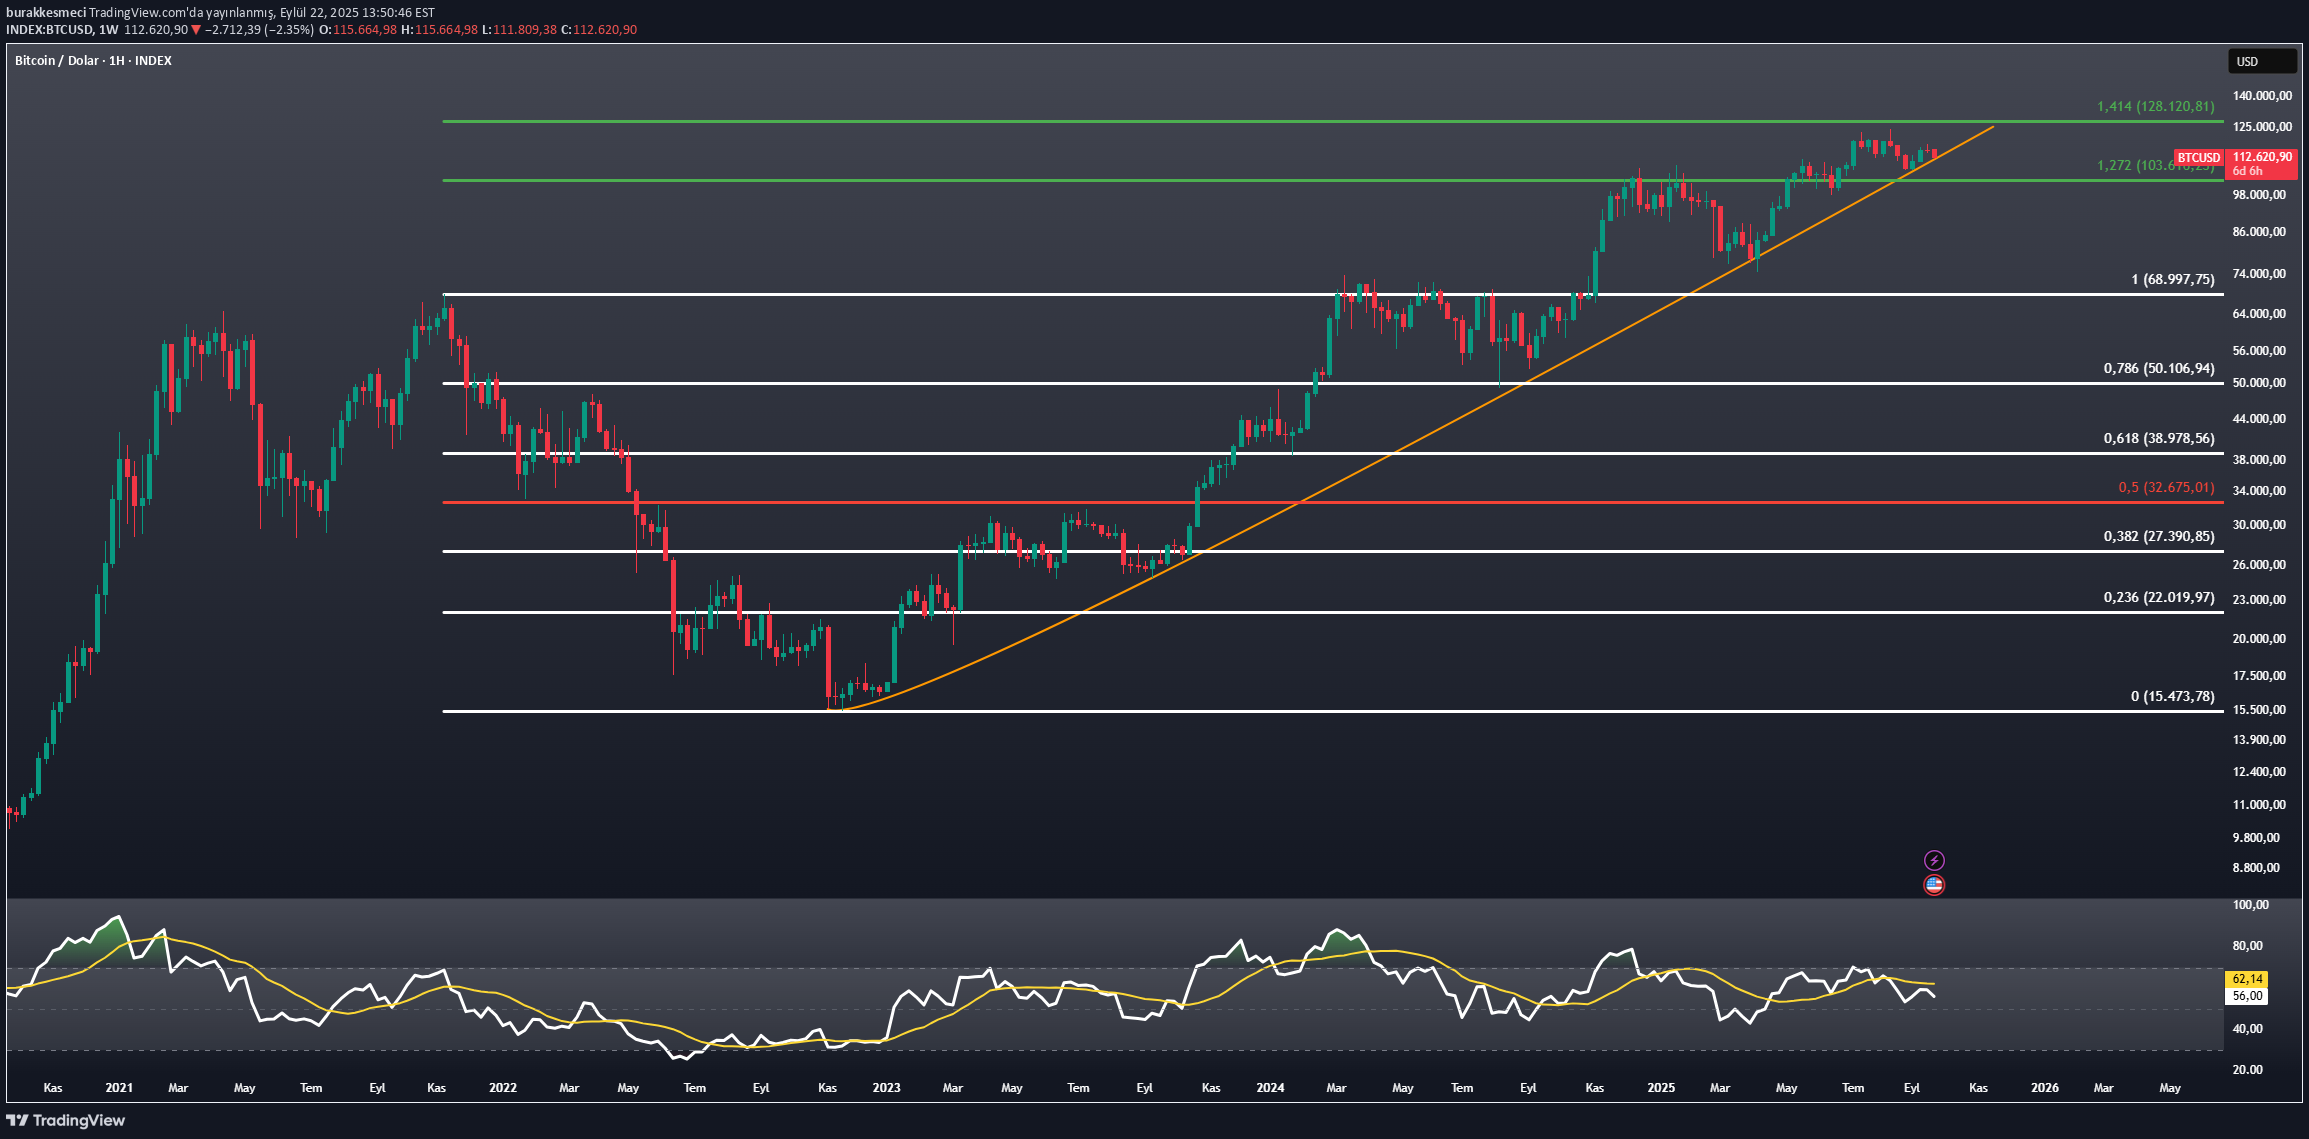
Let's take a look at Bitcoin in a weekly time period. First of all, let me state that the graph is logarithmic. The rising trend, which continues since November 2022, is being re -tested. If you can remain on the rising trend (orange) Bitcoin can test the next Fibonacci level. This level is exactly $ 128,120. On the other hand, there is a loss of momentum in RSI. At the moment, 56.18 points and under SMA14. There may be relaxation up to 50 points (if the rising trend is broken, this risk can be expected to increase). On the other side of the medallion, a movement can be observed by roughly 128k closes up to 170k+. Let's see which one will be, a critical week -old and monthly closing is waiting for us. Thank you for reading.
burakkesmeci
Solana’da 204 USD kritik deste ve 250 USD büyük sınav.
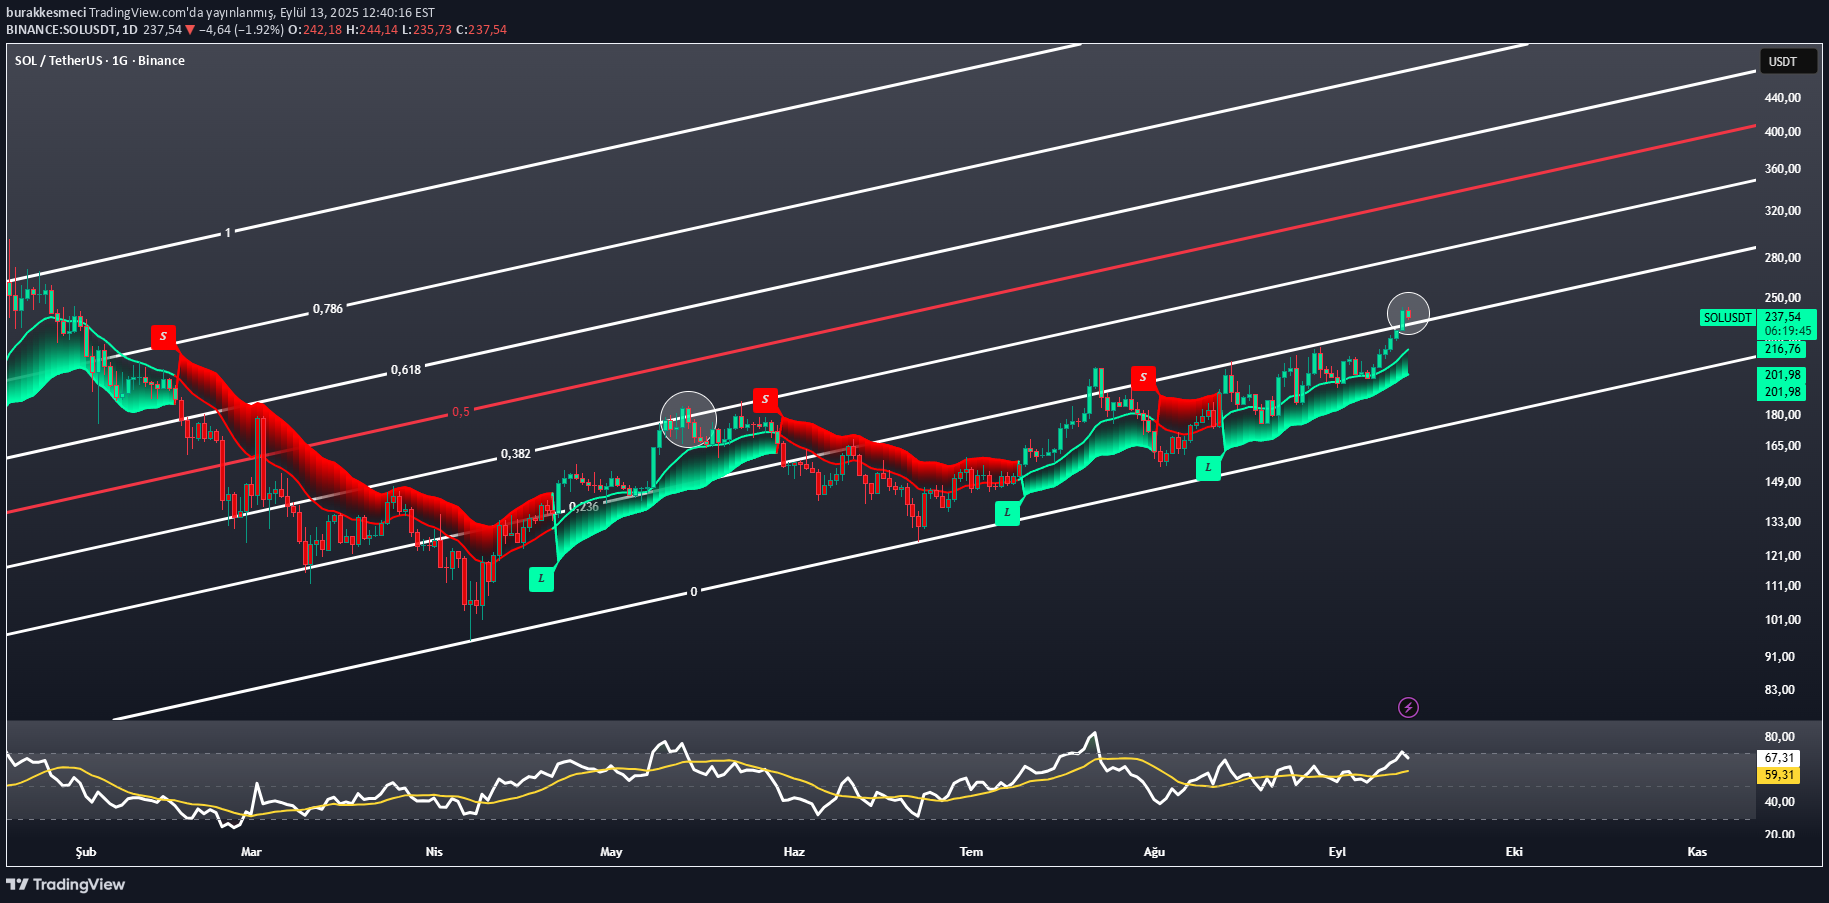
Solana Let's examine the rising channel, adaptive trend Flow and RSI on the chart. According to Adaptive Trend Flow, 204 USD is the most important support level. As long as this level is above this level, the rising trend is preserved. RSI is currently 67 points. This shows that buyers are strong, but there may be a chance to balance in the short term. The prominent point is the 250 USD level. This is an important barrier in both technical and psychological terms. If closing comes up, an area can be opened to the red line (0.5 level) in Fibonacci. This can bring up 350 USD levels in the short-medium term. As a result, the appearance is positive as long as it is over 204 USD. With the closing over 250 USD, a much stronger rise in Solana can be opened.
burakkesmeci
Sadece 3 teknik araçla ONDO teknik analizi: Yükseliş kapıda mı?
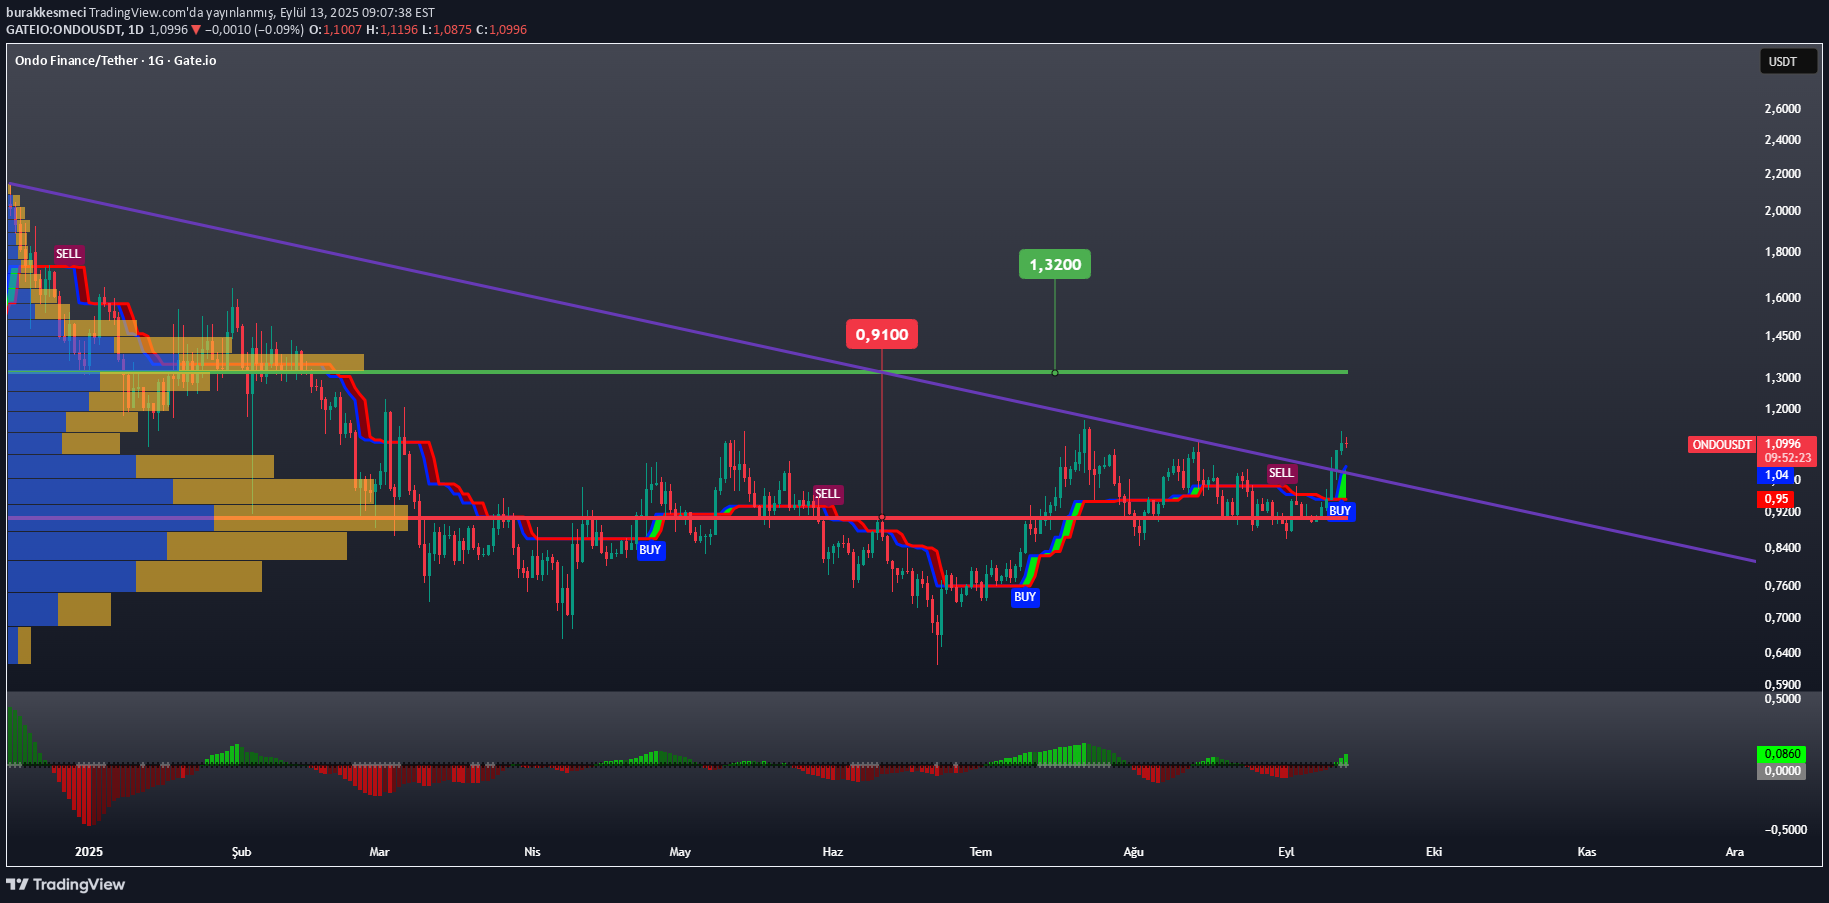
ONDO Technical Analysis with 3 Technical Vehicles: Is the rise at the door? You can find these 3 technical tools in my substack bulletin (fixed connection in my profile). ONDO Momentum continues to gain acceleration (SQZMOM). When we look at ondo with Frvp, we were expected to accelerate the instrument that has been exchanged above the intensive swap level for about 40 days. The next resistance level (woe level) is 1.32. Above this level is festive. In addition, Alpha The trend produced the Al signal after 66 days in the daily period (it is only a matter of time before it produces in the week). In addition to all these data, ONDO has broken the resistance of the falling trend that has been going on since December 2024, positive data. Stating that there is no investment advice, let me add that my own cost is 0.35. Advertising (legal obligation). Thank you for reading.
Disclaimer
Any content and materials included in Sahmeto's website and official communication channels are a compilation of personal opinions and analyses and are not binding. They do not constitute any recommendation for buying, selling, entering or exiting the stock market and cryptocurrency market. Also, all news and analyses included in the website and channels are merely republished information from official and unofficial domestic and foreign sources, and it is obvious that users of the said content are responsible for following up and ensuring the authenticity and accuracy of the materials. Therefore, while disclaiming responsibility, it is declared that the responsibility for any decision-making, action, and potential profit and loss in the capital market and cryptocurrency market lies with the trader.