Technical analysis by burakkesmeci about Symbol BTC on 12/17/2025

burakkesmeci
Bitcoin/Altın Rasyosu Gerçek Hikayeyi Anlatıyor!
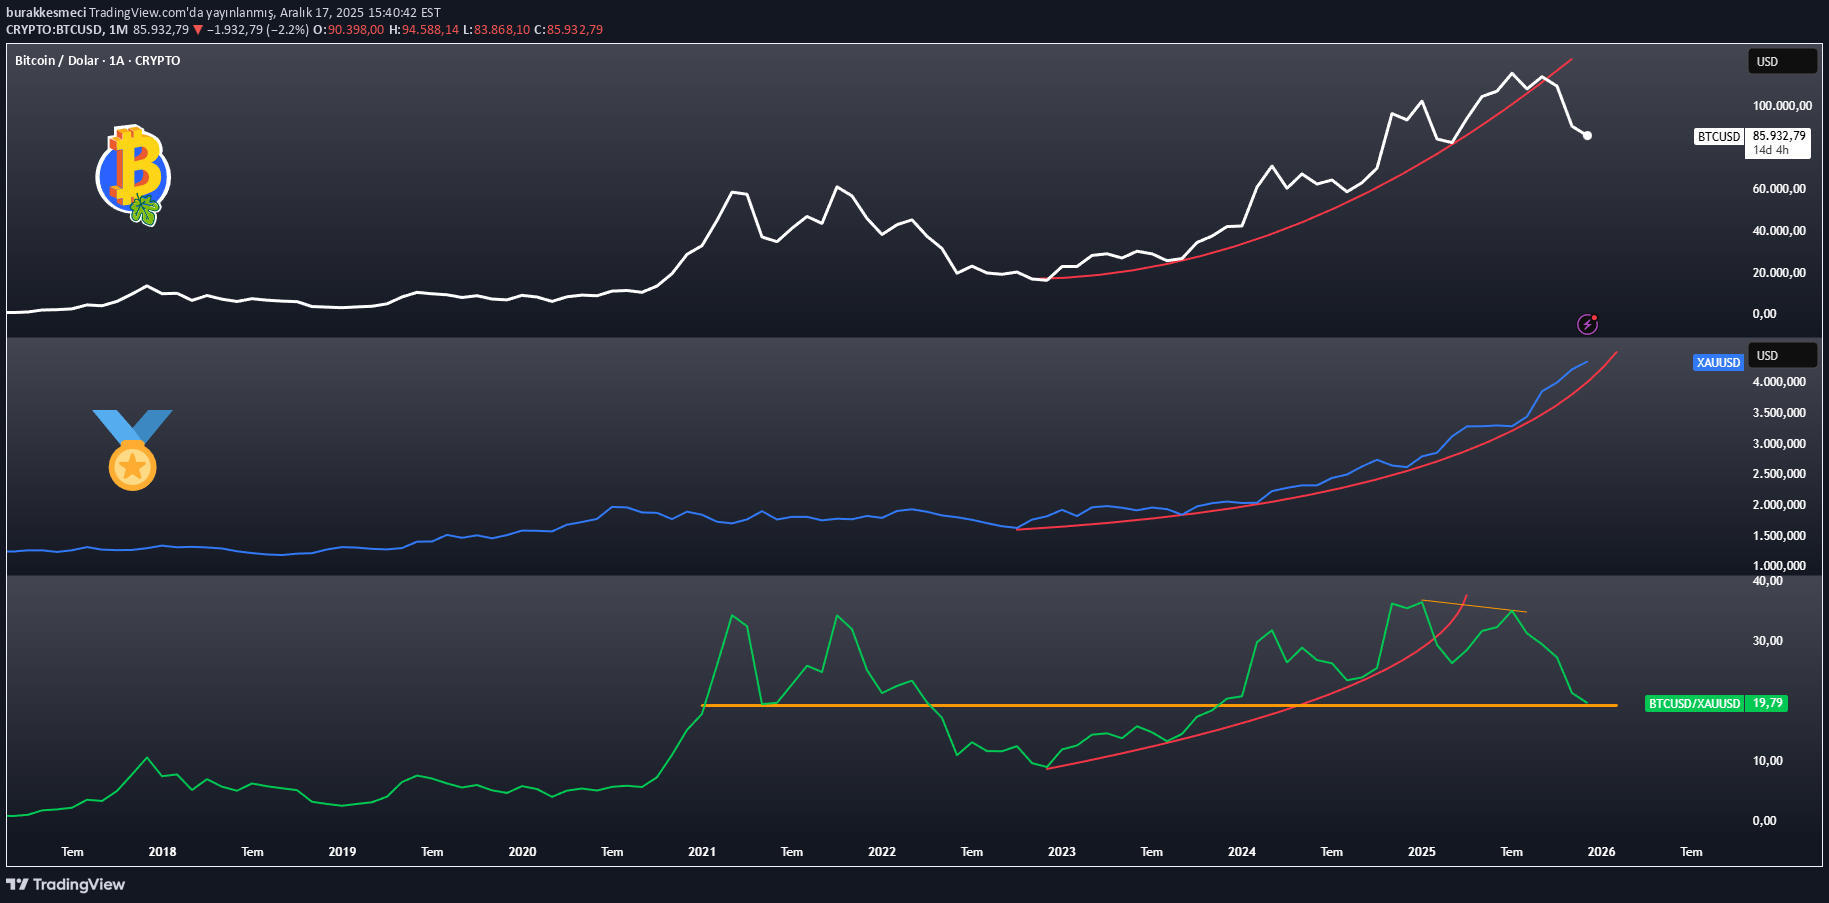
When we read BTCUSD, XAUUSD and BTC/Gold parities together on the monthly logarithmic chart, the ratio tells the real story, not the price. Even if Bitcoin seems strong on a dollar basis, rallies either slow down in periods when it loses its strength against gold. But why? Let's explain this with 3 prominent details. • We see that there is a critical threshold in the BTC/Gold ratio at 19.43 (orange). In the 2020–2021 bull rally, this level was a local bottom and Bitcoin rose to 69K with the second parabolic movement. • After the 2021 peak, the ratio moved against Bitcoin and remained below the critical threshold of 19.43 for about 2 years, and Bitcoin experienced a very serious bear season. Then, starting from November 2022, the ratio strengthened again in favor of Bitcoin and we experienced an increase of up to 124K in Bitcoin. • However, as of July 2025, the BTC/XAU ratio could not exceed its previous peak and started to make descending peaks. This heralded that the ration would move in favor of gold. As the ratio decreases, it has proven that the "safe haven" preference prevails and that Bitcoin, in particular, is still not seen as a risk-off instrument by investors in the short term. In other words, capital again preferred to turn to gold during periods of uncertainty, rather than risky assets (BTC). Conclusion If the BTC/Gold ratio can hold above 19.43, we can move into a phase where Bitcoin regains strength against gold. In the opposite scenario, gold's leadership continues; This indicates a period when Bitcoin remained relatively weak even if it rose in dollar terms. The real question is: Will Bitcoin make the next parabolic move, or will it stay in gold's shadow for a while longer?