
biodunoladokun
@t_biodunoladokun

What symbols does the trader recommend buying?
Purchase History
پیام های تریدر
Filter
PI – Bearish Pressure Mounting as A/D Line Collapses

PI’s daily chart paints a bearish picture, with technical indicators showing no signs of a recovery. A standout signal is the Accumulation/Distribution (A/D) line, which has been on a sharp downtrend since June 26. This steep decline in the A/D line signals that sellers have been dominating the market, outweighing any attempts at accumulation. With demand visibly weakening, PI faces growing downside risk through August unless bullish momentum reemerges.
VINE - Bullish Momentum Accelerates on Buy-Side Pressure

VINE, a meme coin inspired by the defunct Vine video platform, has surged by 267% in the past week. Technical indicators reinforce the bullish outlook. The Elder-Ray Index, which gauges buying and selling pressure, has printed five consecutive green histogram bars—each larger than the last. This pattern points to growing dominance by buyers in the spot market. With bullish momentum strengthening daily, VINE may have more upside potential if current demand levels persist.
XRP – Bearish Signals from Elder-Ray Index

XRP’s bullish momentum appears to be fading, according to recent readings from the Elder-Ray Index on the daily chart. Over the past two sessions, the indicator has printed consecutive red bars, reflecting a clear shift in sentiment as buying pressure weakens. The Elder-Ray Index evaluates the strength of bulls versus bears by measuring the difference between an asset’s price and its exponential moving average (EMA). A negative reading, like the one currently seen on XRP, means the asset is trading below its EMA — a sign that bearish pressure is outweighing bullish momentum. Traders may want to monitor closely for further downside confirmation.
ETH/USD: Smart Money Index Signals Distribution Post-Rally

On the ETH/USD daily chart, a notable drop in the Smart Money Index (SMI) is confirming bearish sentiment among key market players. Since July 20, the SMI has declined by 7%, signaling increased selling activity from institutional investors and seasoned traders—often referred to as "smart money." The SMI works by contrasting intraday trading behavior: it gauges retail-driven morning trades against institutional-dominated afternoon moves. A falling SMI, like the one seen on Ethereum, suggests that smart money is quietly exiting positions. In this case, it points to profit-taking after ETH’s recent price rally, reinforcing the idea that the current pullback may be more than just noise. Traders should monitor further declines in the SMI as a sign of continued distribution.
BTC Range-Bound Movement With Key Levels in Sight

Bitcoin has largely traded sideways on the daily chart since reaching its all-time high of $122,054 on July 14. The current range is defined by a resistance level around $120,000 and a support floor around $116,000 With demand gradually weakening, BTC risks a breakdown below the current support. A close below $116,000 could open the path toward $114,000, marking a deeper short-term correction. On the upside, renewed buying pressure could push BTC above the $120,000 resistance. A successful breakout may set the stage for another retest of the all-time high and potentially new highs if momentum follows through.
HBAR BoP Turns Negative, Signaling Bearish Momentum Shift

HBAR's Balance of Power (BoP) indicator has recently flipped negative, currently reading -0.87. This suggests a shift in market sentiment, with selling pressure outweighing buying interest. The BoP is a momentum indicator that gauges the strength between buyers and sellers, and a negative value like this typically signals that bears are in control. This bearish turn in the BoP reflects a waning demand for HBAR and could indicate further downside risk unless buying momentum returns. Traders may want to remain cautious in the short term as this shift could mark the beginning of a broader correction or continued weakness.
SOL Traders Begin Taking Profits Despite Bullish Rally

Solana (SOL) continues to climb, but under the surface, signs of selling pressure are starting to emerge. While price action has been bullish and on-chain activity remains strong, the BBTrend indicator is flashing red — literally. For the past three days, its histogram bars have turned red and gradually increased in size, signaling a rise in mild but persistent selling activity. The BBTrend, which gauges trend strength using Bollinger Band behavior, shows that SOL is consistently closing near the lower band. This pattern suggests that despite the upward momentum, some traders are quietly taking profits — possibly positioning for a near-term pullback. The rally remains intact for now, but the growing divergence between price and BBTrend behavior hints at early signs of weakening confidence.
DOGE – Strong Uptrend Confirmed by Aroon Indicator

DOGE is flashing a powerful bullish signal, with its Aroon Up indicator reading a perfect 100%. The Aroon indicator helps identify the strength and direction of a trend by tracking how recently price has made new highs or lows. A 100% Aroon Up reading means that the most recent highs are happening consistently within each period of the indicator’s lookback window. Currently, DOGE is trading at price levels last seen in February, and the persistent new highs confirm a strong and steady uptrend. This setup suggests bullish momentum is not only intact but accelerating, as DOGE continues to push into higher territory with each candle. Ask ChatGPT
PI | Bullish MACD Crossover Signals Rebound Attempt
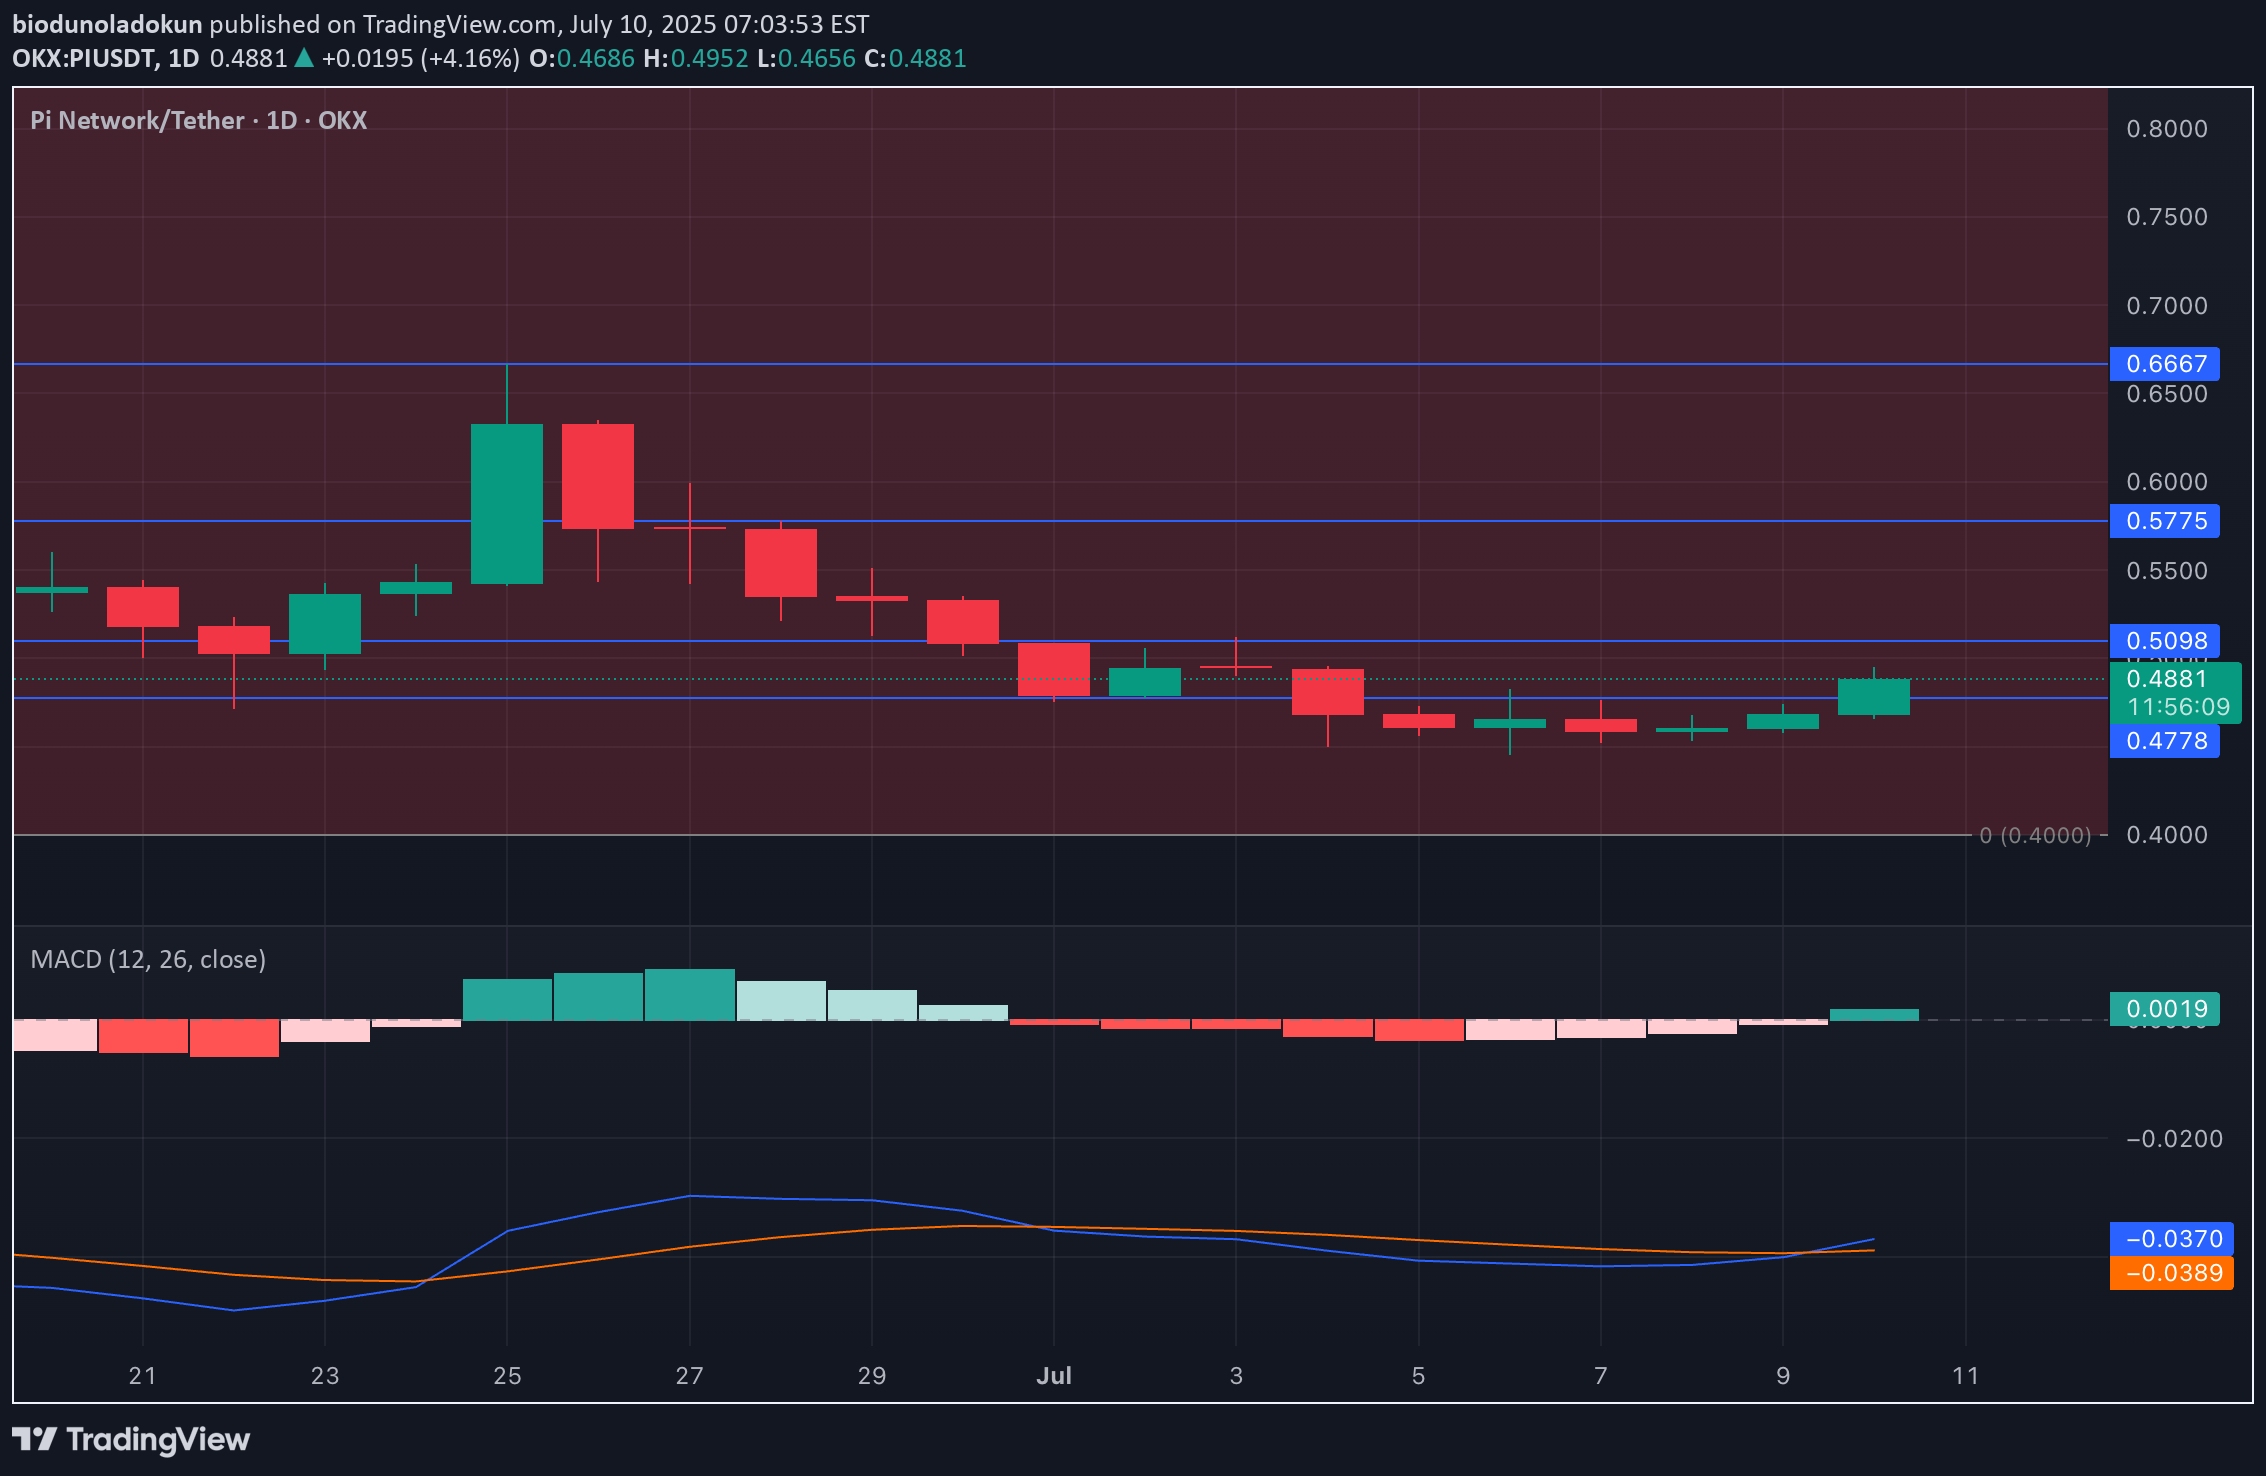
PI has seen a 2% price uptick, triggering a bullish crossover on the MACD indicator—the first since July 1. This technical setup occurs when the MACD line crosses above the signal line, often viewed as a shift toward bullish momentum. It suggests increasing buying interest as bears begin to lose control.Though both MACD and signal lines are still below zero—a sign of the meme coin’s prolonged downtrend—the crossover indicates a possible change in sentiment. For traders, this move is often interpreted as a buy signal, hinting at a short-term price rebound if bullish momentum continues to build.
Nervos Network (CKB) – Bullish Momentum Building
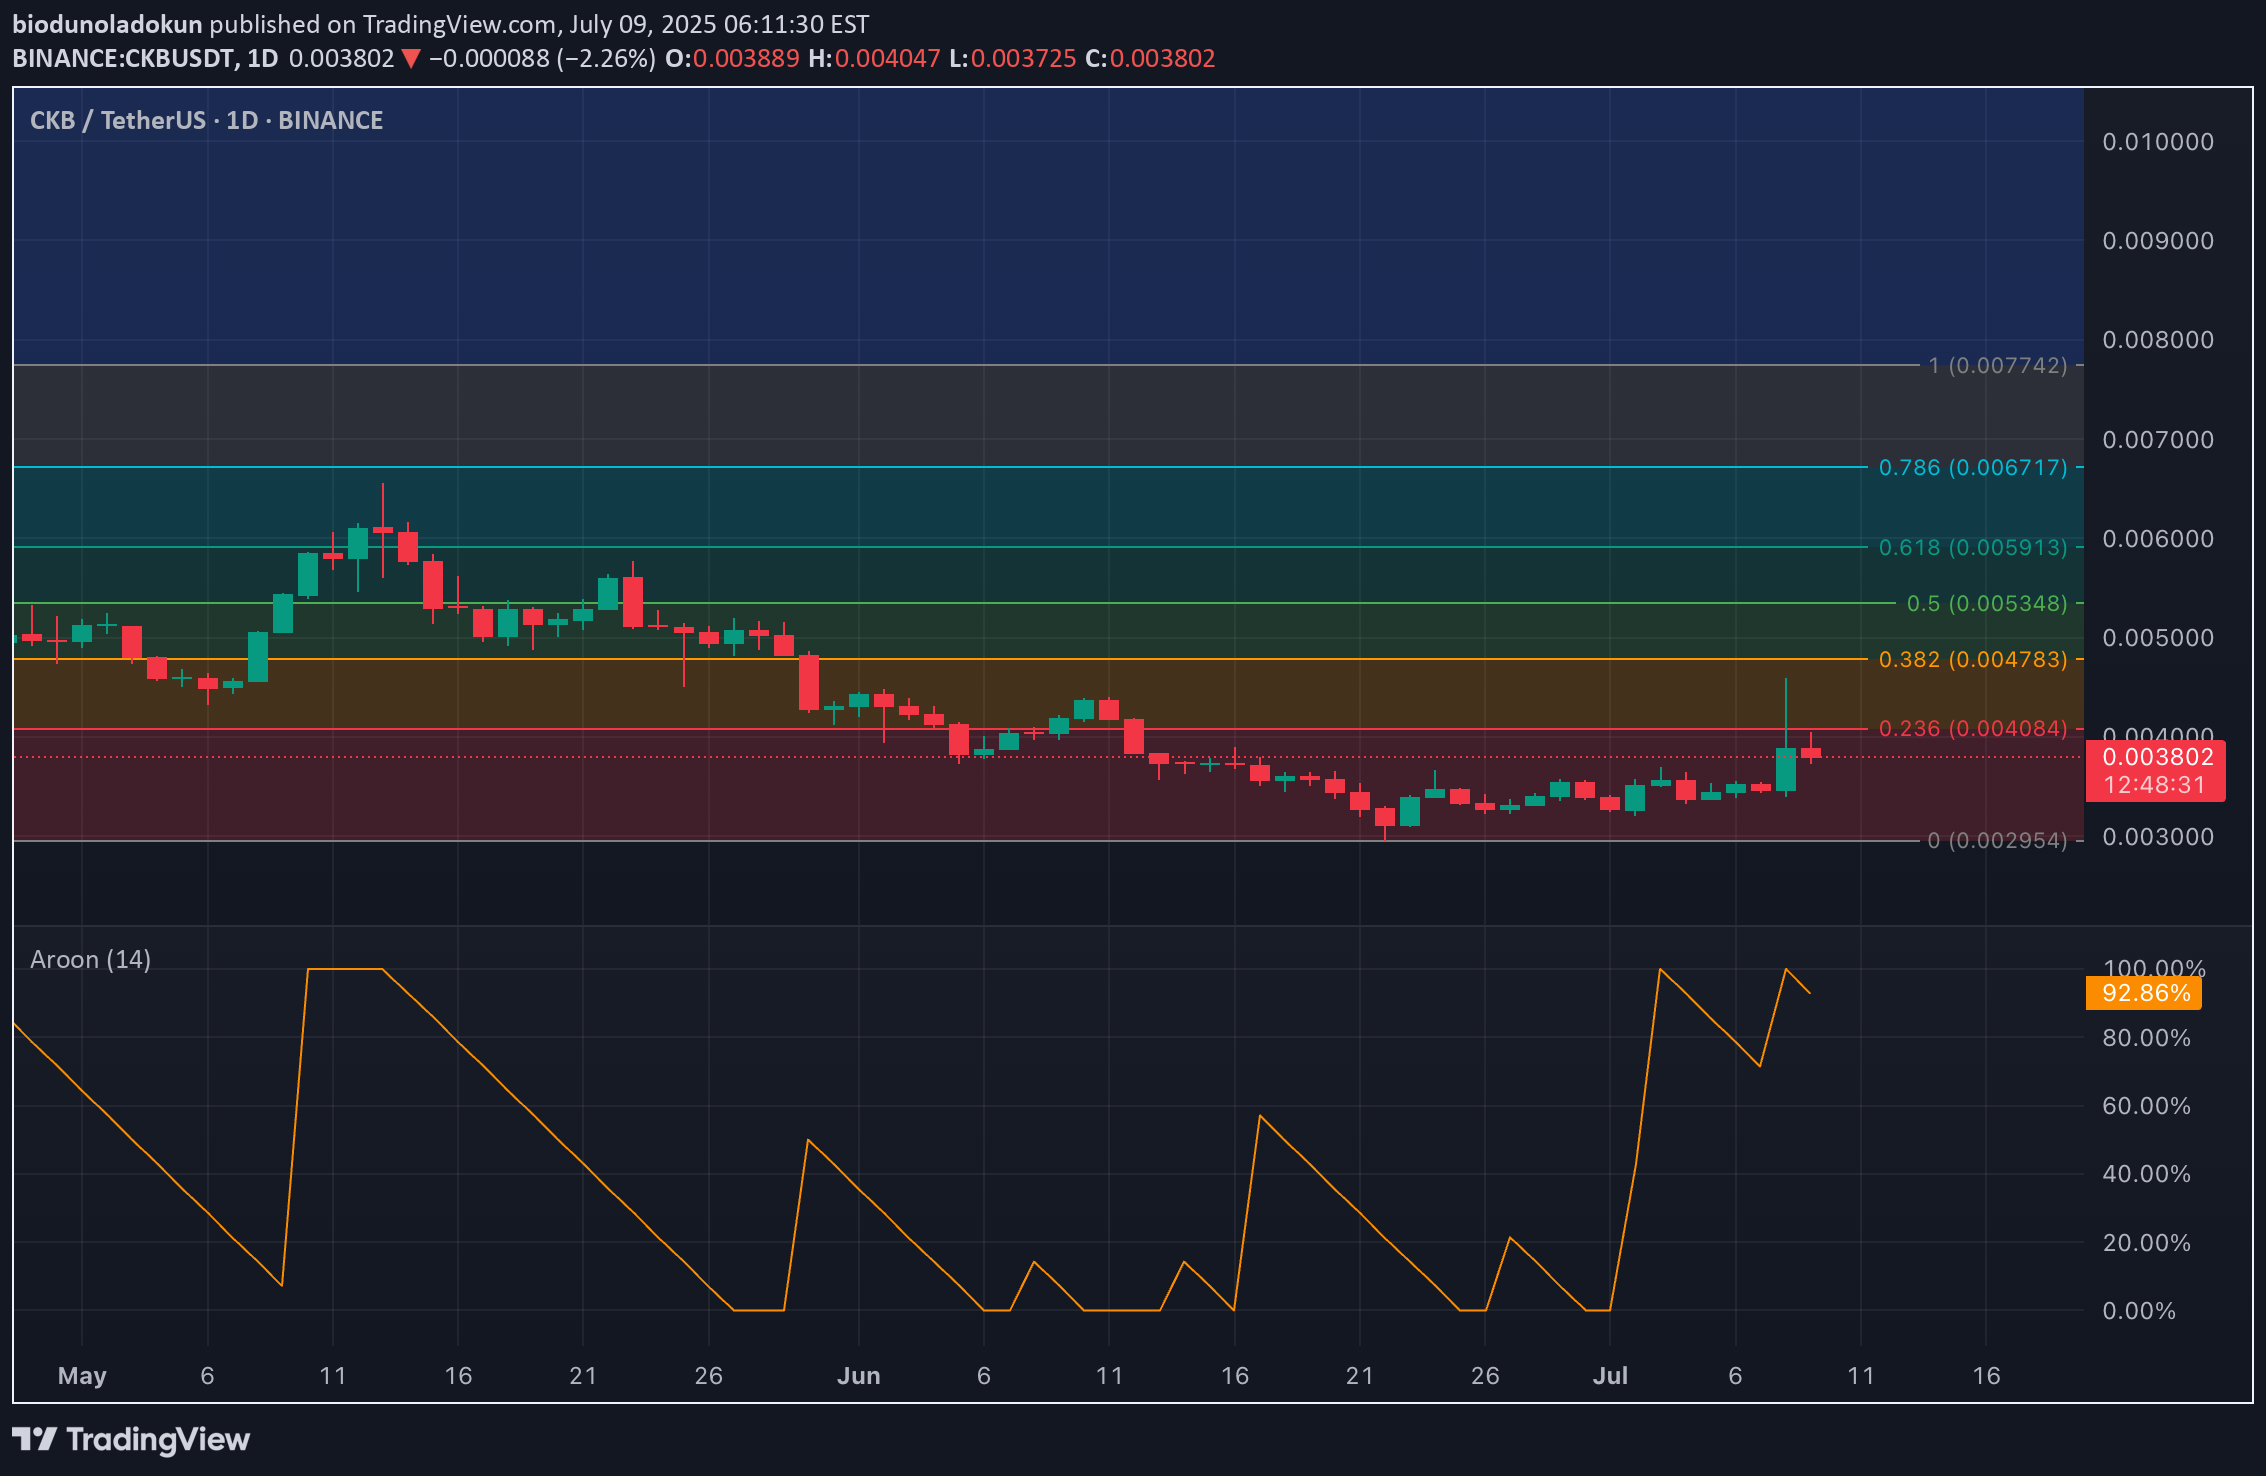
CKB, the native token of the Nervos Network, has gained over 13% in the past week. The recent price action has sparked interest across the crypto community, as technical indicators signal a strong and sustainable uptrend.The Aroon Up Line on the daily chart currently sits at an impressive 92.86%, reflecting strong bullish momentum. For context, the Aroon Indicator helps assess the strength and direction of a trend, with values near 100% typically indicating that a recent high was reached and buyers are in control. In CKB’s case, this suggests that its upward move is being driven by consistent demand rather than short-term speculation.Ask ChatGPT
Disclaimer
Any content and materials included in Sahmeto's website and official communication channels are a compilation of personal opinions and analyses and are not binding. They do not constitute any recommendation for buying, selling, entering or exiting the stock market and cryptocurrency market. Also, all news and analyses included in the website and channels are merely republished information from official and unofficial domestic and foreign sources, and it is obvious that users of the said content are responsible for following up and ensuring the authenticity and accuracy of the materials. Therefore, while disclaiming responsibility, it is declared that the responsibility for any decision-making, action, and potential profit and loss in the capital market and cryptocurrency market lies with the trader.