
bacurrie45
@t_bacurrie45

What symbols does the trader recommend buying?
Purchase History
پیام های تریدر
Filter
bacurrie45
BONK MORE JUICE LEFT IN THE TANK!
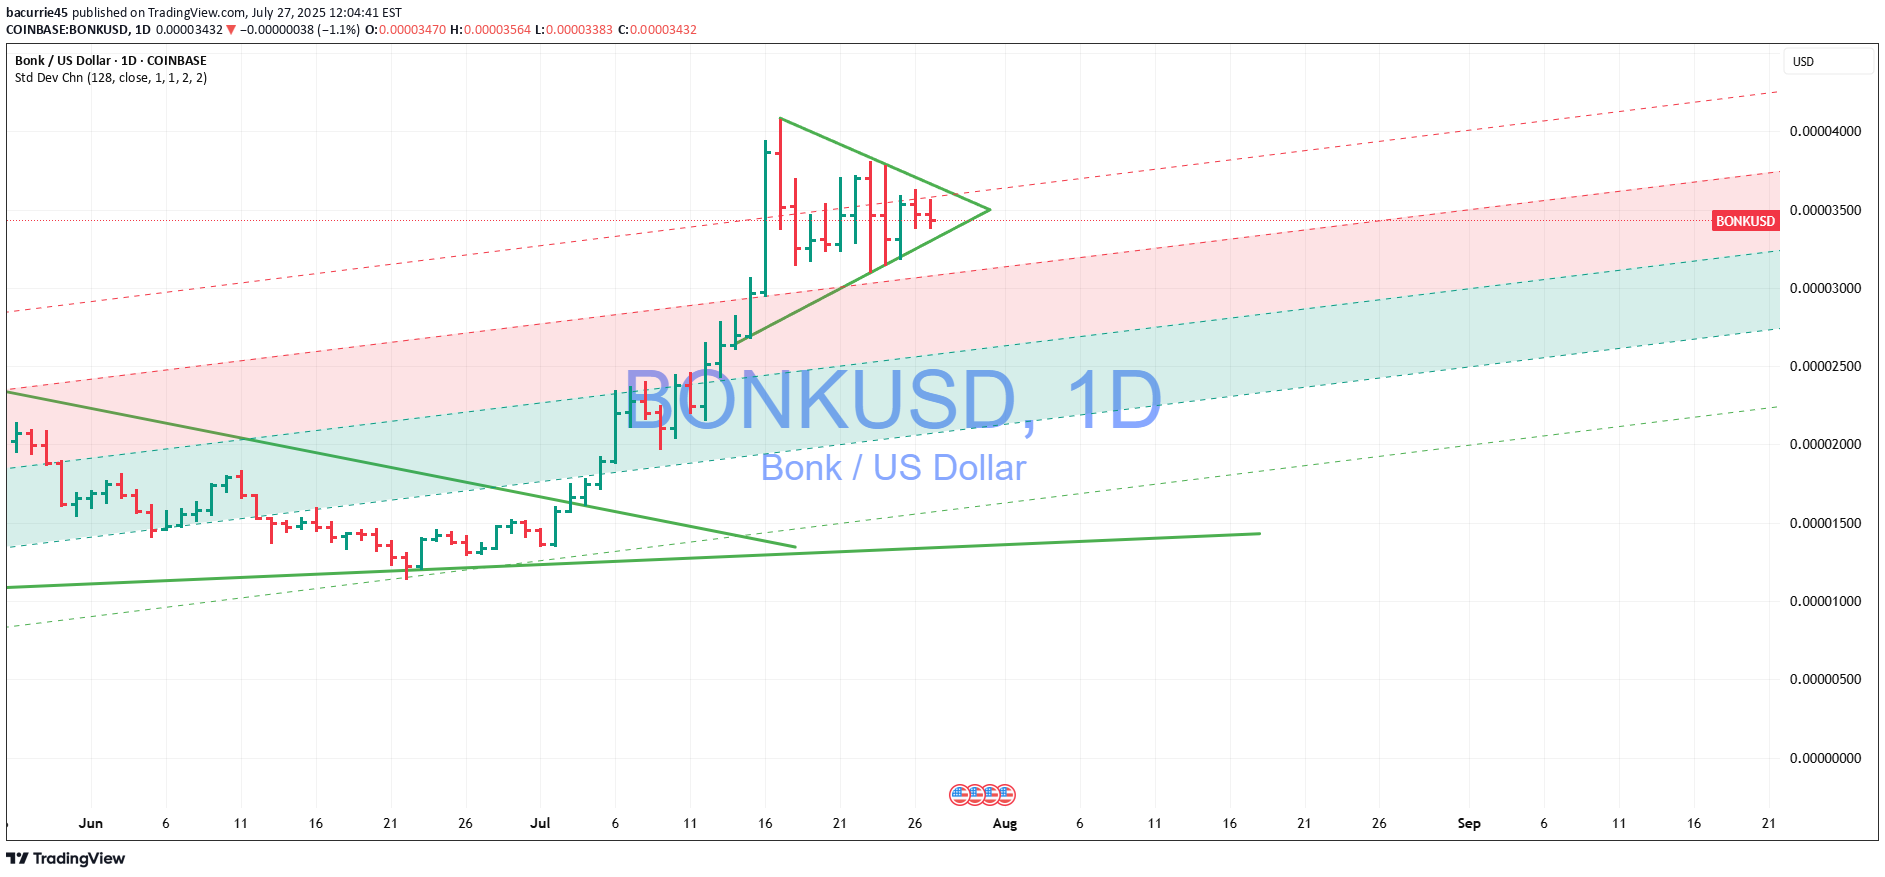
Hello traders as we can see BONK has had an excellent run and if you managed to get in at the bottom and ride the breakout from the first bullish pennant then you are certainly in a lot of profit!. The question is where does BONK go now. Yes we have been a way from the mean from a while. Yes we have hit the 1.618 on the fib extension and there is no requirement to go any higher as shown However I believe it can push on further and hit at least that 2.618 fib extension target of 0.00004585 but we need to find support on the 1.618 fib extension first. Remember markets seek liquidity so before it pushes on higher it may go lowerPullback initiated testing weekly pivot point a close below this is the invalidation of the thesis
bacurrie45
MANA ABOUT TO POP?
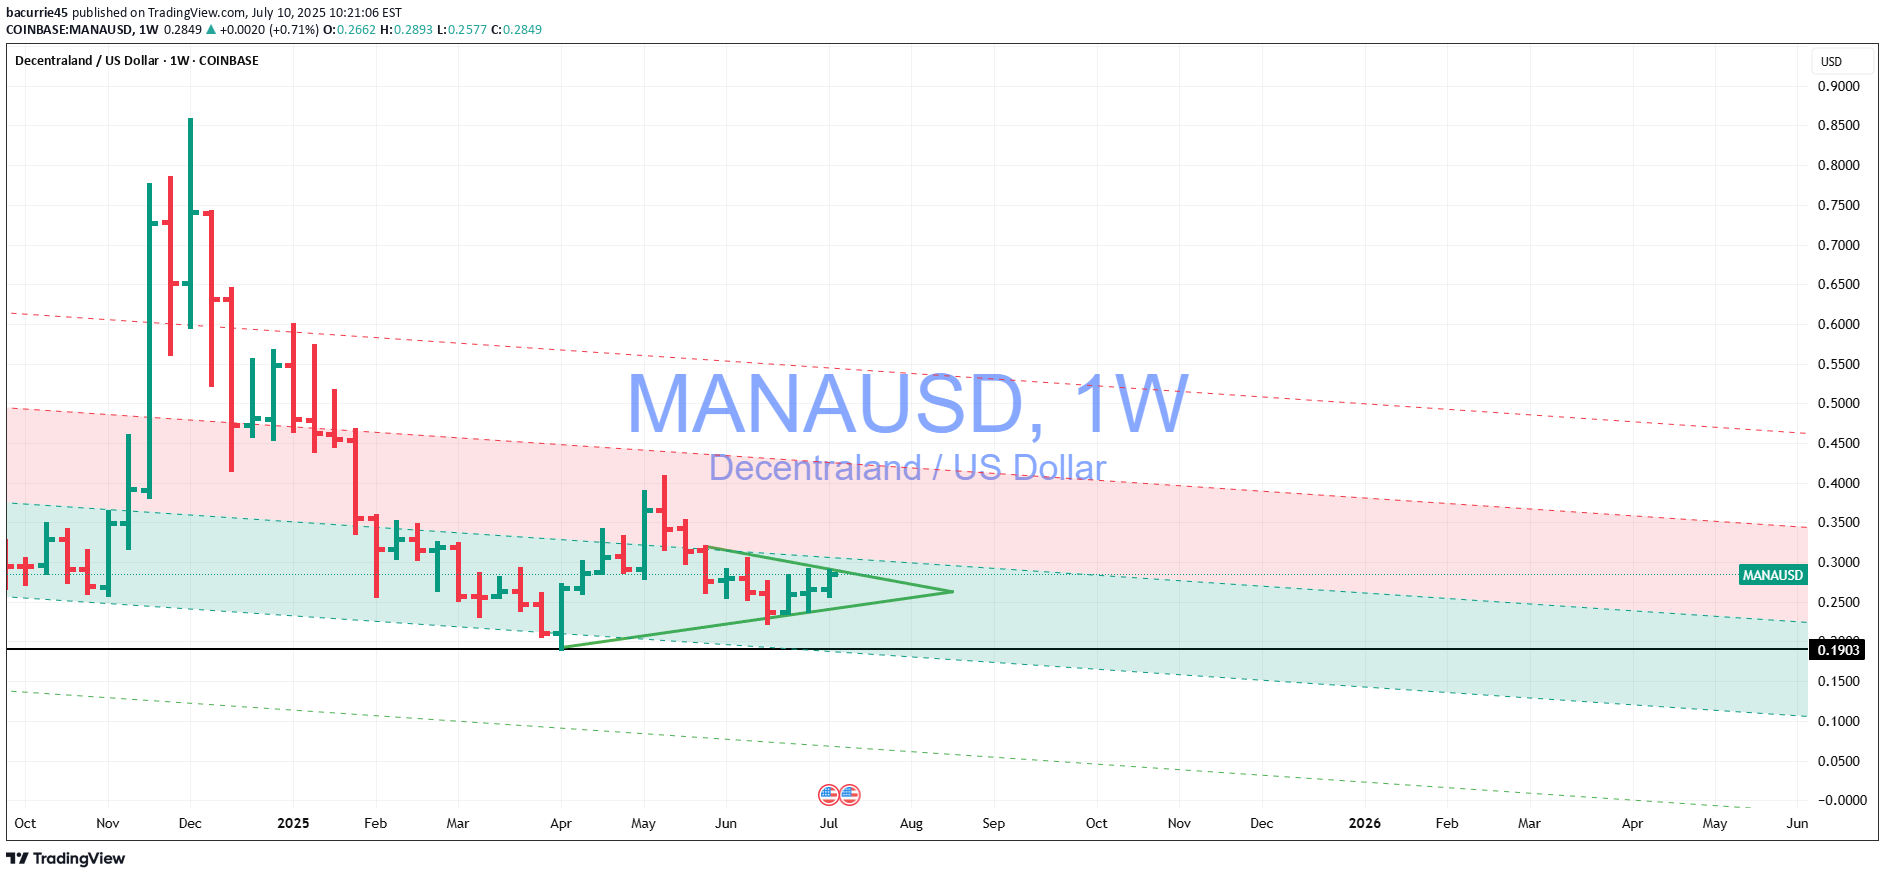
Hello traders similar set up to my analysis on FET. In fact all alts are displaying the same kind of pattern at the moment. Looking to go long based on the time away from the mean. Bullish pennant setting up on weekly timeframe It hit the S3 pivot on the Weekly. Stochastic and MACD rising. Need an increase in volume for conformation. Take profits for me personally are 0.44-0.6C. Breaks above the pivot and finds support next TP is 0.8C. Invalidation point and stop loss is 0.1903. If Alt season starts first before the breakout will do another updated chart with further price targets. As always trade the higher time frames, Daily, Weekly, Monthly. Use proper risk management. NFA
bacurrie45
FET ABOUT TO BREAKOUT?
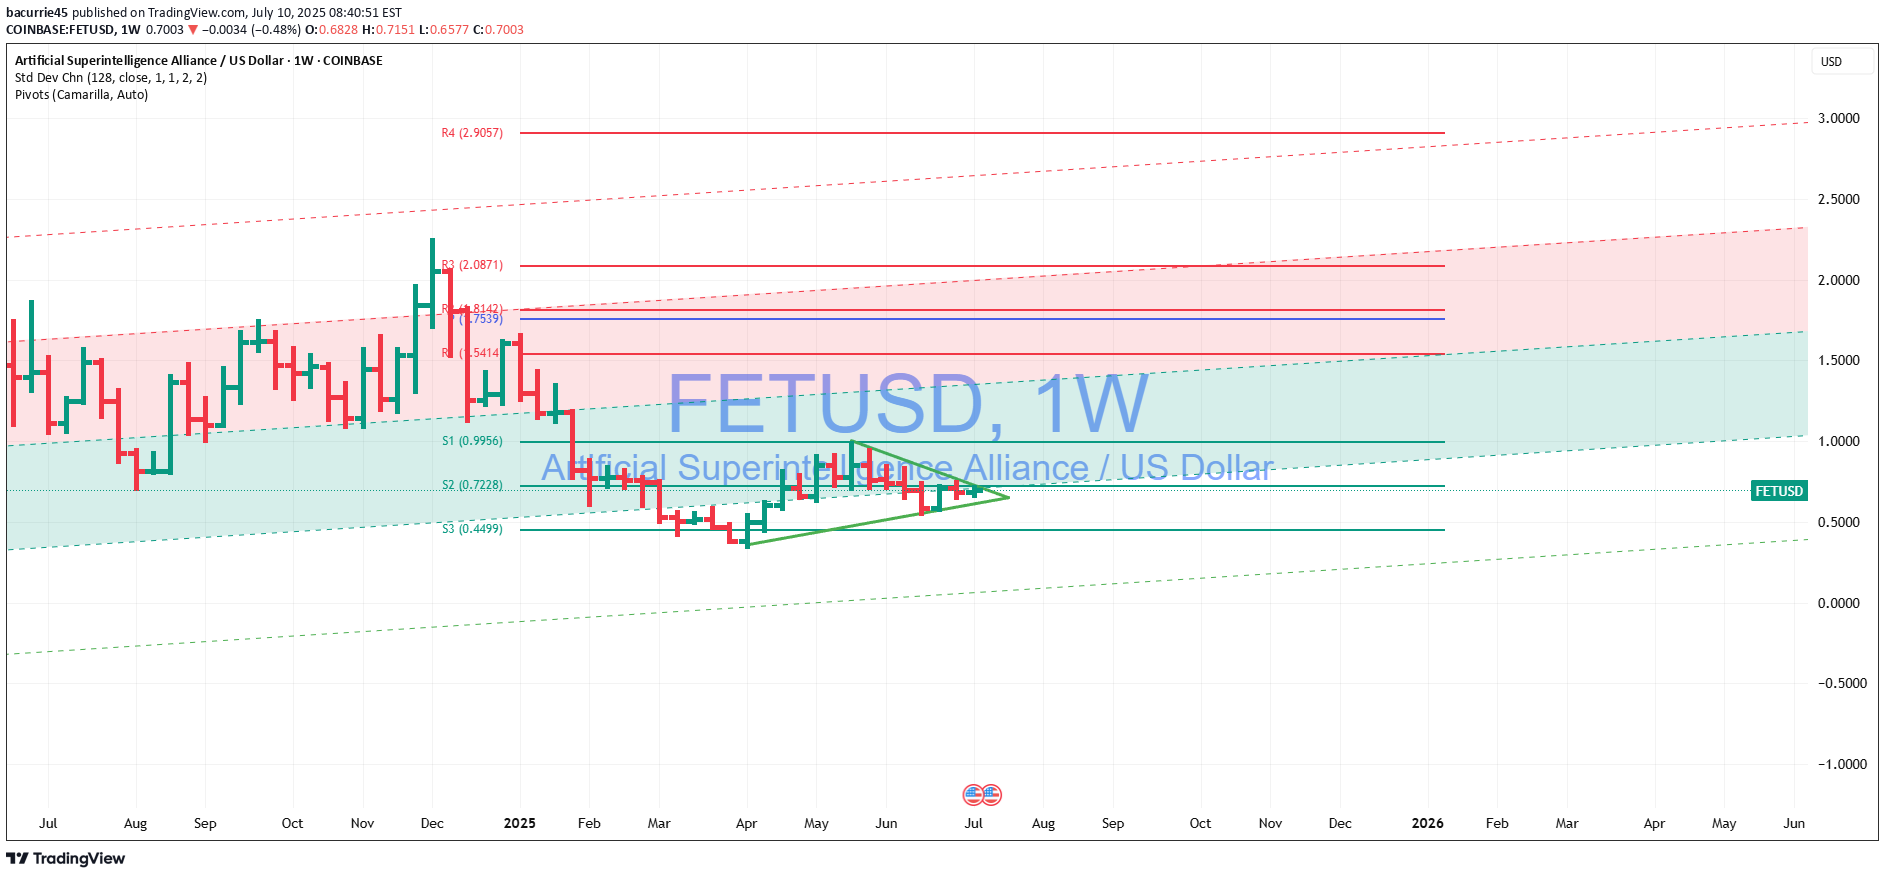
Hello fellow traders as we can see here on the chart I believe FET has hit its bottom and about to push further and breakout to the upside. We have a bullish pennant forming on the weekly chart. We have fallen and come back above the S3 pivot. Stochastic resetting and MACD rising. I am a mean reversion trader so for me minimum on this trade is $1.30. After this assuming the breakout continues then $2 and $3. Stop loss below that invalidation point being 0.3439 on the Weekly chart. Points of resistance are 0.96C and $1.50. If Alt coin season arrives before this breakout I will update the trade with further price targets. As always NFA, trade the higher time frames Daily, Weekly, Monthly this is where smart money trades!. Use proper risk management. Best of luck to everyone. Open to feedback and criticism :)Breakout has taken place now coming back for a retest and grappling with the pivot on the daily timeframe to see if it is the real deal or a fake pump
bacurrie45
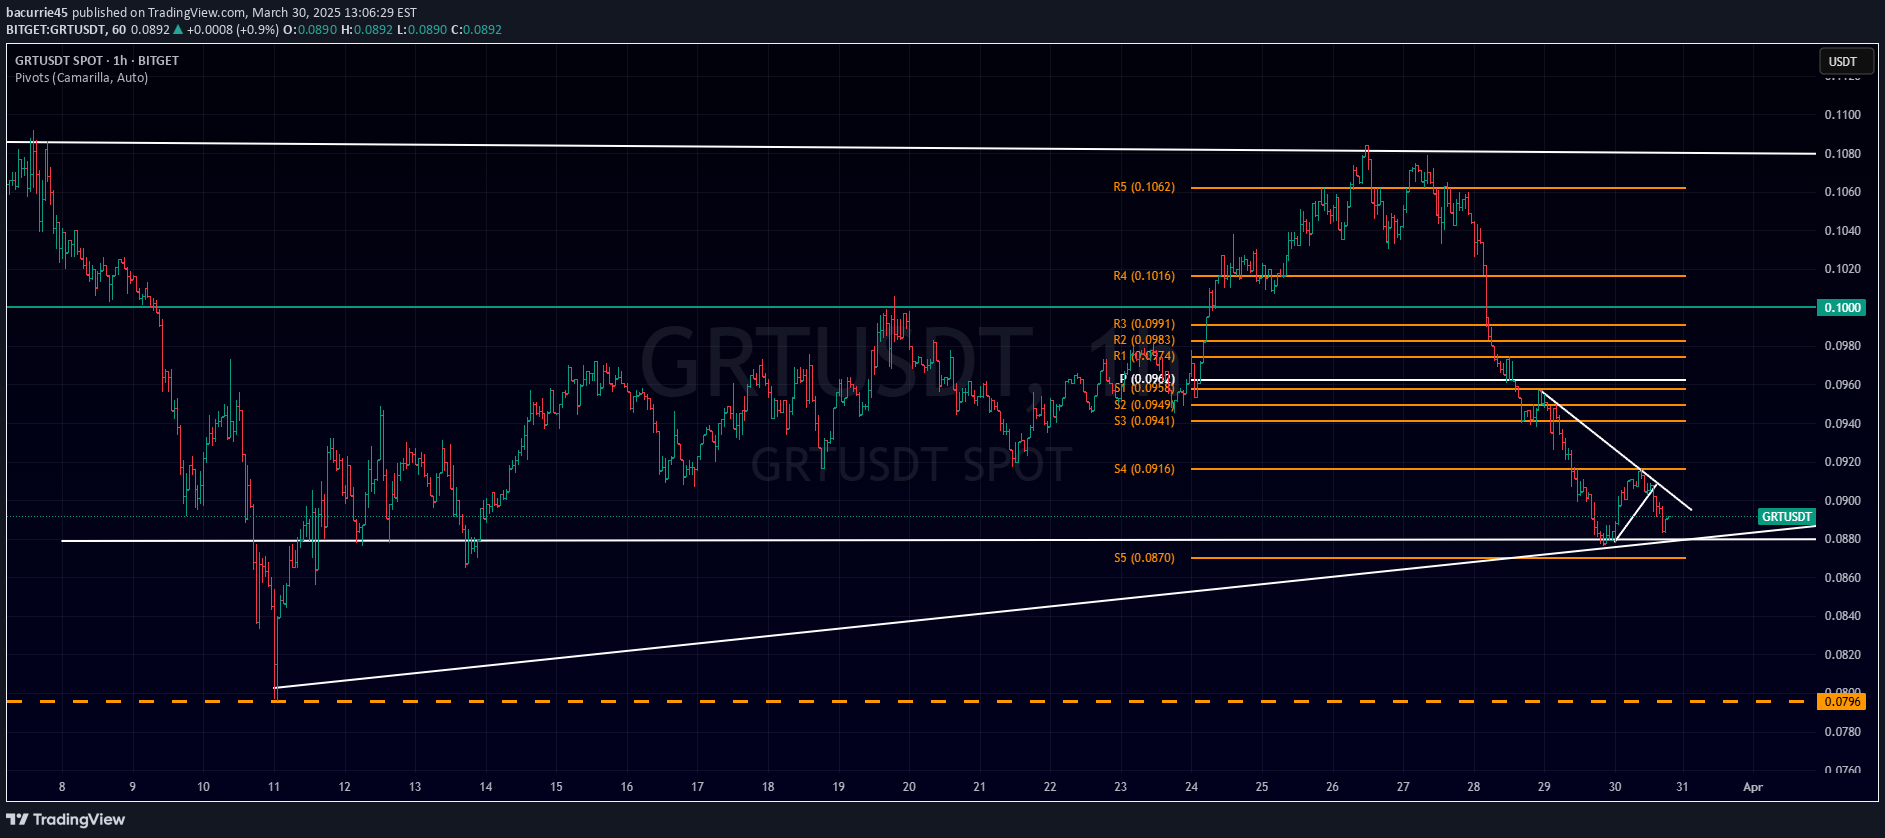
The Graph drop to 0.055C Then Rally to 0.27C?

Hello traders as we can see the graph looks like it may be falling and testing the ultimate lows what I have named the last line of defence which is around 0.05C. Great buying opportunity where I will be loading my bags. From here an obvious take profit is that prevailing green trend line suppressing the line around 0.27C Entry 0.05C TP1 0.1 TP2 0.2 TP3 0.3 NFA
bacurrie45
THE GRAPH LOWER BEFORE HIGHER?

Hello traders as we can see the graph is trying to break out but is struggling. I believe a ST of that yearly low 0.0796 is about to take place. Before pushing higher the graph needs liquidity from lower prices If broken cheaper prices are on the horizon such as 0.0765 0.0732 0.6 and even 0.0520 C If this happens I will be loading my bags! NFARejection of pivot point first target 0.080CClosed out at 0.078 The yearly low was hit and even went lower as expected
bacurrie45
GRAPH MAKE IT OR BREAK IT
Hello traders as we can see the GRAPH is in a continuous downtrend. I believe it will come and test the yearly low or even put in a new lowTrend line broke now coming back for the retest to make sure it is the real deal. If it is I am long and targeting the top of the channel at 0.1C
bacurrie45
MAKE IT OR BREAK IT FOR POLY

Hello traders as we can see POLY has been selling off. It has been rejected of that trend line and lost that long terms support trend line. If it breaks the S4 pivot then it is heading to test that all time low of 0.1908C and maybe even lower
bacurrie45
MATIC CHEAPER PRICES AHEAD

Hello traders as we can see Matic has been rejected of the resistance multiple times indicating a struggle to push higher. I believe Matic will fall further and maybe even test that yearly low of $0.1908C if it breaks this then we could be looking at 0.10C or even lower for MATIC which is a great opportunity to accumulate. For now I am shorting Matic until I see a sign it has bottomedBeen shorting since 0.2467 as it has been rejected many times from here. Price has mean reverted and falling. Below every EMA. If it breaks that strong support (white line) which it has always bounced from then we could be looking at 20C nexttook profit at 0.2100C
bacurrie45
BITCOIN BACK TO 92K

Hello traders as we can see BTC is struggling to climb higher and below the pivot point. A break below the trend line will see support at 92KAs we can see the upper trend line was broken came up for a retest got rejected next support is around 92K it can fall to around $91,400 as we can see there was a big reaction at that price previously. Failure by buyers to step back in at these prices could see BTC fall to 89K. Expecting a consolidation for a while after that to be honest SL : $105000 TP $94000,$92000,$91500,$90000Trade closed
bacurrie45
BITCOIN TO $49K

Hello traders as we can see on the chart many times bitcoin was trading at the extremes of the linear regression channel in this case 3x the standard deviation. That strong resistance line showing bitcoin being rejected every time. The bottom of the channel shows $46500. If BTC falls out of this bottom channel that is again 3x the standard deviation from the mean so will be looking for where it finds support below this then looking for that reversion back to the mean. The fib channel shows confluence with my idea that we may be coming back to test that golden pocket at 49K
Disclaimer
Any content and materials included in Sahmeto's website and official communication channels are a compilation of personal opinions and analyses and are not binding. They do not constitute any recommendation for buying, selling, entering or exiting the stock market and cryptocurrency market. Also, all news and analyses included in the website and channels are merely republished information from official and unofficial domestic and foreign sources, and it is obvious that users of the said content are responsible for following up and ensuring the authenticity and accuracy of the materials. Therefore, while disclaiming responsibility, it is declared that the responsibility for any decision-making, action, and potential profit and loss in the capital market and cryptocurrency market lies with the trader.