
azdxb
@t_azdxb

What symbols does the trader recommend buying?
Purchase History
پیام های تریدر
Filter
Signal Type
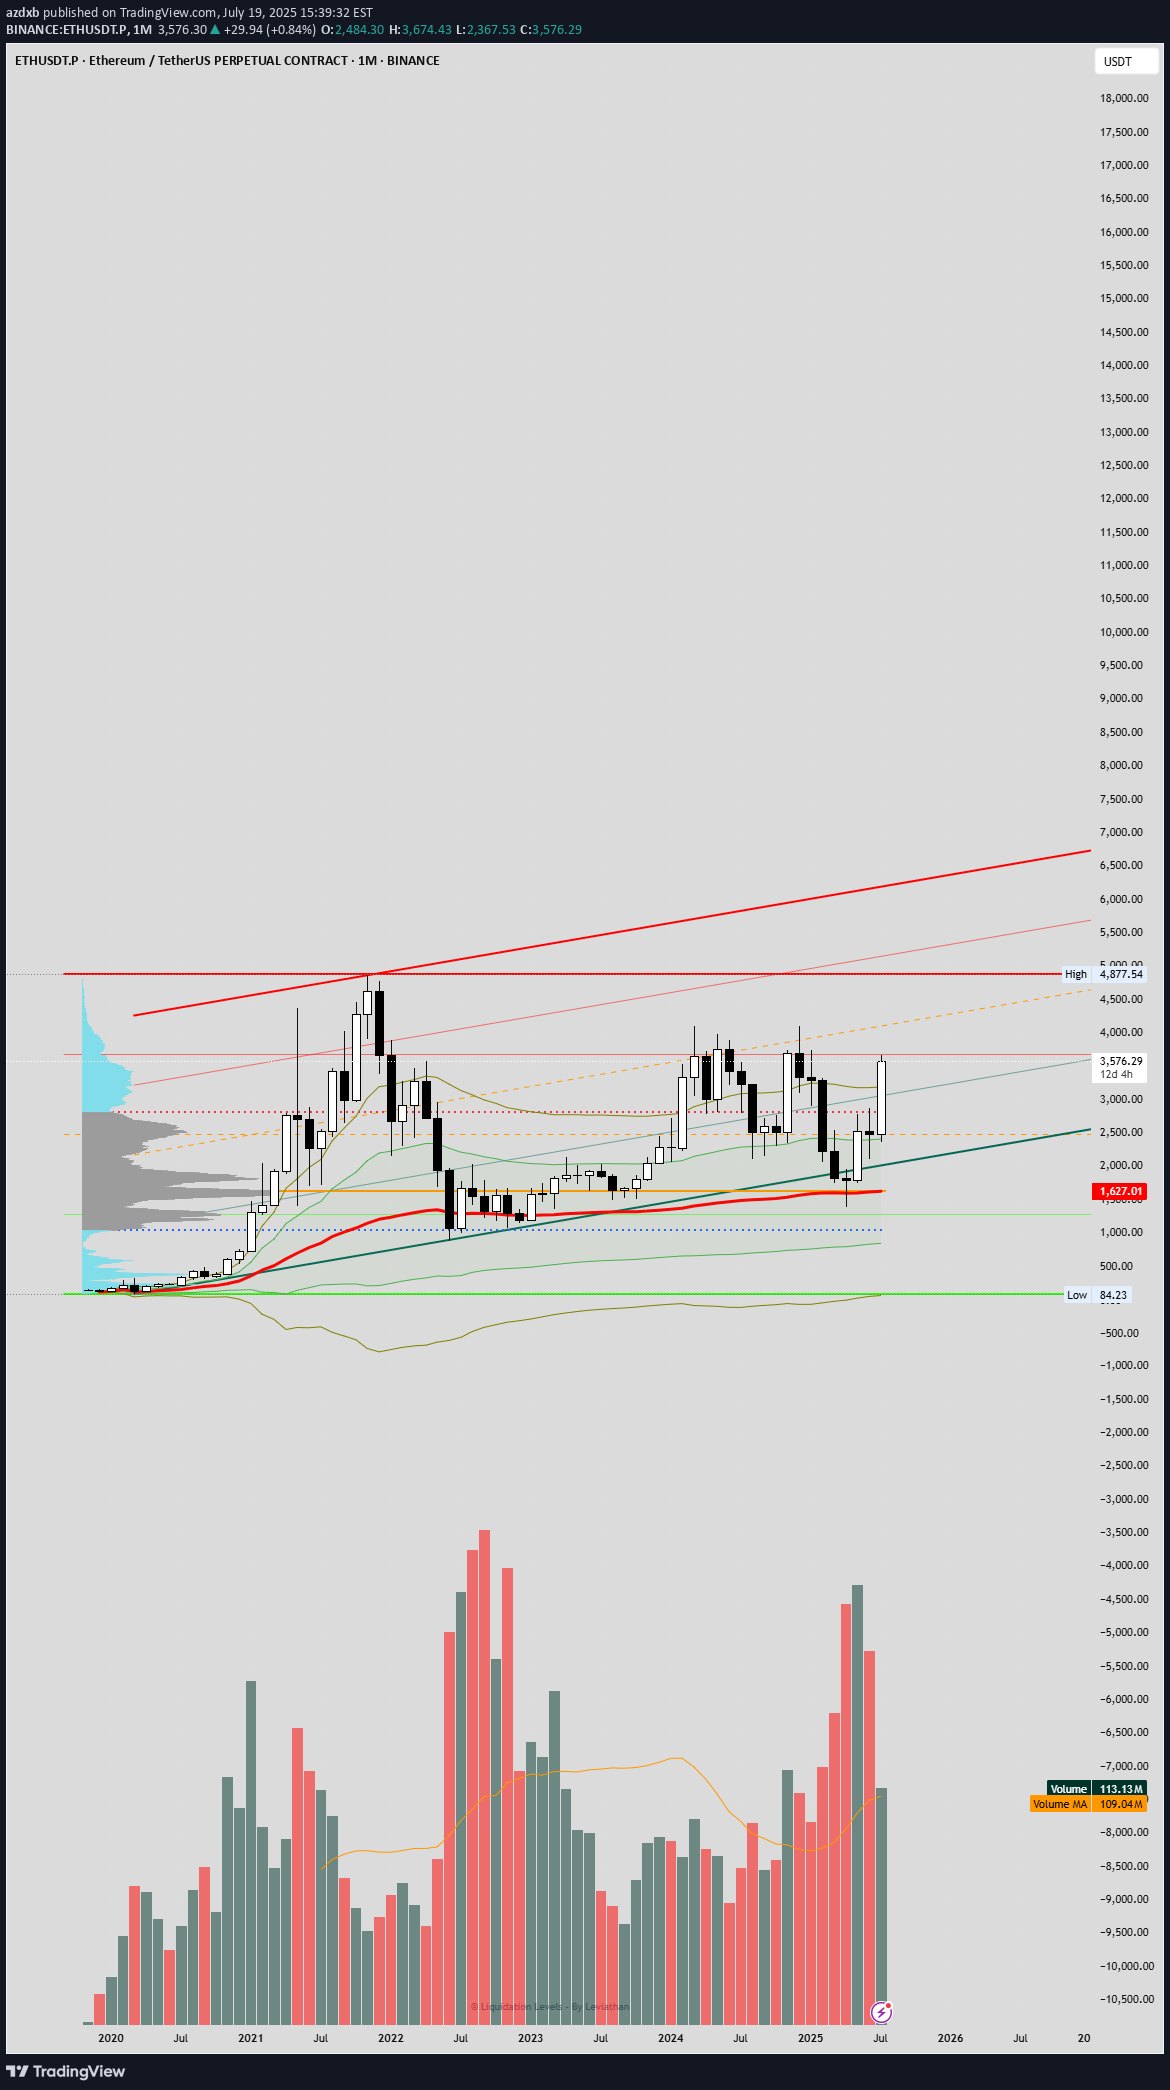
The chart highlights a bullish structure with the AVWAP providing key dynamic support and resistance levels. The price has recently approached the upper AVWAP deviation around $4,977.54, aligning with the prior bull flag scenario's resistance zone. The red trendline indicates a potential upper boundary, while the green and orange lines suggest intermediate supports and resistances, with the current price near $3,579.48 testing the middle range. The lower AVWAP deviation near $842.23 serves as a critical invalidation level. Volume remains supportive, with spikes corresponding to price movements, and the volume moving average (109.4k) indicates steady activity. Real-time data shows ETH trading at $3,565-$3,600, consistent with the chart's mid-range levels, driven by ETF inflows and on-chain activity. A breakout above $3,700-$4,000 with increased volume could target $3,834-$4,000 or higher, while support at $2,533-$2,700 remains vital. Sentiment on X and web sources is optimistic, though volatility persists due to external factors.
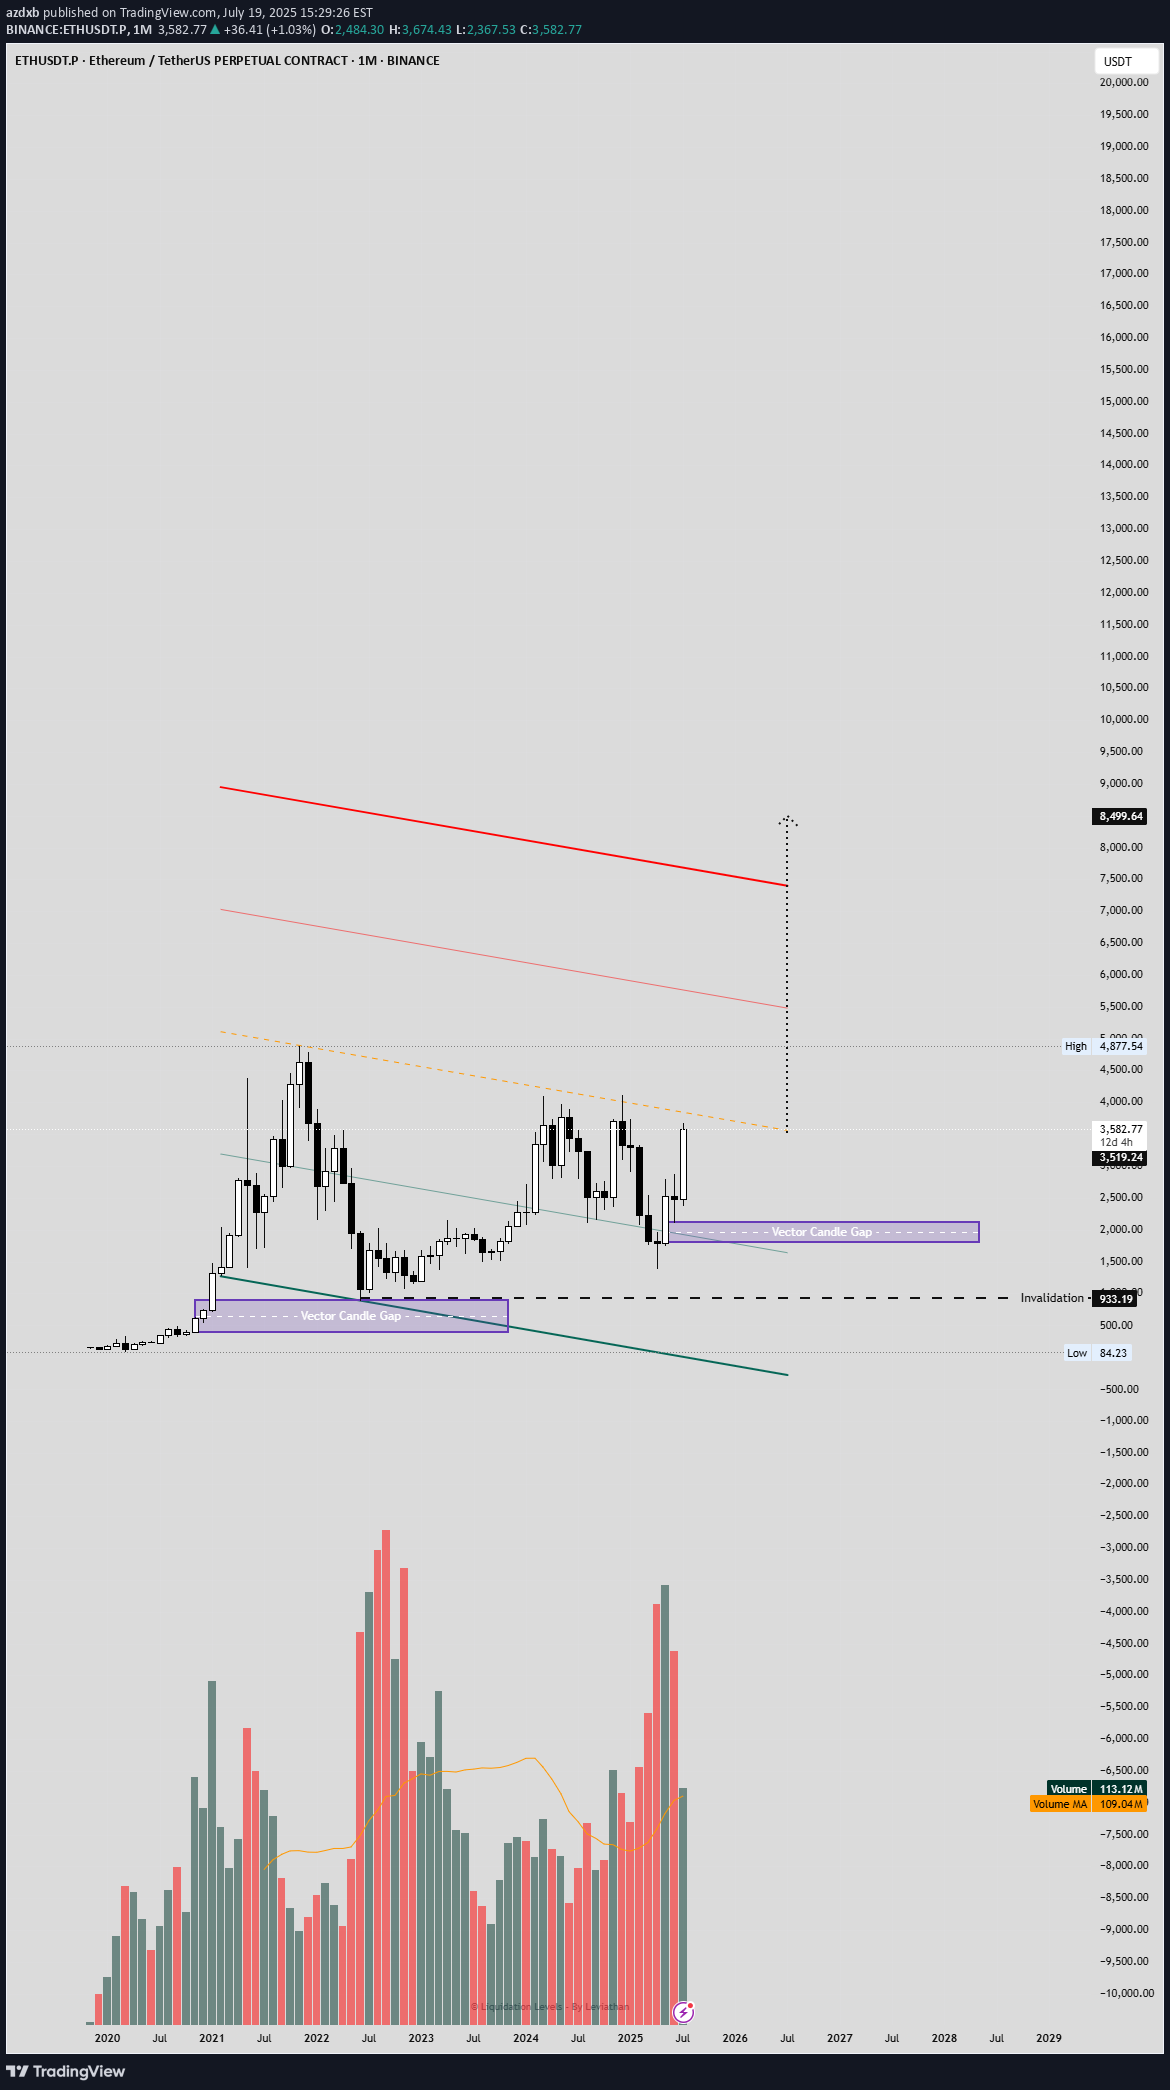
The monthly chart suggests a potential bull flag pattern, with a strong upward trend followed by consolidation. The "Vector Candle Gap" indicates a breakout zone around $4,977.64, with recent price action testing resistance near $3,700-$4,000. Volume trends support the bullish case, showing increased activity during the initial rise and consolidation. The moving average reinforces an upward trajectory, but a downward-sloping trendline and support at $933.19-$2,800 suggest invalidation risks if the price drops below these levels. Real-time data shows ETH trading at $3,565-$3,600, bolstered by institutional inflows into spot ETH ETFs and on-chain activity. The bull flag aligns with a potential target of $3,834-$4,000 if the breakout sustains with strong volume. Key support lies at $2,533-$2,700, with sentiment on X and web sources remaining optimistic, though volatility persists due to macroeconomic and regulatory factors.
Disclaimer
Any content and materials included in Sahmeto's website and official communication channels are a compilation of personal opinions and analyses and are not binding. They do not constitute any recommendation for buying, selling, entering or exiting the stock market and cryptocurrency market. Also, all news and analyses included in the website and channels are merely republished information from official and unofficial domestic and foreign sources, and it is obvious that users of the said content are responsible for following up and ensuring the authenticity and accuracy of the materials. Therefore, while disclaiming responsibility, it is declared that the responsibility for any decision-making, action, and potential profit and loss in the capital market and cryptocurrency market lies with the trader.