Technical analysis by azdxb about Symbol ETH on 7/19/2025

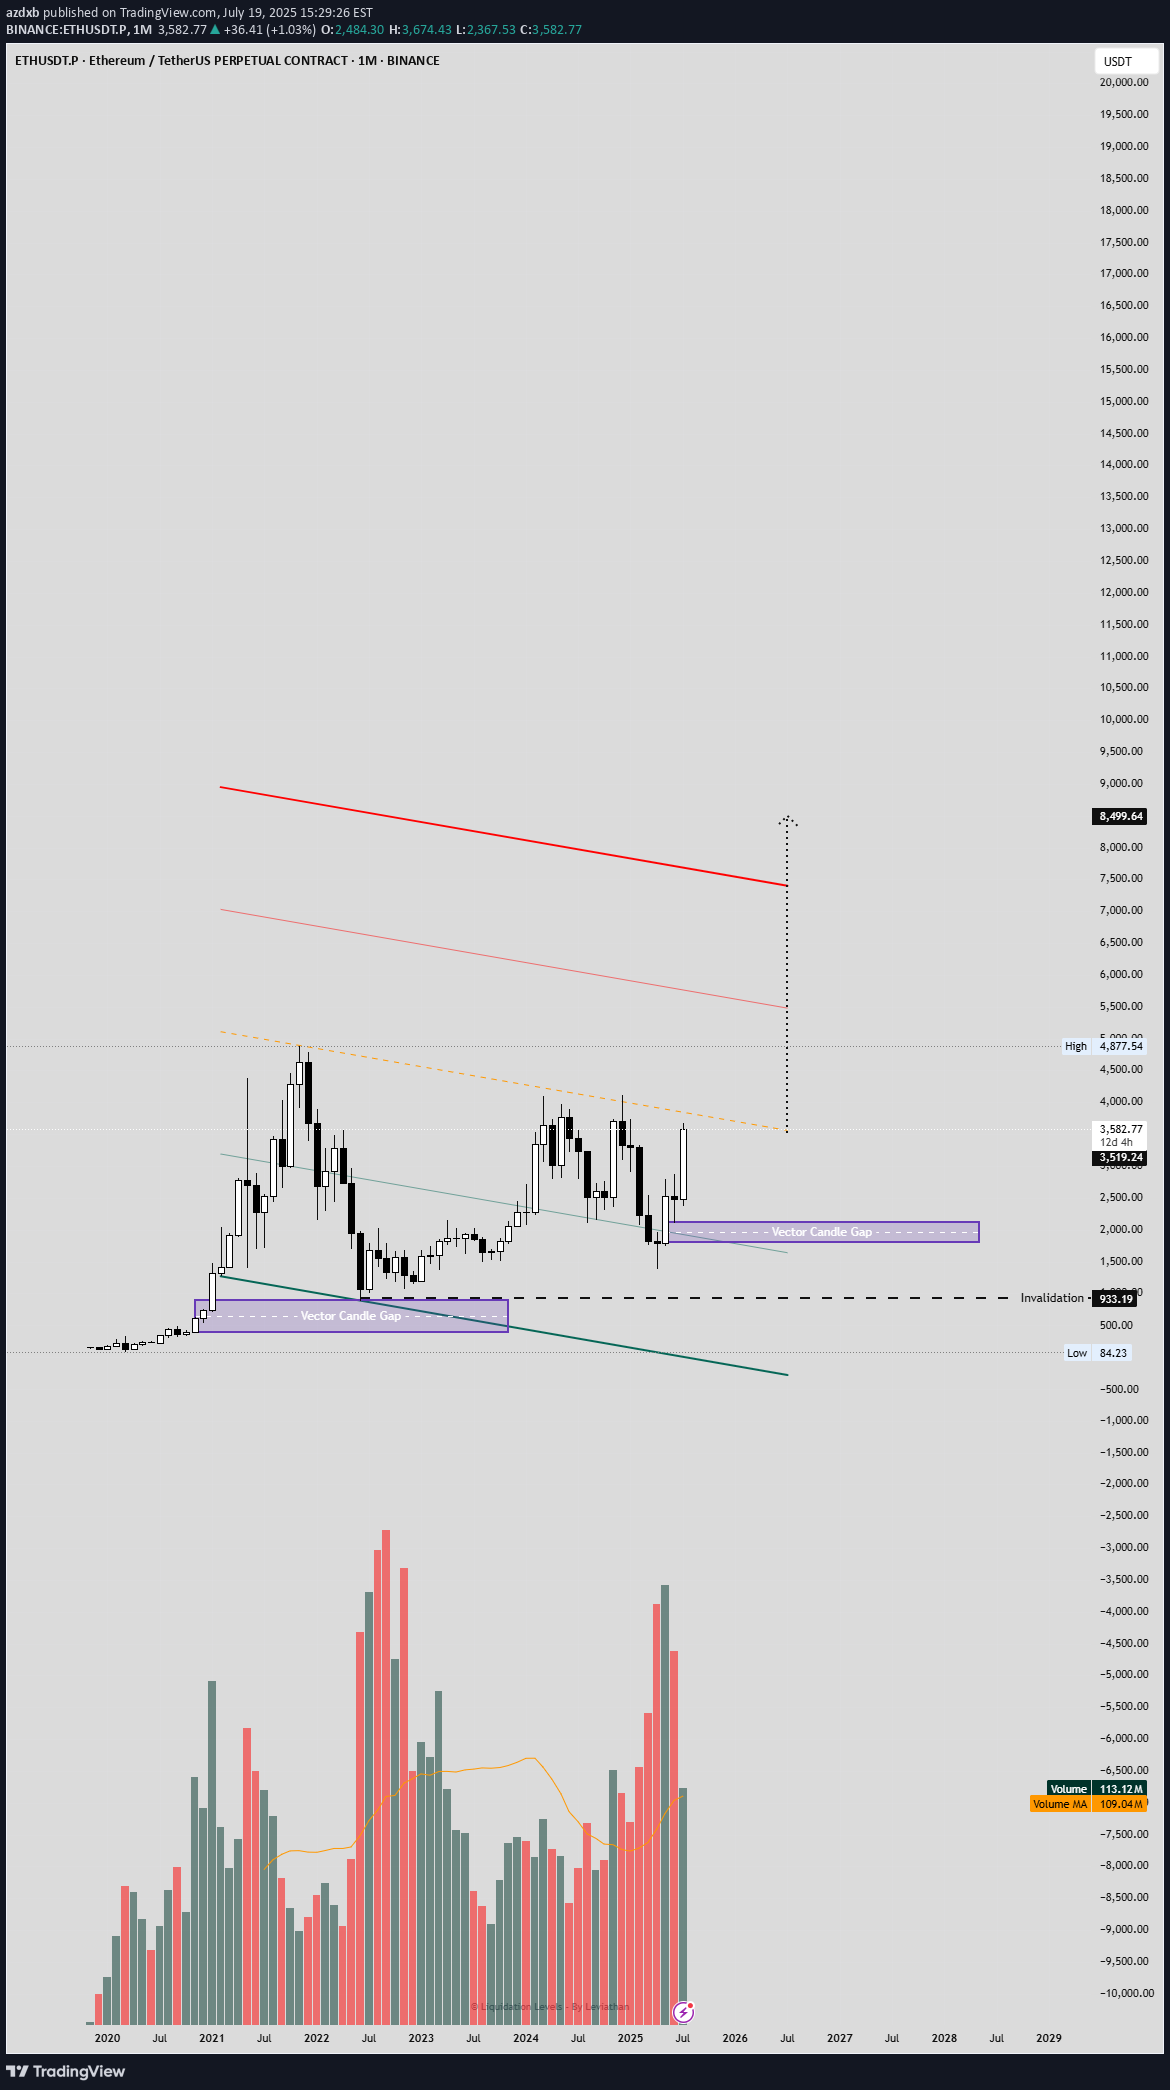
The monthly chart suggests a potential bull flag pattern, with a strong upward trend followed by consolidation. The "Vector Candle Gap" indicates a breakout zone around $4,977.64, with recent price action testing resistance near $3,700-$4,000. Volume trends support the bullish case, showing increased activity during the initial rise and consolidation. The moving average reinforces an upward trajectory, but a downward-sloping trendline and support at $933.19-$2,800 suggest invalidation risks if the price drops below these levels. Real-time data shows ETH trading at $3,565-$3,600, bolstered by institutional inflows into spot ETH ETFs and on-chain activity. The bull flag aligns with a potential target of $3,834-$4,000 if the breakout sustains with strong volume. Key support lies at $2,533-$2,700, with sentiment on X and web sources remaining optimistic, though volatility persists due to macroeconomic and regulatory factors.
