Technical analysis by azdxb about Symbol ETH on 7/19/2025

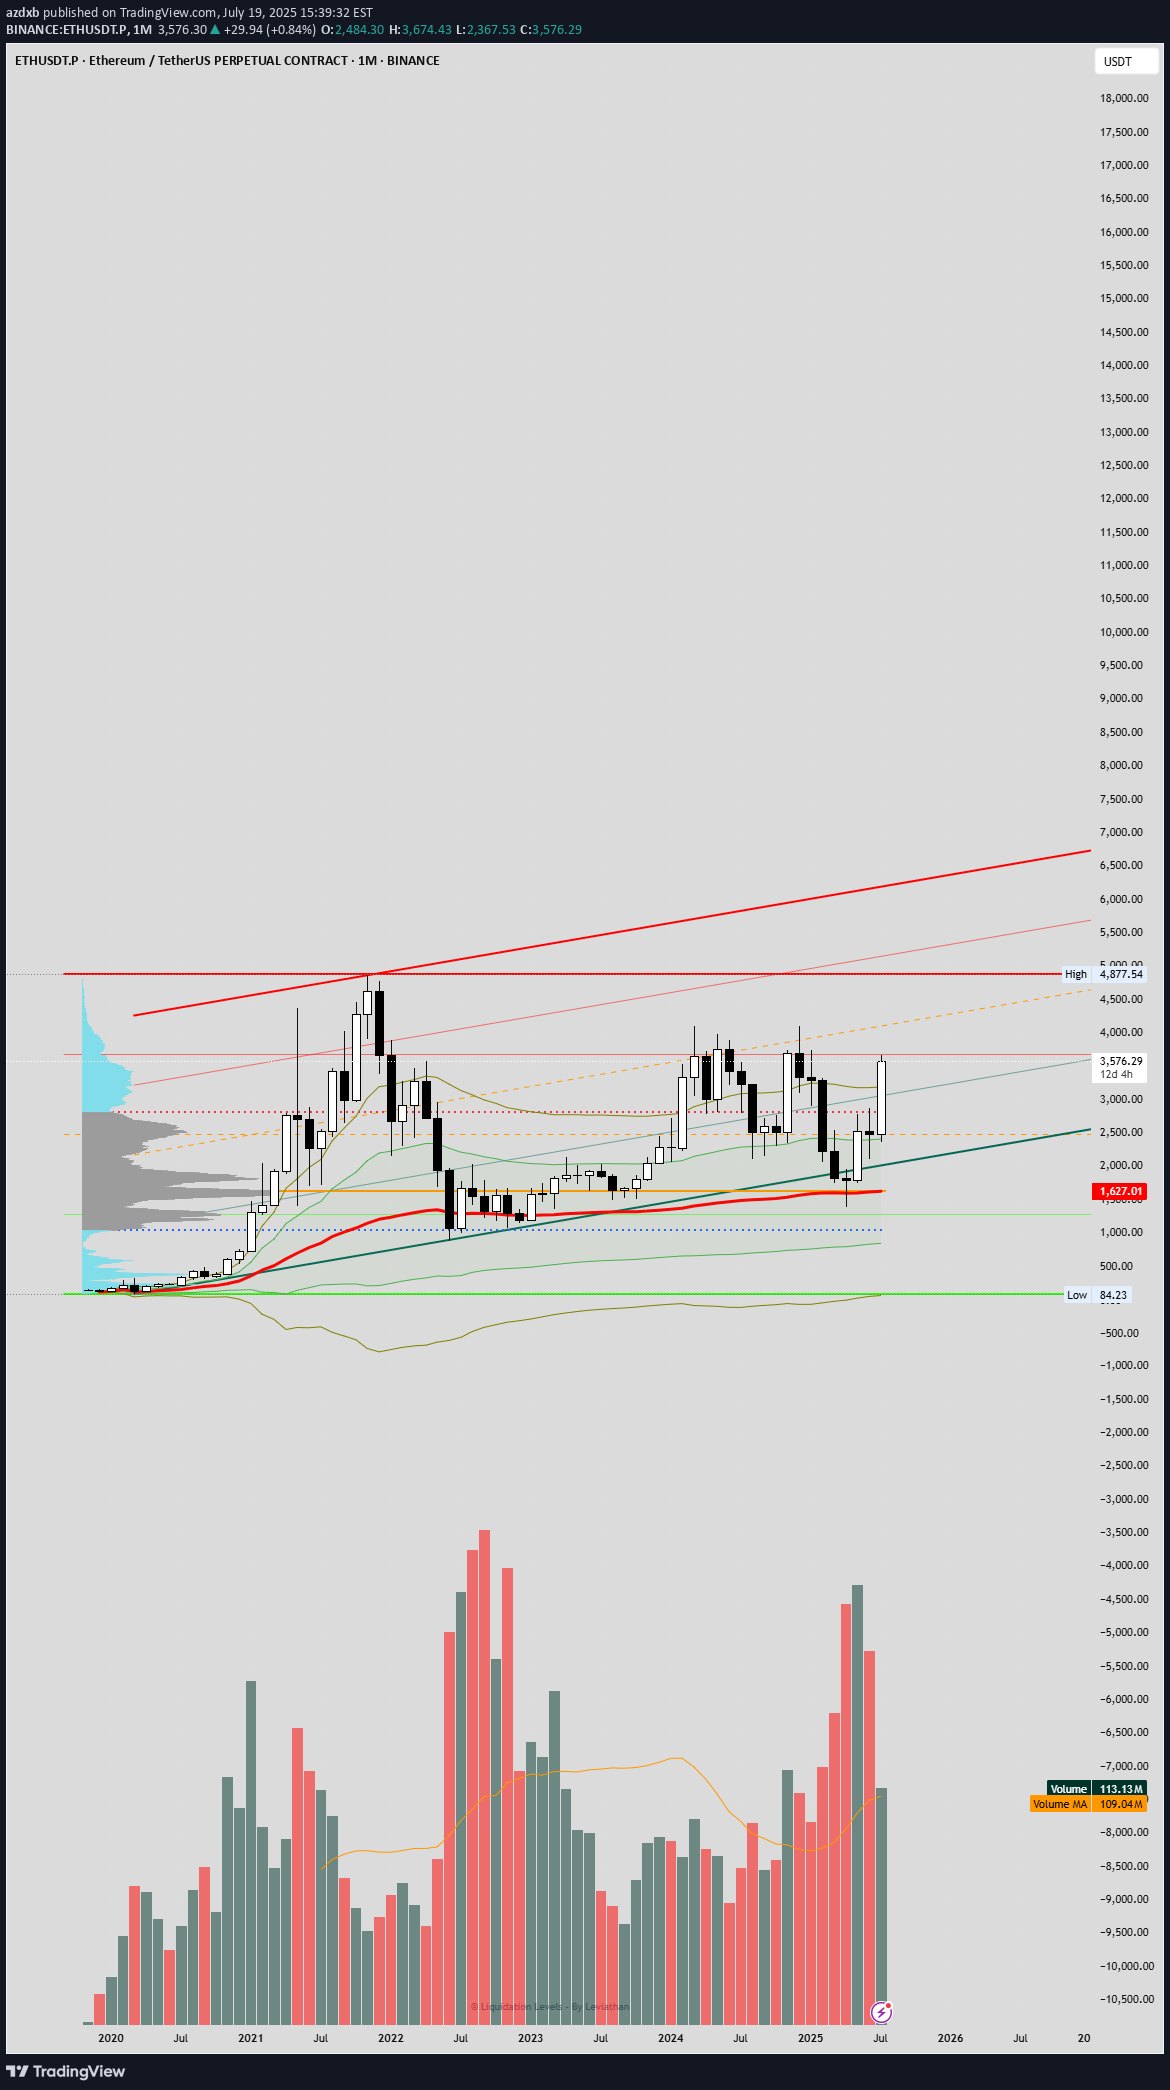
The chart highlights a bullish structure with the AVWAP providing key dynamic support and resistance levels. The price has recently approached the upper AVWAP deviation around $4,977.54, aligning with the prior bull flag scenario's resistance zone. The red trendline indicates a potential upper boundary, while the green and orange lines suggest intermediate supports and resistances, with the current price near $3,579.48 testing the middle range. The lower AVWAP deviation near $842.23 serves as a critical invalidation level. Volume remains supportive, with spikes corresponding to price movements, and the volume moving average (109.4k) indicates steady activity. Real-time data shows ETH trading at $3,565-$3,600, consistent with the chart's mid-range levels, driven by ETF inflows and on-chain activity. A breakout above $3,700-$4,000 with increased volume could target $3,834-$4,000 or higher, while support at $2,533-$2,700 remains vital. Sentiment on X and web sources is optimistic, though volatility persists due to external factors.
