
asdaf06
@t_asdaf06

What symbols does the trader recommend buying?
Purchase History
پیام های تریدر
Filter
asdaf06
بیت کوین در گردنه حساس: آیا سقف ۱۰۳ هزار دلار شکسته میشود یا سقوط به ۷۳ هزار؟
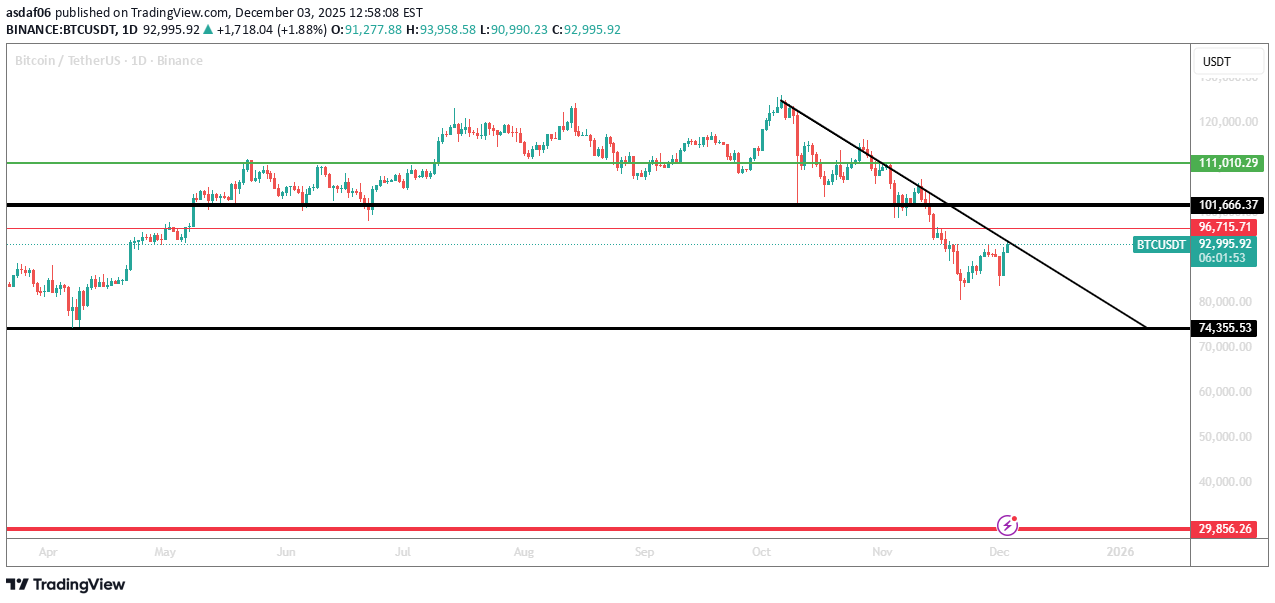
Bitcoin needs to break above the 101–103k zone. If it manages to do that, the next target would be around 111k. If it does not reach that level and does not break the downward trendline, then the next important level is 73k. This area is likely to be strongly defended by investors to prevent the price from reaching it or falling below it. If the price drops below that zone, then the bottom for the next cycle would be around 30k. This is purely a technical analysis view. If I personally wanted to invest, I would focus on prices that include the digit “5” in Bitcoin’s price. I would be looking to enter at: 105k 135k in case of further upside 75k 35k in case of deeper downside These levels are not guesses and not the result of a simple mathematical formula. They come from a technical view of Bitcoin. After Bitcoin broke below the 50-week moving average the week before last, the price quickly dropped by about 20%. Right now, Bitcoin is breaking the 200-period moving average consecutively on the 3-hour timeframe. This is a positive sign, and it is also forming a low followed by a higher low. Along with the volume, this is creating a positive divergence. But my final assessment to the question: “Has the bearish wave really reversed now?” My answer is: 0 out of 3. That is my honest answer, not based on emotion or trying to please anyone. In the end, and always: this is not investment advice. Note: I am only translating and polishing your own analysis here, not adding any investment recommendation from my side.
asdaf06
ساعتهای پایانی: بیت کوین زیر این خط بماند، سقوط میکند یا به ۱۰۷ هزار دلار میرسد؟
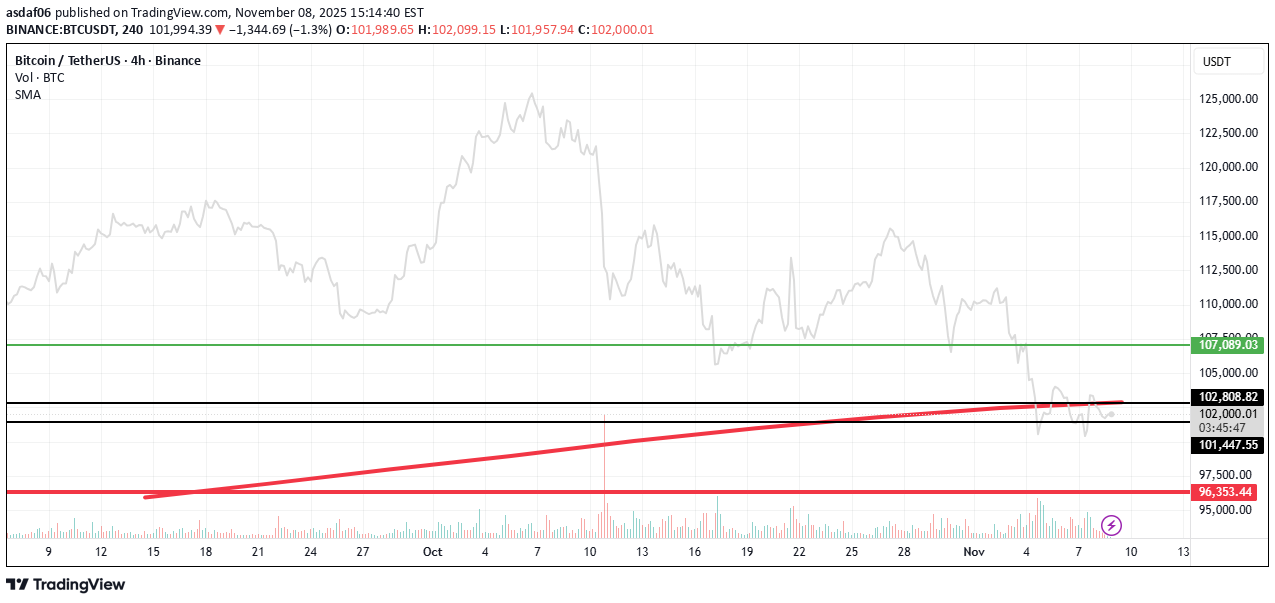
Bitcoin must not close the candle below the 50-week moving average in order to reach $107,000, or unfortunately, the price may drop to the next resistance around $96,350. The whole world is waiting. This is technical analysis only and not investment advice.
asdaf06
Proposed ~11% Average Gain Trade Strategy with COS

This is a 4-step buying plan where you add to your position as the price goes up. Your stop-loss automatically moves to a "breakeven" point after each phase, guaranteeing no loss if the price reverses. 1. The Entries (Buying More as it Rises): E-1: Buy 10% at price 0.003457 E-2: Buy another 30% at the higher price 0.003774 E-3: Buy another 30% at the higher price 0.004189 (You now own 70%) E-4: Buy the final 30% at the high price 0.008998 (You now own 100%) 2. The Exits & Risk Management (The "No-Loss" Trick): After E-3 (70% owned), you set a Stop-Loss at S-L-3. The S-L-3 price is set at your average purchase price for the first 70%. If the price hits S-L-3, you sell all 70%. Since the price is at your average cost, you break even and lose nothing. After E-4 (100% owned), you move your Stop-Loss to S-L-4. The S-L-4 price is set at your new, higher average purchase price for the entire 100% position. If the price hits S-L-4, you sell 100%. Again, you break even and lose nothing. 3. The Profit Target: You sell your entire 100% position for profit at the final target price: S-0. In simple terms: You keep buying as the price goes up. After each major purchase, you move your stop-loss to the price you paid on average, locking in a "no-loss" scenario. Your only goal is to reach the high-profit target (S-0) without being stopped out at breakeven. * This is for educational purposes only and is not investment advice
asdaf06

asdaf06
Simple Technical Analysis for Bitcoin

If the price closes above $69,150, then, God willing, we may head toward the next target at $107,000. However, if it closes below this level, the likely direction would be toward $84,200. In my personal view — and God knows best — the chances of a downward move seem higher than an upward one at the moment.
asdaf06
If we close below $96,737 it may go to 87,200

If Bitcoin closes below $96,737, it may head towards the critical support level at $87,200, according to technical analysis. This level could play a pivotal role in determining the next trend direction.
asdaf06
I think no more clear than this one

This pattern is called "negative divergence between price and volume". When the price is moving upward (upper red line), but the volume is decreasing (lower red line), it signals weak buying momentum. This often suggests that the price rally may not be sustainable and could lead to a potential reversal or correction.
asdaf06
6 enters and 3 exit to get 500% as a profit

DCA with 6 enters and 3 exit to get up to 500% as a profit
asdaf06
what is the most nice day's closing

we have 61% as profit and what is the most nice day's closing it was just under our sell target i am so happy for thatcheck my lst good idea link blow
asdaf06
42% is good profit

Hi this is my idea for my self :) two times to enter and one exit you can keep same coin for your grandchildren from the profit
Disclaimer
Any content and materials included in Sahmeto's website and official communication channels are a compilation of personal opinions and analyses and are not binding. They do not constitute any recommendation for buying, selling, entering or exiting the stock market and cryptocurrency market. Also, all news and analyses included in the website and channels are merely republished information from official and unofficial domestic and foreign sources, and it is obvious that users of the said content are responsible for following up and ensuring the authenticity and accuracy of the materials. Therefore, while disclaiming responsibility, it is declared that the responsibility for any decision-making, action, and potential profit and loss in the capital market and cryptocurrency market lies with the trader.