
arztraderofficial
@t_arztraderofficial

What symbols does the trader recommend buying?
Purchase History
پیام های تریدر
Filter
arztraderofficial
BTC 1D Analysis
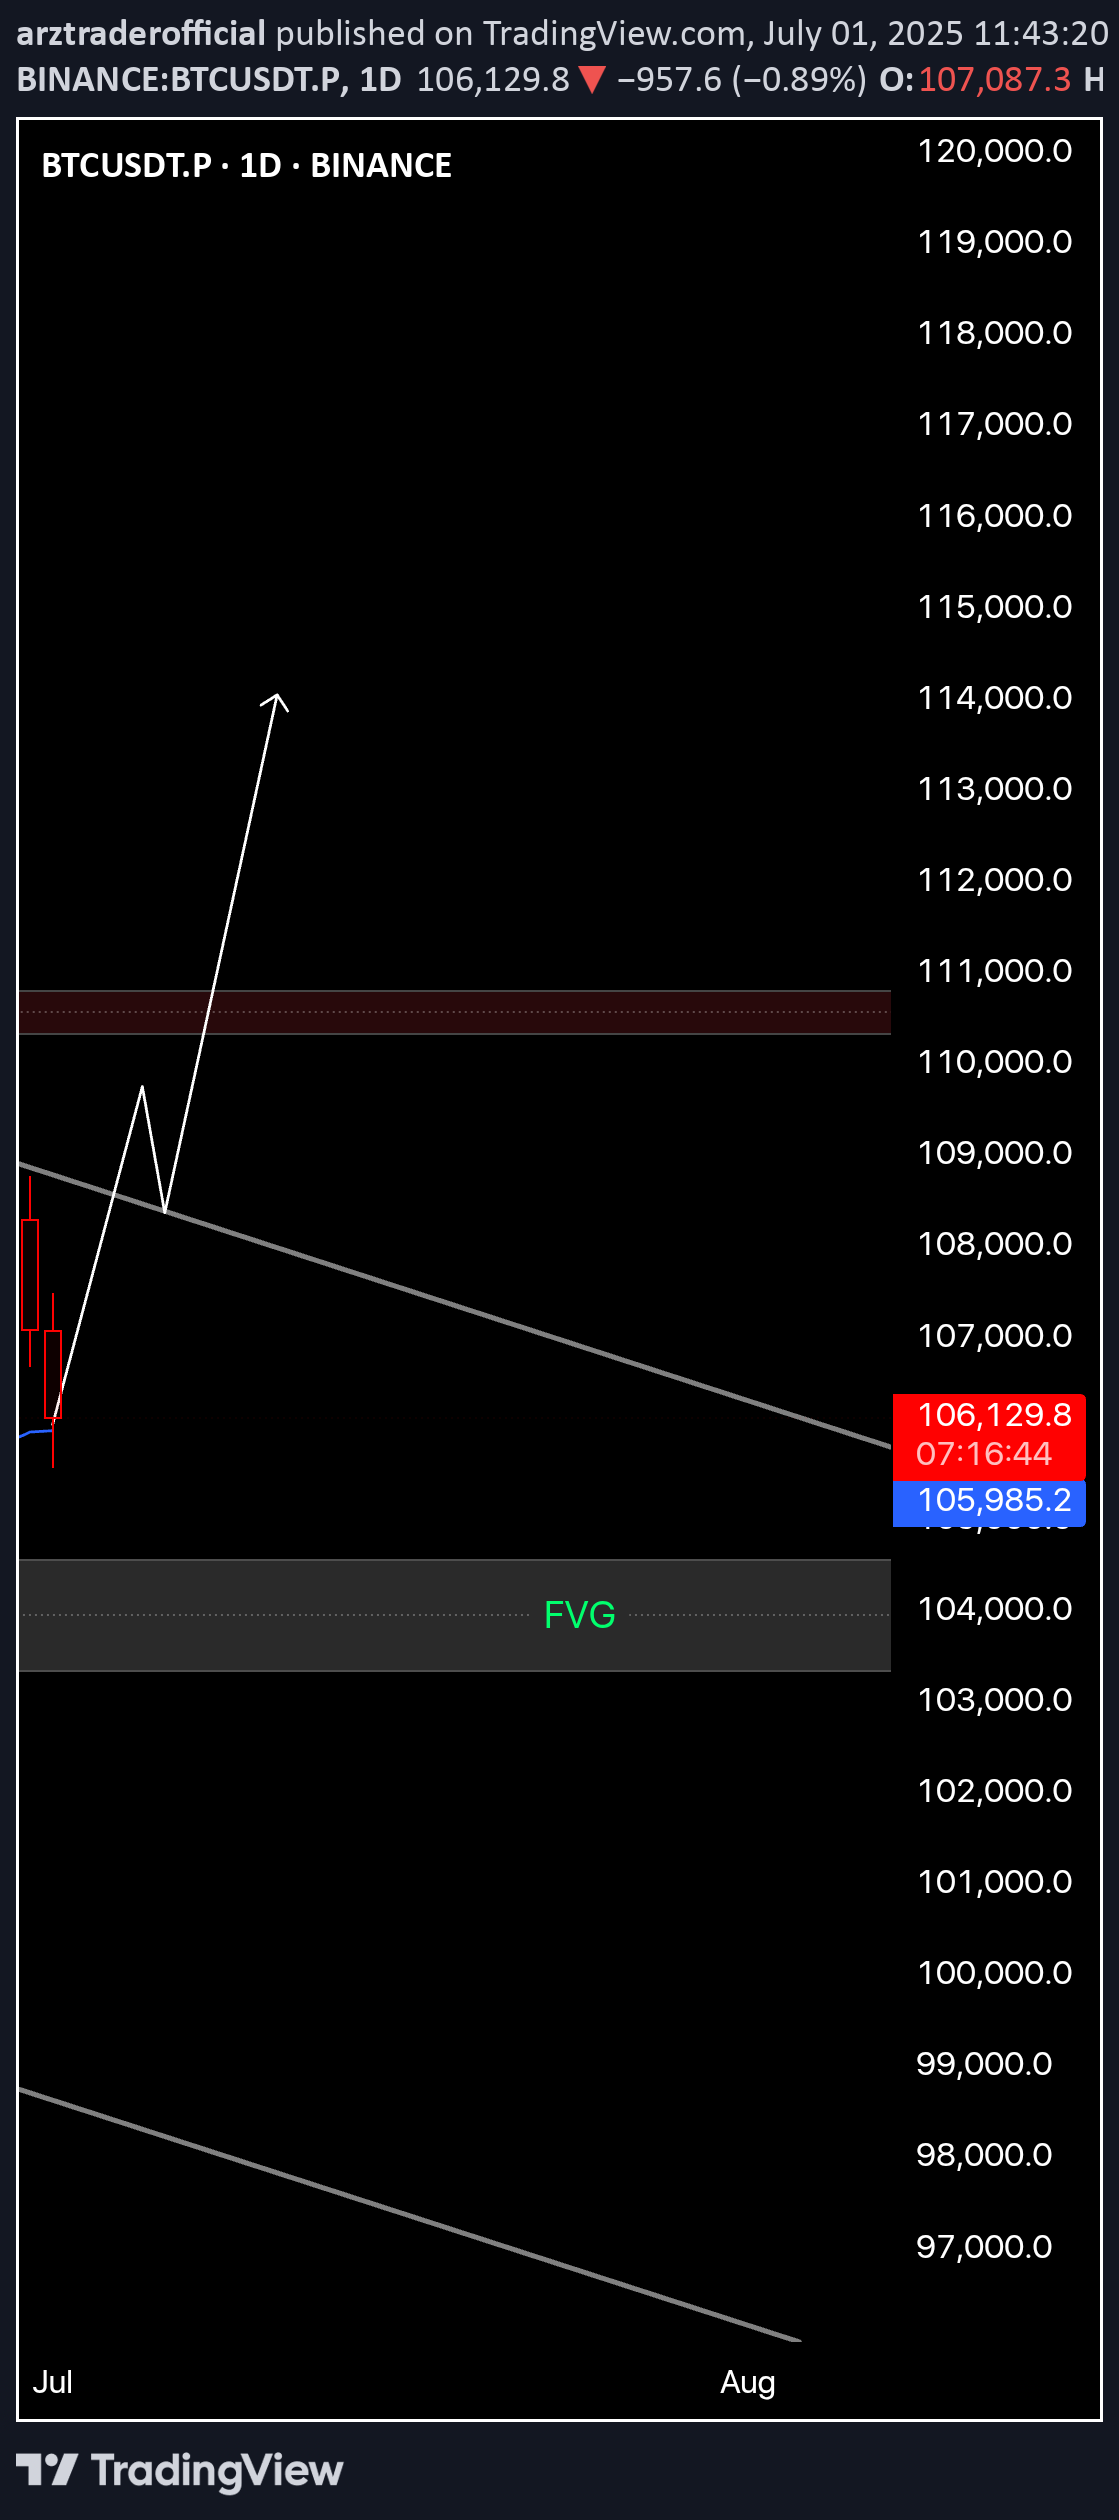
📊 BTC 1D AnalysisPrice is respecting the channel and currently holding the 21 EMA as dynamic support.If we see a strong daily close above the descending resistance, it may trigger a breakout toward the $110,000–$112,000 zone.Key levels:🔹 Support: $105,980🔹 Resistance: $110,800Bias: Bullish if breakout confirmsWatch the next 1–2 candles for confirmation.🔔 Set alerts – don’t chase!#BTC #Bitcoin #CryptoAnalysis #TradingView #CryptoSignals #DYOR
arztraderofficial
ETH 1D Analysis – Eyes on the 21EMA
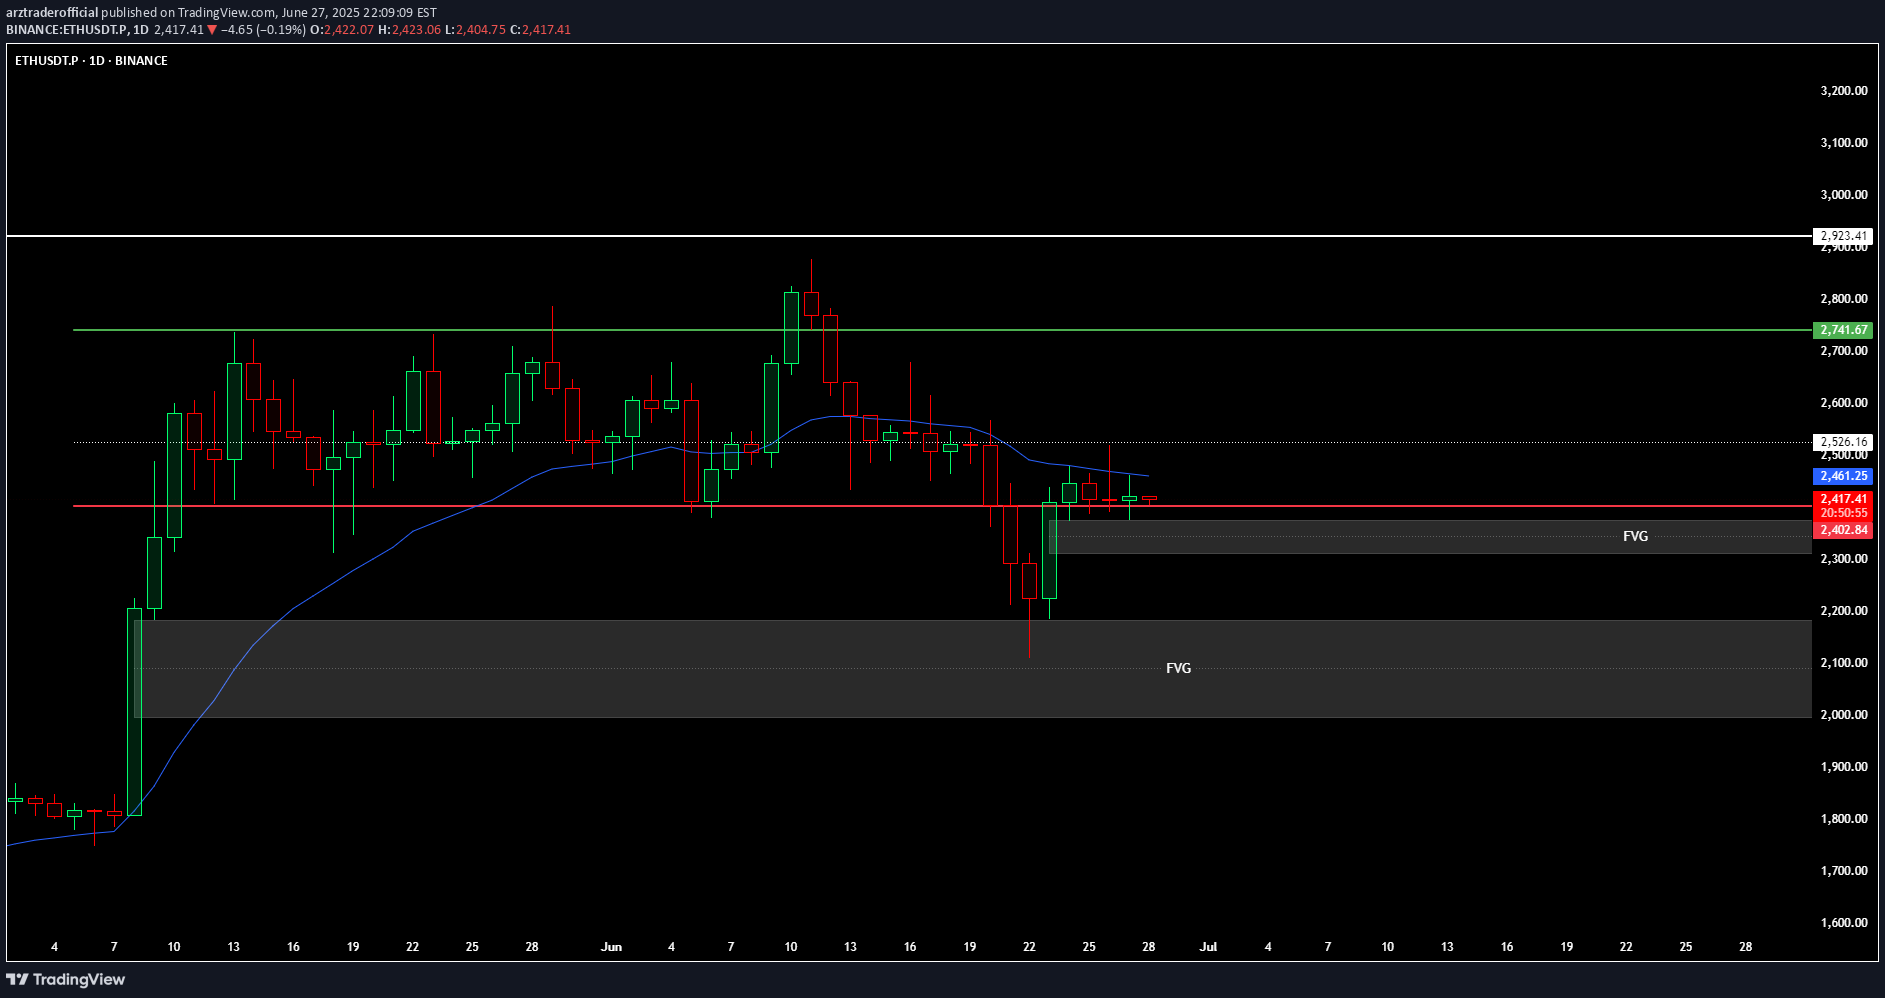
ETH is currently hovering near $2,420, right above the key support at $2,415. Price is trying to reclaim the 21 EMA, which is crucial for bullish momentum.🔹 Two Fair Value Gaps (FVGs) acting as demand zones🔹 Daily close above 21 EMA = strong bounce expected🔹 First major resistance at $2,740🔹 Breakout could trigger a rally toward the $2,900+ zoneBias: Bullish if reclaim confirmed📌 Watch daily close – reaction from this level is keyNFA | DYOR#ETH #Ethereum #Altcoins #Crypto #FVG #21EMA
arztraderofficial
BTC 120K READY ???
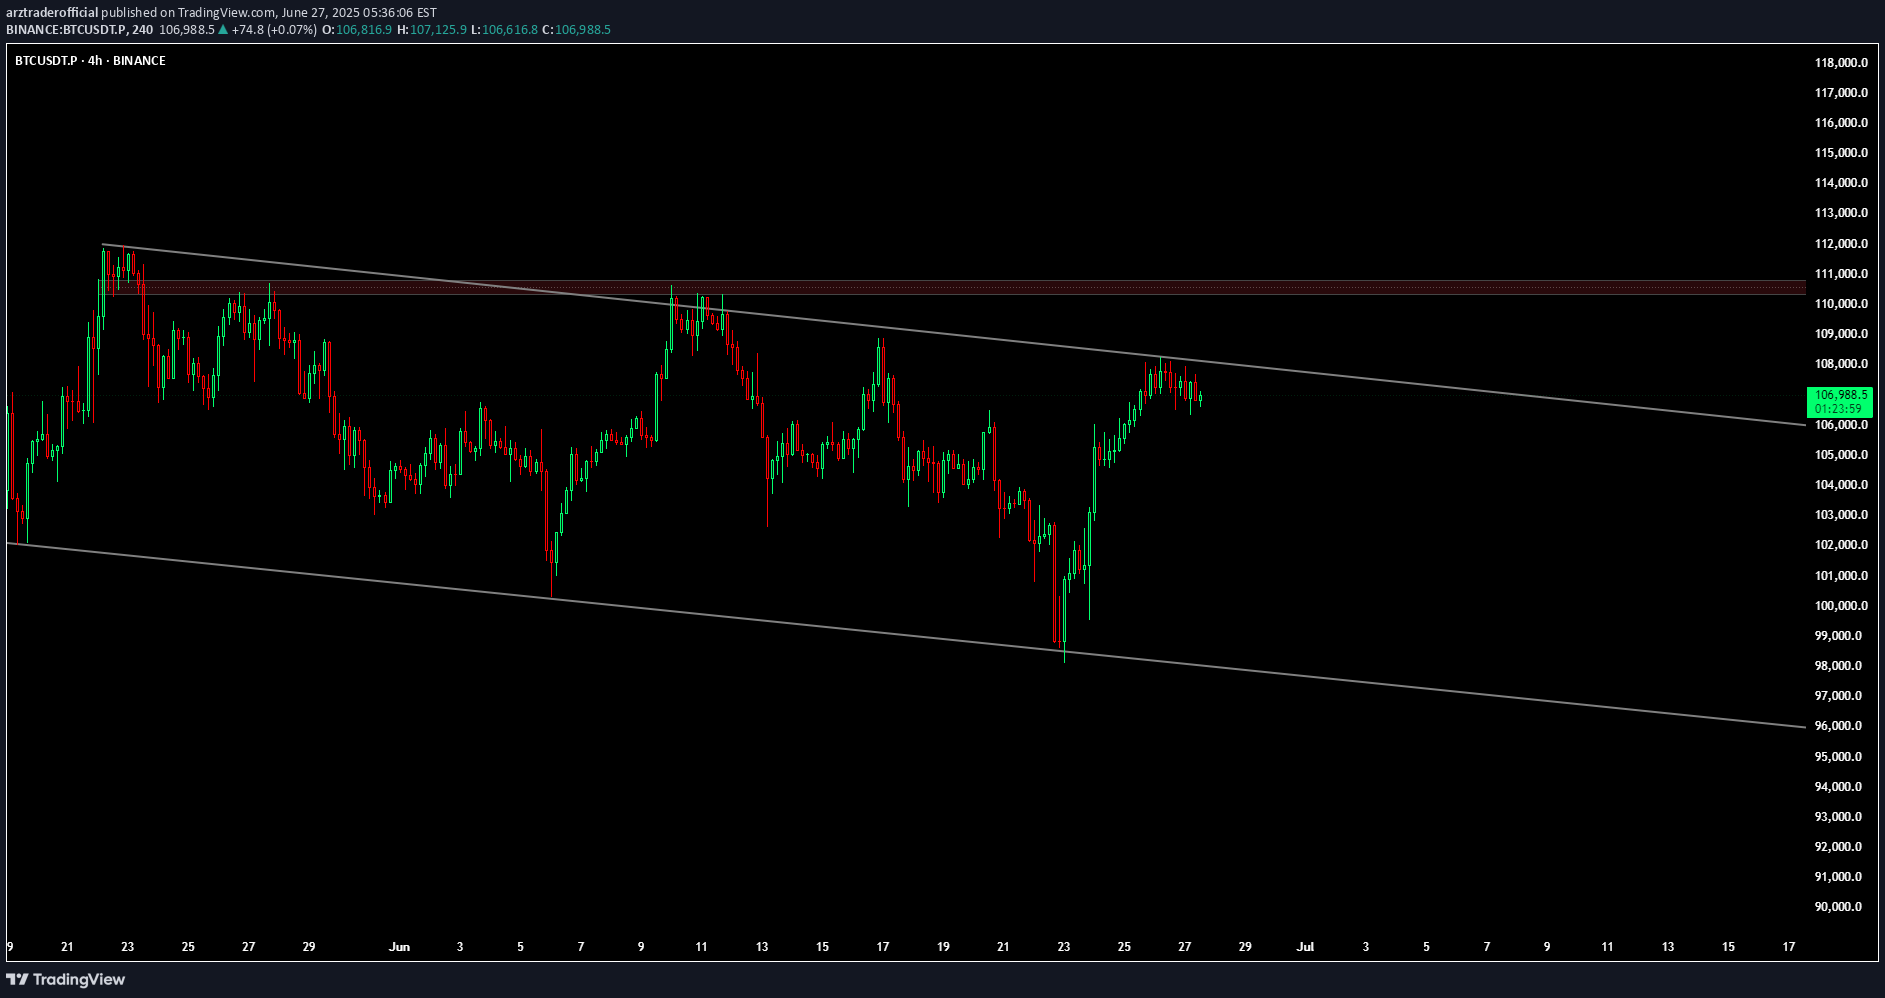
BTC 4H Chart Update 📉📈Bitcoin is still trading inside a descending channel, but bulls are now testing the upper trendline for a potential breakout.Price is consolidating just below $107K, showing strength after the recent bounce from the bottom of the channel.🔹 Structure: Descending Channel🔹 Current Resistance: $107K–$110K zone🔹 Break & close above = bullish breakout confirmation🔹 If breakout and close above 110k than this target possible🔹 Target after breakout: $112K-120K+⚠️ Rejection = pullback likely toward $103K–$104K support📊 Breakout or breakdown — decision time is near!#BTC #Bitcoin #Crypto #TechnicalAnalysis #BreakoutSetup
arztraderofficial
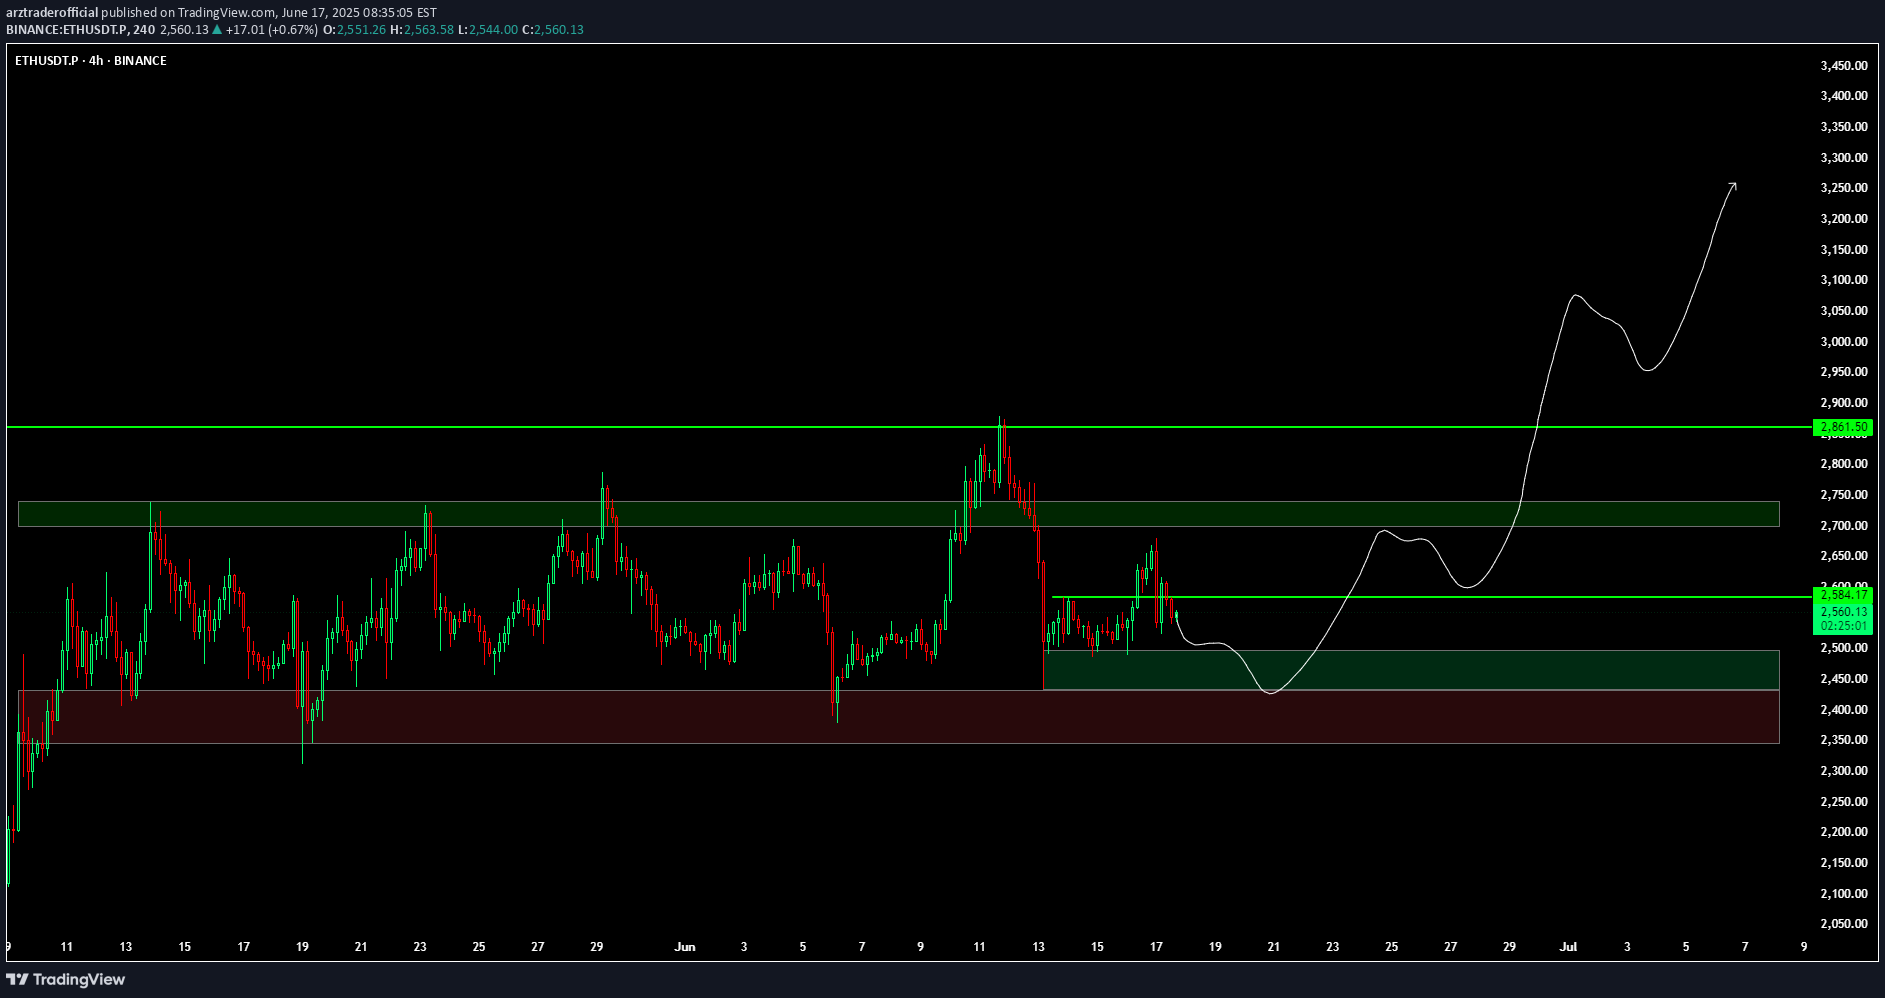
ETH READY TO GO 3000$ ???

🔍 ETH/USDT Analysis – Daily TimeframeETH is currently trading at $2,427, holding above the key support zone around $2,370 - $2,390, which is aligned with the 100 EMA. This zone has acted as a strong accumulation area.📈 Market Structure:Price is consolidating inside a horizontal range. A confirmed breakout above the resistance zone ($2,650 - $2,700) could lead to a bullish continuation towards the major resistance at $2,861.📊 Technical Outlook:Trend: Sideways range (accumulation phase)100 EMA: Acting as dynamic supportBreakout Potential: Bullish continuation expected on breakout and retest📌 Trade Plan (Not Financial Advice):Entry Idea: Break and close above $2,700 zoneTarget: $2,861 and higherInvalidation: Daily candle close below $2,370ETH is building strength above its 100 EMA. A breakout from this range can trigger a fresh bullish leg.🔁 Like & share your opinion! Always DYOR before trading.
arztraderofficial
$RPL 4H Analysis

RPL 4H Analysis 🔥RPL is currently trading at the lower boundary of a parallel ascending channel, which has acted as strong support multiple times in the past. The price action shows a clear higher high, higher low structure, indicating an ongoing uptrend.Currently, the price is hovering around the key horizontal demand zone ($5.5–$5.8). This level has previously acted as a launchpad for aggressive bullish moves, and we are seeing early signs of accumulation again.Bullish Scenario:If the support holds, RPL is likely to retest the midline of the channel around $7, followed by a potential breakout toward the upper trendline near $9 – $9.5.The risk/reward setup here is highly favorable for swing traders.What to watch:Hold above $5.5 = bullish continuation likely 🚀Break below $5.5 = invalidation of structure ⚠️📈 Conclusion:Structure remains bullish. This is a textbook channel bounce setup with targets of $7 → $8.5 → $9.5 if momentum kicks in. Volume confirmation will be key.#RPL #RocketPool #CryptoTrading #Altcoins #BreakoutSetup #TechnicalAnalysis
arztraderofficial
BTC 4H Analysis
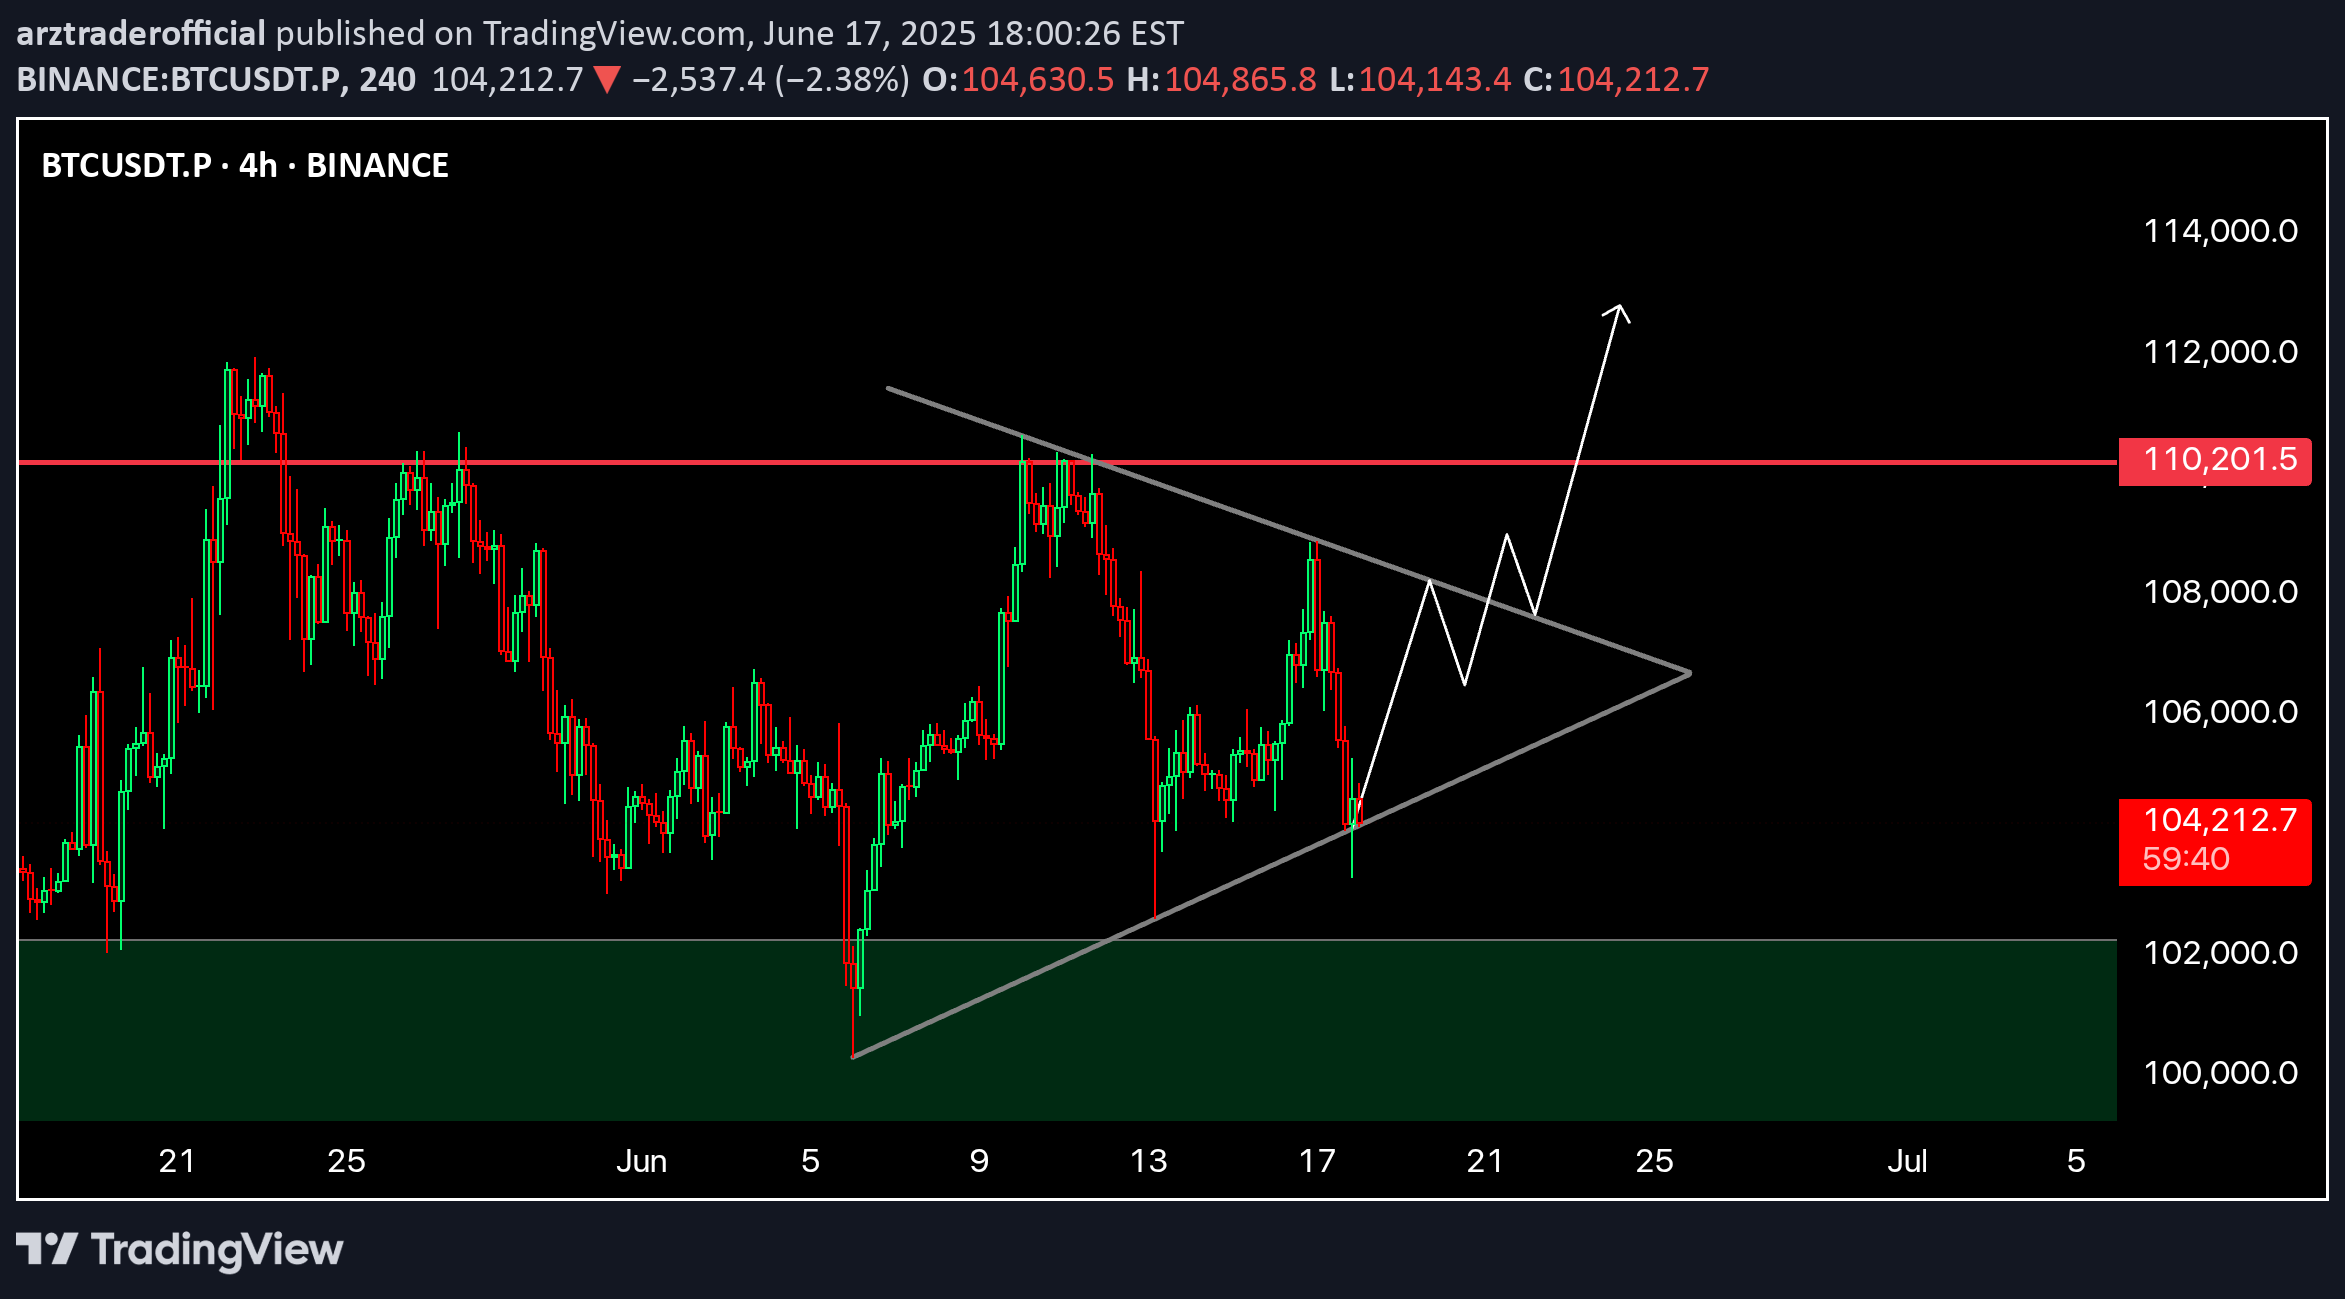
📈 BTC 4H Analysis – Symmetrical Triangle Breakout LoadingBitcoin is currently consolidating inside a Symmetrical Triangle, forming higher lows and lower highs – a classic sign of volatility compression.🔹 Structure: Symmetrical Triangle🔹 Support Holding Strong – bulls defending the zone🔹 Breakout Expected Soon🔹 Major Resistance: $110,200🔹 Breakout Target: $112,000+Price is coiling up. Break above the triangle = strong bullish continuation likely.🚀 Eyes on breakout — next move could be explosive!NFA | DYOR
arztraderofficial
ETH READY TO 3000$ ???
YES eth just about his support level eth can test from here 2450 than possible we can go 3k if iran or isreal war stop and at 18 june also here fomc meating where news about rate cut if not rate cut than possible market dump from here and btc or eth badly if rate cut done than also possible dump to liqudite longer for more deatile check bio thanks for watching
arztraderofficial
ETHFI READY TO GO 2$ ???

ETHFIUSDT.P ETHFI froming bull sanerio expecting soon in short term ethfi give us 50% to 60% gain for perfect level check chart in tradingview 4h tf as or ETH also bullish when eth go 3000 than ethfi easy touch 2$ you can check my new tweet on x for entry or exit NFA tweet handle @TradeWithARZfor more updated or free signals search on telegram @TradeWithARZ or link in bio thanks for like what is your point of view on ETHFI comment
arztraderofficial
ETH UPDATE

🛡️ Ethereum Holds the Line — Critical Support Zone Tested AgainBecause Ethereum has plummeted over 14% since Wednesday, traders and long-term holders are worried. Bullish investors expected ETH to break over $3,000 and confirm a wider cryptocurrency rise days earlier.However, global turmoil has slowed markets. Israel's assaults on Iran and retaliations shook global markets on Thursday, causing crypto asset volatility and risk-off.Historical trends between August 2021 and early 2024 suggest that keeping $2,500 has led to rallies reaching $4,000. Rekt believes Ethereum must maintain consistency around this zone to prevent a deeper retreat and maintain bullish momentum.ETH has held $2,500 over five weeks, proving its stability despite numerous testing. In the weeks ahead, altcoins and the crypto market will depend on whether Ethereum can maintain this footing again.Ethereum fell sharply from $2,830 this week to $2,556. On the daily chart, ETH has been rangebound between $2,500 and $2,830 for weeks. Ethereum has held above the 50-day and 100-day moving averages, which are rising, despite international threats.The red 200-day moving average at $2,642 has provided resistance. A retracement followed ETH's short break above this level, which it failed to keep. Recent volumes have increased due to heightened attention and emotive price responses in the Israel-Iran conflict.The $2,500–$2,520 support zone is important. This region has been a floor before and might rocket bulls if they recover control. A clear fall below $2,500 might turn sentiment negative and lead to $2,300.
arztraderofficial
Bitcoin Sentiment Slips Below Neutral As Price Hovers Near $105K

Bitcoin sentiment drops to 46.1% as market shows hesitation despite price rebound.Trading volume remains flat, weakening support for BTC’s move above $105K.Sentiment must exceed 60% with rising open interest to avoid retest of $102K support level.According to the latest Advanced Sentiment Index data, Bitcoin sentiment has weakened despite the asset making a small recovery. As of June 13, the index recorded a reading of 46.1%, falling below the neutral 50% mark. This shift indicates a cautious market environment where investors remain hesitant to drive further gains without stronger confirmation signals. While Bitcoin has rebounded from recent lows, sentiment metrics and trading volume suggest limited conviction behind the price move.According to the Bitcoin Advanced Sentiment Index, the current reading has fallen to approximately 46% just below the neutral 50% threshold. The chart shows that after bullish sentiment peaked above 80% in early June, the index has gradually declined; despite the recent TELEGRAM /(@TradeWithARZ) June 14, 2025Data from the Advanced Sentiment Index shows that market optimism peaked above 80% in early June but has steadily declined since. The chart, tracking activity from May 16 to June 13, shows that sentiment dropped below 20% on multiple occasions, including June 5 and June 13, both aligning with short-term declines in Bitcoin’s price. Although the asset has since bounced back from those levels, investor confidence remains subdued.The bell curve model used in the chart emphasizes that the majority of sentiment readings have clustered between 40% and 65%, showing a lack of extreme bullish or bearish positions. This distribution suggests uncertainty, as traders hesitate to take strong directional bets.Recent price action within the $103,000 -$105,000 area has, however, not been accompanied by new volume inflow as net buy volume and volume delta show almost no change. The stagnation of these indicators suggests that the market participants did not support the rise to a sufficient degree.Price Volatility Contains Within Narrow RangeAccording to CoinMarketCap, Bitcoin was trading at $104,950.96 at the time of writing, reflecting a 0.31% decrease over the past 24 hours. The price surged above $106,000 but faced resistance and returned to a tighter trading band. A major dip occurred around 6 PM on June 13, followed by a rebound during the early hours of June 14. Despite these fluctuations, the asset has not broken out of its recent consolidation pattern. Source: CoinMarketCapThe volume-to-market cap ratio over the last 24 hours is 2.38%, which indicates moderate trade. The total circulating supply of bitcoin has now grown to 19.87 million BTC and is getting ever closer to the protocol-imposed limit of 21 million. Despite the stability seen in price action, analysts are monitoring bigger signs before calling a directional change.According to analysts, the sentiment index needs to exceed 6065 percent to validate a sustainable uptrend. An increase in open interest and net taker volume is unlikely to achieve that level. In the absence of those conditions, the market is vulnerable to retesting lower support areas between $102,000 and $103,000.
Disclaimer
Any content and materials included in Sahmeto's website and official communication channels are a compilation of personal opinions and analyses and are not binding. They do not constitute any recommendation for buying, selling, entering or exiting the stock market and cryptocurrency market. Also, all news and analyses included in the website and channels are merely republished information from official and unofficial domestic and foreign sources, and it is obvious that users of the said content are responsible for following up and ensuring the authenticity and accuracy of the materials. Therefore, while disclaiming responsibility, it is declared that the responsibility for any decision-making, action, and potential profit and loss in the capital market and cryptocurrency market lies with the trader.