
ama-Beeps
@t_ama-Beeps

What symbols does the trader recommend buying?
Purchase History
پیام های تریدر
Filter
ama-Beeps
آمادهسازی ترید سویینگ بیت کوین: راز صبر و دقت برای سود بالا

Good trades don’t come every day — but high-quality trades are worth waiting for. Planning > Patience > Precision From a higher-timeframe perspective, price is currently in a corrective phase, and a move toward the 38% Fibonacci retracement remains a high-probability expectation once the correction completes. I have been tracking this setup for nearly a month. While an entry is technically possible at current levels, I am deliberately waiting for a more precise entry to achieve a better risk-to-reward profile. Without a high R:R, I have no interest in taking a swing position. The 86,863 level stands out as a well-defined support zone. As long as this level holds, the probability favors a continuation toward 95,835. This remains a high-quality setup, based on my experience and strict trade-selection criteria. I trade swings selectively. While I remain active on lower timeframes, higher-timeframe trades must meet a much higher standard. If conditions are not optimal, waiting is the correct decision. On the 4H chart, price has already initiated a corrective structure. Whether sooner or later, a test of the 38% Fibonacci level remains likely. Even if the setup is delayed or temporarily invalidated, the broader structure suggests this level will be revisited in the coming weeks. Additionally, price action has clearly changed character: The prior bearish trend has been broken A successful retest has already occurred Candle behavior confirms a shift in market structure This setup is not about prediction — it is about location, confirmation, and patience.
ama-Beeps
سیگنال خرید طلایی بیت کوین (BTCUSDT): پتانسیل رشد تا 107,000 با ریسک به ریوارد عالی!
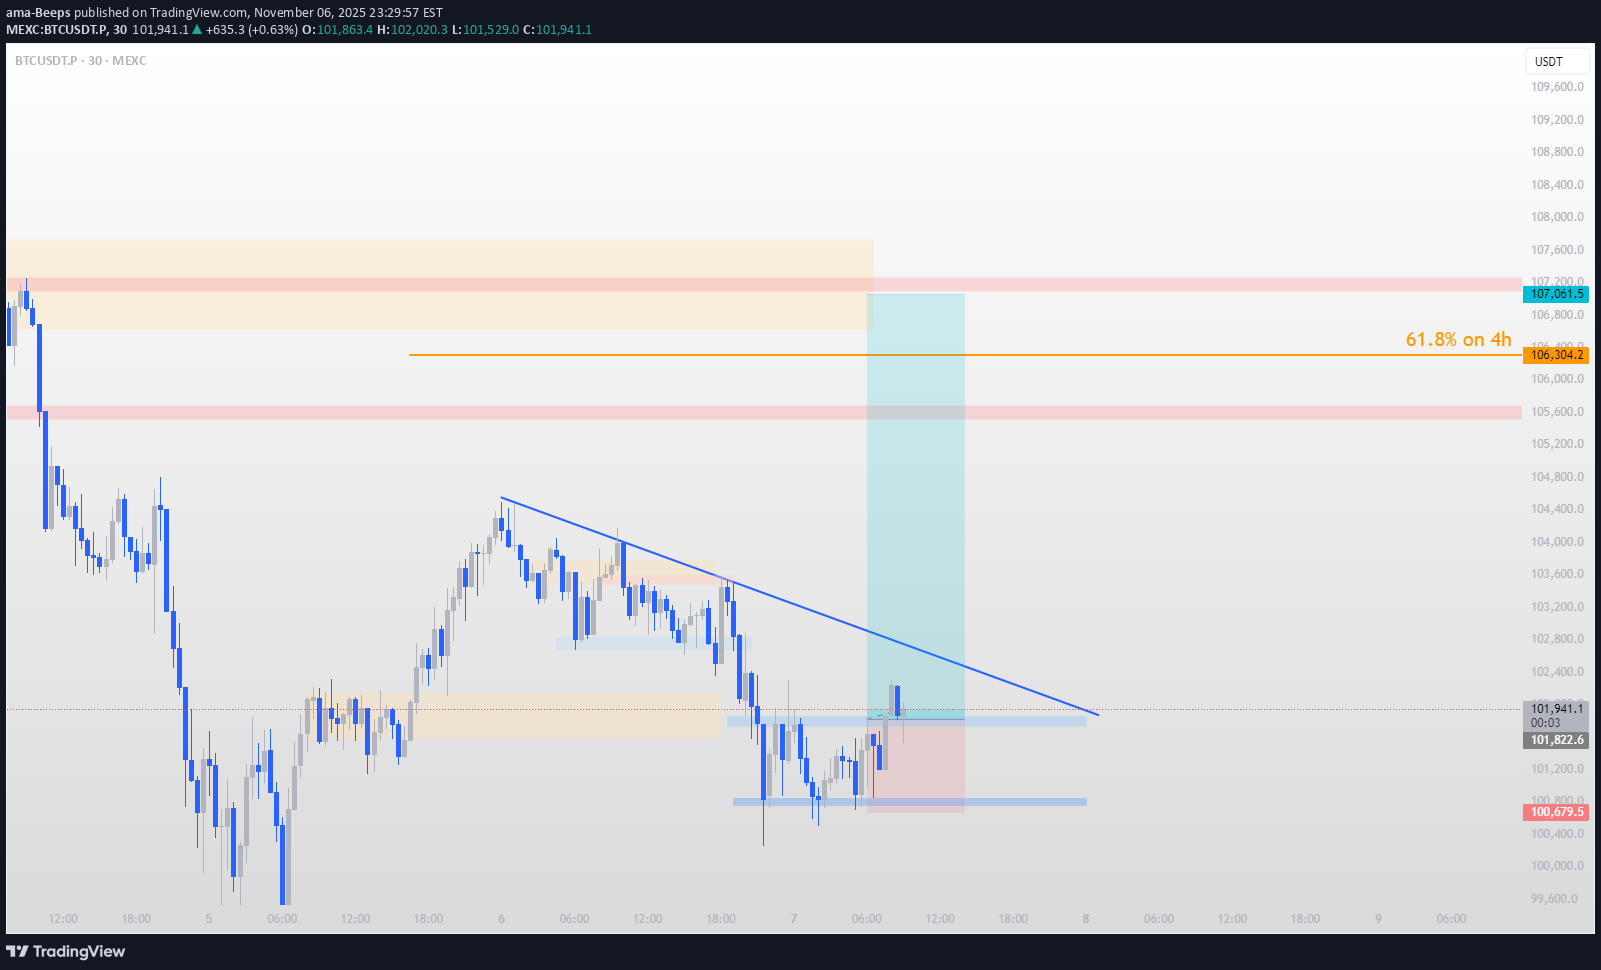
🟢 BTCUSDT Long Setup (30m Chart) Pair: BTC/USDT Timeframe: 30 Minutes 📊 Technical Overview Structure: Descending triangle breakout attempt Key Support Zone: 100,600 – 100,800 Breakout Confirmation: Clean candle close above descending trendline (~101,800) Target Zone: 106,300 – 107,000 Includes 61.8% Fibonacci retracement (4H) at 106,304 Major liquidity cluster & prior supply zone above 107K 🎯 Trade Plan ParameterValue EntryAbove 101,800 (trendline breakout confirmation) Stop LossBelow 100,600 (structure invalidation) Take Profit106,300 – 107,000 RRR (Risk:Reward)≈ 1:4 🧠 Bias & Confluence 61.8% retracement aligns with prior supply zone → likely liquidity magnet Breakout from compression structure (descending triangle) signals possible relief rally Bullish reaction from demand zone + reclaim of minor liquidity lows ⚠️ Risk Note Watch for fakeouts near trendline — confirm with volume or 15m candle close A failure to hold 100,600 could invite deeper retracement toward 99,500–99,000 zone
ama-Beeps
سولانا در آستانه انفجار: مثلث انباشت و خیز بلندتر از همیشه!

SOLANA (SOL/USDT) – Preparing for the Explosion 💥 Solana is gearing up for a major breakout. It has tapped the resistance line four times, showing strong testing pressure on the upper trendline — and has now pulled back for a healthy correction. The structure has formed a perfect symmetrical triangle, indicating strong accumulation before the next explosive move. When momentum builds, a decisive breakout above resistance is highly likely — potentially setting the stage for a new all-time high. This setup is independent of Bitcoin’s current price movement. Many BTC holders have already taken profits — and if liquidity flows into SOL, we could see the momentum intensify dramatically. I also have other technical tools that support this idea, but everyone is free to use their own preferred tools for confirmation. 📈 Key idea: Solana is preparing for the explosion — the compression before expansion.
ama-Beeps
High-Quality ADA Long Setup (4H Chart)

🚀 High-Quality ADA Long Setup (4H Chart) This trade is forming on carefully marked zones and clear trends. 🔑 Key Highlights 1. 4H Resistance Zone Price has tapped this strong resistance zone 5 times already. The more it gets tested, the higher the probability it will break on the next attempt. 2. Entry Zone We are not entering immediately — patience is key for high R:R setups. Ideal entry lies between the 0.38 – 0.618 Fibonacci retracement levels. A high-volume cluster around the 0.5 Fib level suggests that price may pull back here before gaining upward momentum. Closely monitor this area on lower timeframes for confirmation. 3. Stop Loss (SL) A long wick below the recent bearish candle indicates it’s unlikely price revisits that level before moving up. This becomes our protective stop loss. 4. Target Zone First target is the next major resistance on the 12H / Daily chart, depending on how candles close at higher timeframes. 📊 (Chart attached for reference) ⚡️ Final Note I share one high-quality setup per week — remember, it’s the clarity of the setup that matters, not the outcome of a single trade. (I also teach how to read candlestick behavior separately.)Finally, ADA has reached our marked Buy Entry Zone. However, yesterday’s structure invalidated this setup, as ADA has shifted from bullish to bearish. Our new entry zone is aligned with the 4h Sell Target, so the focus now is to carefully monitor the lower timeframes (LTF) for a precise entry.we are very close to our New Entry markTRADE IS ACTIVE (new entry)SL movedSL moved again and 50% position closed at Take Profit (1)trade closed with 0.55% RRx in Profit
ama-Beeps
BTC Breakout Without Volume

⚠️ Watch Out – Breakout Without Volume Price is testing the resistance zone again, but look closely at the volume bars — there’s no real participation behind this move. Without strong buying volume, it’s unlikely the market can sustain a bullish breakout. Low-volume breakouts often result in false moves or quick pullbacks as there’s no fuel to keep driving price higher. I’ll be watching closely for confirmation before committing to any long positions. 📌 Quick Technical Note: In breakouts, volume is the fuel that powers price movement. A breakout backed by strong volume shows that many market participants agree with the move, adding conviction and sustainability. When volume is low, it suggests limited interest — meaning fewer buyers to keep the price climbing, increasing the probability of a reversal or retest. What do you think — is this breakout already losing steam, or do you see hidden strength here?Its happening at the moment . Low participation means risk of reversal is high, stay cautious.
ama-Beeps
SOLUSDT Short Setup – Targeting Key Demand Zones

Content: Price has retested the supply zone and shown rejection, forming a descending structure on the 15m chart. My plan: Entry: After confirming break of minor support. Target 1: 178.94 (near-term demand / liquidity zone) Target 2: 173.85 (major demand zone from previous structure) Invalidation: Above the recent supply zone. This setup is based on structure break + supply zone rejection. Not financial advice — trade safe and manage risk.
ama-Beeps
AVAXUSDT – potential swing trade

with a risk factor of 2.59 Avax is ready to take an upward ride with a potential 50% fib retracement target at least. Disclaimer: Not financial advice – just sharing my market outlook. Always manage risk and do your own research before taking trades. 💡 Educational Note: For sharper precision, drop to 4H or 2H charts and identify the latest ChoCH (Change of Character) and BoS (Break of Structure) before entering. This helps align with the momentum shift and avoid premature entries.
ama-Beeps
Potential Reversal in Play – Eyes on the Breakout!

Trend Broken: The long-term downtrend has finally been broken, signaling a potential shift in market structure. Liquidity Taken: Recent price action swept the lows, grabbing liquidity before bouncing back. MACD Turning Up: Momentum is starting to build on the upside, indicating possible bullish continuation. 📍 Plan: Watching for follow-through towards the key supply zone around 0.69. 💡 Educational Note: For a more precise entry, switch to a lower timeframe (4H or 2H) and look for the most recent CHoCH (Change of Character) and BoS (Break of Structure) to align with your trade setup. Note: This is not financial advice – just sharing my personal market outlook. Always do your own research before taking any trades.
ama-Beeps
Swing Trade Setup on HNT/USDT

I’ve spotted a potential retracement play on HNT/USDT that aligns with my swing trading plan. 📊 Setup Details: Entry Zone: Near current consolidation after reclaiming local support Target 1: $5.383 (around the 38% Fibonacci retracement) Target 2: Watching closely for a potential push toward the 50.0% Fib level if momentum continues Stop Loss: $2.305 (below the lowest order block) Risk/Reward Ratio: ~4.52 ✅ 🔍 Technical Confluence: Price is bouncing from a key support zone Super Trend Bullish Fib retracement levels (50% & 61.8%) match with prior supply zones 📅 Timeframe: Swing trade (days to weeks) ⚠ Risk Note: This is not financial advice – always DYOR before entering any trade.
ama-Beeps
SOLUSDT Long Trade Setup (Waiting Since Yesterday)

SOL has retraced back to the 38% Fibonacci level on the 5-minute timeframe, showing strong potential for a bounce. On the 15-minute timeframe, we anticipate a move towards at least the 50% Fibonacci retracement level. This setup is supported by additional technical tools I’ve aligned, providing further confirmation. ⚠️ Entry is advised only if you find confluence with your own analysis. ✅ Personally, I’m comfortable entering this long setup, targeting a Risk-to-Reward ratio of at least 6.84. Happy Trading! 🚀SL moved to breakeven to mitigate the risk
Disclaimer
Any content and materials included in Sahmeto's website and official communication channels are a compilation of personal opinions and analyses and are not binding. They do not constitute any recommendation for buying, selling, entering or exiting the stock market and cryptocurrency market. Also, all news and analyses included in the website and channels are merely republished information from official and unofficial domestic and foreign sources, and it is obvious that users of the said content are responsible for following up and ensuring the authenticity and accuracy of the materials. Therefore, while disclaiming responsibility, it is declared that the responsibility for any decision-making, action, and potential profit and loss in the capital market and cryptocurrency market lies with the trader.