
altcoinb
@t_altcoinb

What symbols does the trader recommend buying?
Purchase History
پیام های تریدر
Filter
altcoinb
Kaspa 2025 possible peak PA projections
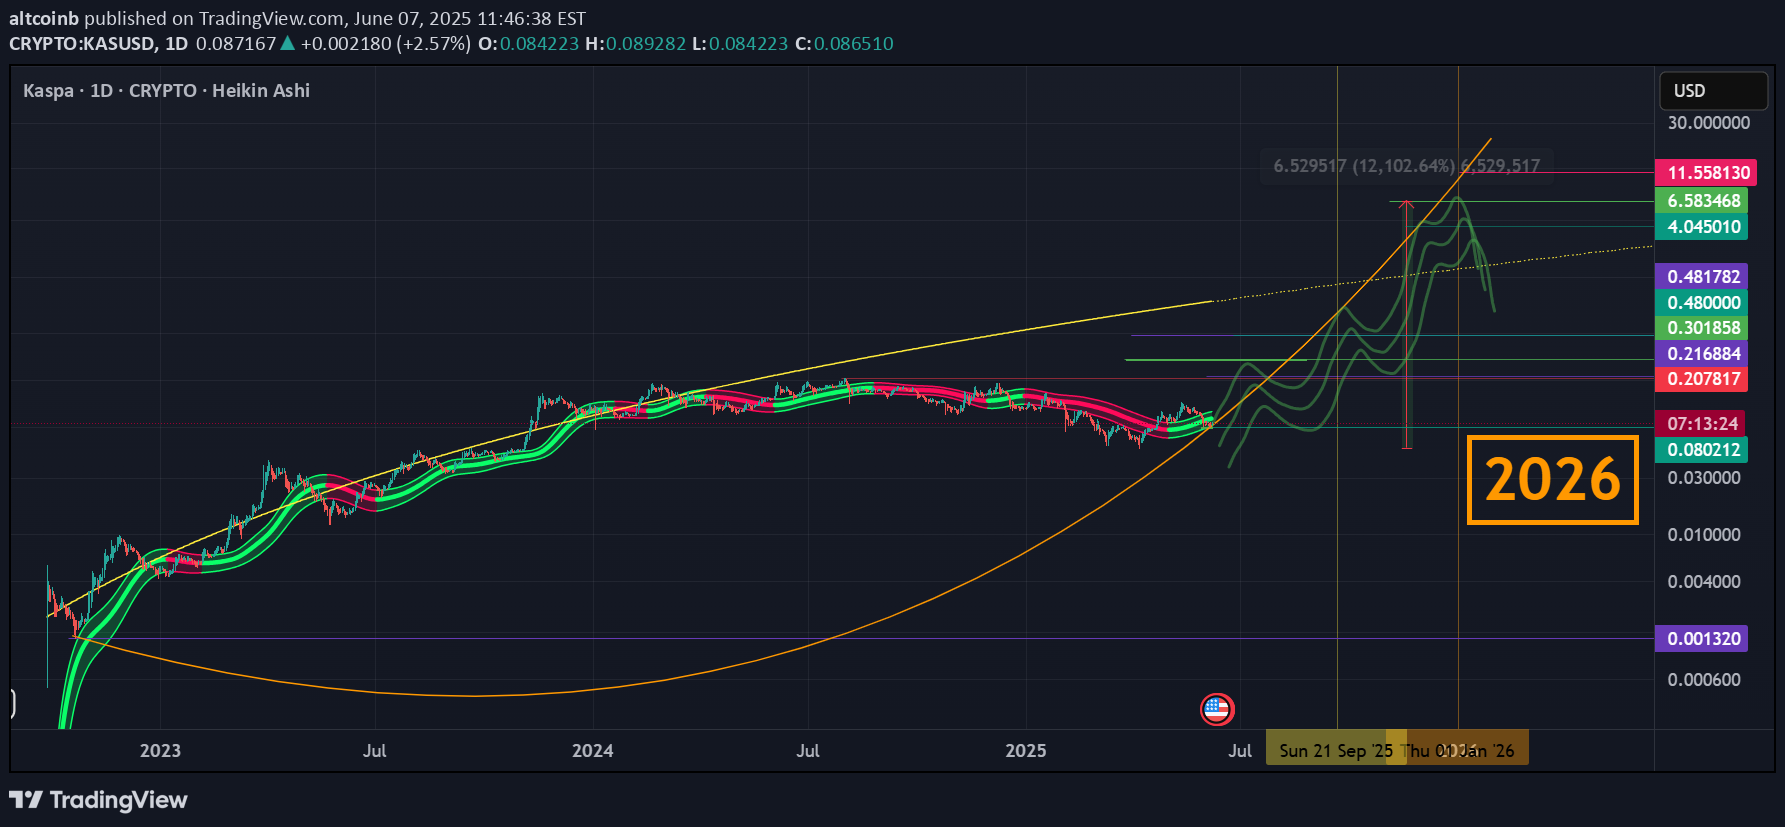
Kaspa price action has been a heated subject over the last 12 or so months and now that we are getting closer to the end of this 4 year cycle we need to delve into possible scenarios. With all the great future points coming for kaspa it is hard not to see this asset climb within the 6 months that we have until the end of year for 2025. Kaspa is about to roll out smart contracts, tier 1 exchanges like Binance, Coinbase, OKX, Robinhood and a few tier 2's for listings, stabel tokens like USDC and USDT will be coming for Kaspa this year as well. All this is very bullish along with the recent upgrade on the network moving from 1 block per second to 10 blocks per second confirmations on mainnet. It is hard not to see price action move aggressively and fast for Kaspa given all these points playing out within 6 months from current date. I have the power-law from PlanK on the daily chart and although this may not be an accurate indicator it does work well for the emmission shcedule for Kaspa. I also have a parabola from lowest point to the recent low which came after the Wycoff Distribution bottom we just had at $0.05. I have a hunch that price action will just not be a skimpy or low of $0.50 but rather much higher ranging between $1.50 to $6.42 by end of this year sometime.
altcoinb
Kaspa Wycoff Distribution for 2025

We are witnessing a possible Wycoff Distribution pattern playing out which could bring price action down to $0.048 which would also come in line with the 0.786 Fibzone. If we do not hit the 0.786 fib zone as a bottom we could find great support at the 0.05 price which was great resistance back in September and November 2023.
altcoinb
Kaspa Yin Yang pattern for 2025 target $6.42

Kaspa Yin Yang pattern for 2025 target $6.42 I am giving this post a new name for a chart pattern which I am calling the Yin Yang chart pattern. This pattern is based on the curves of the Yin Yang pattern and not really on the philosophical aspects or traits that it illustrates. I know this may sound strange and I had to try to contain the excitement over this possibility. Maybe some of you professional technical traders can enlighten me as I need it so many times when looking at the charts. What we are looking at is a Fibonacci Retracement from the high price of Kaspa on July 31st, 2024 to the high of June 3rd, 2022. On June 3rd the price of Kaspa was at $0.00062 while the price on July 31st, 2024 was at $0.20781. When we apply the fib retracement we get a fib zone of 1.618 at a price target of $6.42. The interesting thing that shocked me was I posted on X back in 2023 that Kaspa would hit a target price of $6.42 and I based this on several metrics on mining and hash power plus price for both BTC and Kaspa which gave me this crazy $6.42 target. Today is when I decided to plot the Fibonacci zones and to my excitement the 1.618 was right on the price that I came up with back in late 2023. I wanted to share this post so that we can see if this will even happen. This is all speculative but fibonacci numbers are pretty solid targets to consider when looking into future price action.
altcoinb
Flare Networks 2025 price speculation
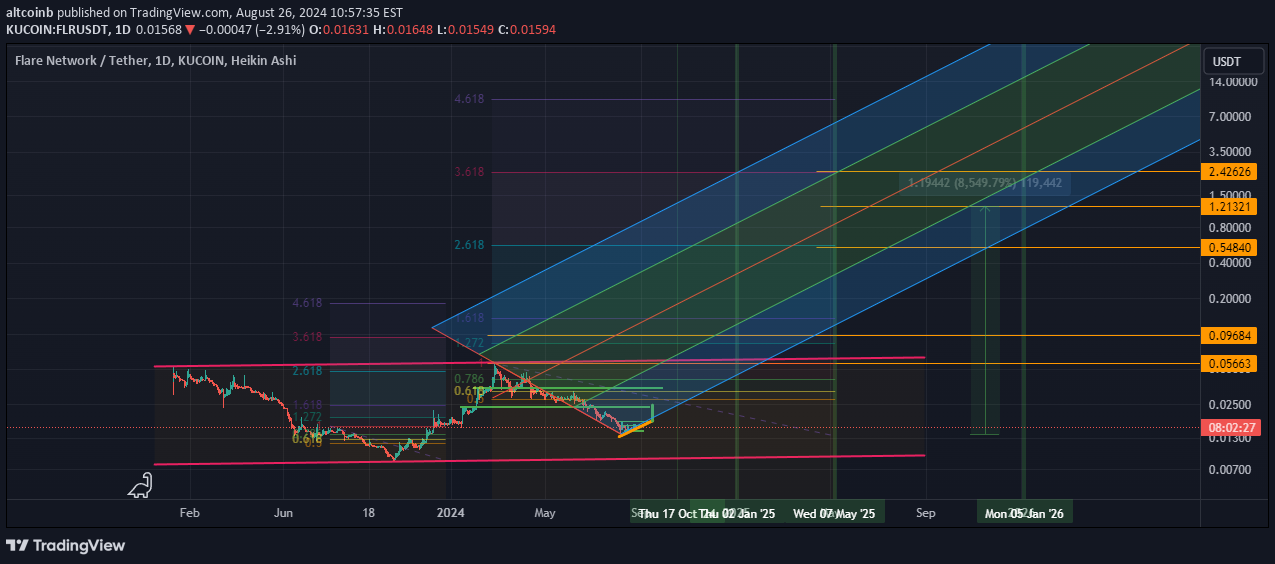
Where is Flare going to be price-wise in 2025? This pitchfork may give us some insight using the Fibonacci numbers. We could see price action between $0.54 and over $2. Let's see if Arthur Hayes knows something we don't.
altcoinb
Kaspa Speculation 2024

Just playing around here with a speculative price possibility considering some metrics provided by PlanK @MikoGenno on X.
altcoinb
Turbo respecting this curved parabola

Turbo is a growing grassroots meme token that was started as an AI with only a budget of $69 and what was meant to be a type of joke has now grown into one of the most impressive meme projects in crypto. I have noticed that every time Turbo hits a double bottom as reflected by boxes, it has a nice run to the upside and it is also respecting this curved parabola as well. Will it break this parabola, probably so at some point as nothing can continue respecting curved parabolas for an indefinite period.I also have a fractal here to show what could happen with price action if we respect this parabola.the next Fibonacci target could be at the 1.618 for a price action of $0.01465 or at least the previous high of $0.0098. If we see a push above the 1.618 then the 2.618 Fibonacci level at price $0.0393 could be a possibility.
altcoinb
Kaspa breakout before November 2024

We are seeing incredible pressure being built here for a price action move to the upside with Kaspa. The Fibonacci zone for this could be at 2.618 at a price range of about $0.50 ish. I am giving this a time frame before November 2024. There is an ascending channel that Kaspa is dying to break out of and most likely the upside. Too many bullish points that Kaspa is waiting on and these fundamentals could help propel price action higher. For example, Tier 1 listings, Krc20 launch, 10 BPS implementation, Kaspa Institutional Initiative KII, Kaspa Ecosystem Foundation KEF, and more like Marathon competitors coming in to take mining market share etc.......
altcoinb
Kaspa a case for $0.51 in August 2024

As you can see we the Beam Band and every so many months we hit right below the top of this Beam Band a certain percentage and seems likely that Kaspa could be gearing up for another peak run given its consistency in previous months. I have a yellow parabola curving into this peak area along with a fractal to help see what is about to happen. Also, we do have the Power Law (thanks to @mikogenno and Plan K on X and youtube) that shows us the possible fair value into the future. If we project the same type peak run we could see price action at $0.51
altcoinb
Kaspa targets for next high 2024
thank God we have people in our #kaspa KAS community like @MikoGenno @Cryptographur & siamkidd who give us some of the best TA known to man on this new and explosive asset that is literally taking the digital crypto space by storm. I am beginning to see more consistant patterns as was mentioned in the lates video by @Cryptographur and @MikoGenno on the similar time patterns that we see with #Kaspa $Kas. 1) I am blown away how we can see a similar time distance between each high 2) We can also see each consecutive high with a similar percentage increase but somewhat diminishing as we go higher. 3) by plotting these distances and percentages we can almost get a position on the next high. I think that with high probability, considering the time we have spent in accumulation, we could see #kaspa hit our next target between the dates June 17th and July 10th with a target between $0.51 & $0.59 Of course, all this is not financial advice and always please do your due diligence and research.
altcoinb
Kaspa price action for September 2024

Based on the Pi Cycle Top Indicator I am calling for a $1.16 price for Kaspa by end of September 2024. I am basing this using the Pi Cycle Top Indicator which is an amazing metric that predicts the peaks on BTC and since Kaspa follows BTC in both a macro and micro position I thought why not use the Pi Cycle Top on Kaspa as well. There are other metrics used here and just keep in mind that all this is highly speculative but interesting as ascending channels and fibonacci levels help pinpoint possible price action.
Disclaimer
Any content and materials included in Sahmeto's website and official communication channels are a compilation of personal opinions and analyses and are not binding. They do not constitute any recommendation for buying, selling, entering or exiting the stock market and cryptocurrency market. Also, all news and analyses included in the website and channels are merely republished information from official and unofficial domestic and foreign sources, and it is obvious that users of the said content are responsible for following up and ensuring the authenticity and accuracy of the materials. Therefore, while disclaiming responsibility, it is declared that the responsibility for any decision-making, action, and potential profit and loss in the capital market and cryptocurrency market lies with the trader.