
aljawadri
@t_aljawadri

What symbols does the trader recommend buying?
Purchase History
پیام های تریدر
Filter
aljawadri
حرکت بعدی ریپل (XRP): آیا سقف مقاومت شکسته میشود یا کف حمایتی فرو میریزد؟

this chart for XRP shows us two main lines: A: Resistance Line): XRP has been trying to go higher since July, but it keeps hitting a sloped ceiling and bouncing back down. It's hitting that ceiling again right now. B: (Support Zone): There's a strong floor below XRP where it usually finds buyers and stops falling. What could happen next? Go Up (Bullish): If XRP can break through that ceiling it's hitting now and stay above it, it could start moving much higher, maybe towards $12, $13, or even $14. Go Down (Bearish): If it fails to break the ceiling and instead breaks below its strong floor, it could fall lower, maybe towards $9 or even $8. Right now, XRP is at a very important spot. The next few days will likely show us if it's going to break up or break down. It's like a coiled spring, ready to jump one way or the other!
aljawadri
XRP Price is Squeezing: Get Ready for a Big Move

The daily price chart for XRP against the US Dollar shows that the price has been getting squeezed into a tight triangle shape over the last two months. This usually happens when buyers and sellers can't agree, and the price gets stuck. What's Important to Know The Big Squeeze: The price is hitting lower highs and higher lows, making the trading range smaller and smaller. This setup means a major price change is coming soon! The Safety Line: The price keeps bouncing off a very important support level near $2.80. Think of this as the floor. As long as the price stays above it, things look okay. Decision Time: Because the triangle is almost closed, we expect the price to break out either up or down around late October/early November. What to Watch For If it Breaks Up: A strong move above the triangle's top line would mean the rally is back on! This could quickly send XRP toward the $3.70 to $4.00 price area. If it Breaks Down: If the price crashes below that crucial $2.80 floor, it's a big warning sign and could cause a sharp drop lower. The Bottom Line: Watch the $2.80 price level. The way the price breaks out of this tight triangle will tell us where XRP is headed for the rest of the year. Disclaimer This is not financial advice. The information provided in this analysis is for educational and informational purposes only. It should not be considered as a recommendation to buy, sell, or hold any cryptocurrency or financial instrument. Trading and investing in digital assets involves substantial risk of loss and is not suitable for every investor. You should always conduct your own research (DYOR) and consult with a qualified professional before making any investment decisions. Past performance is not indicative of future results.
aljawadri
ETH Bullish Trend
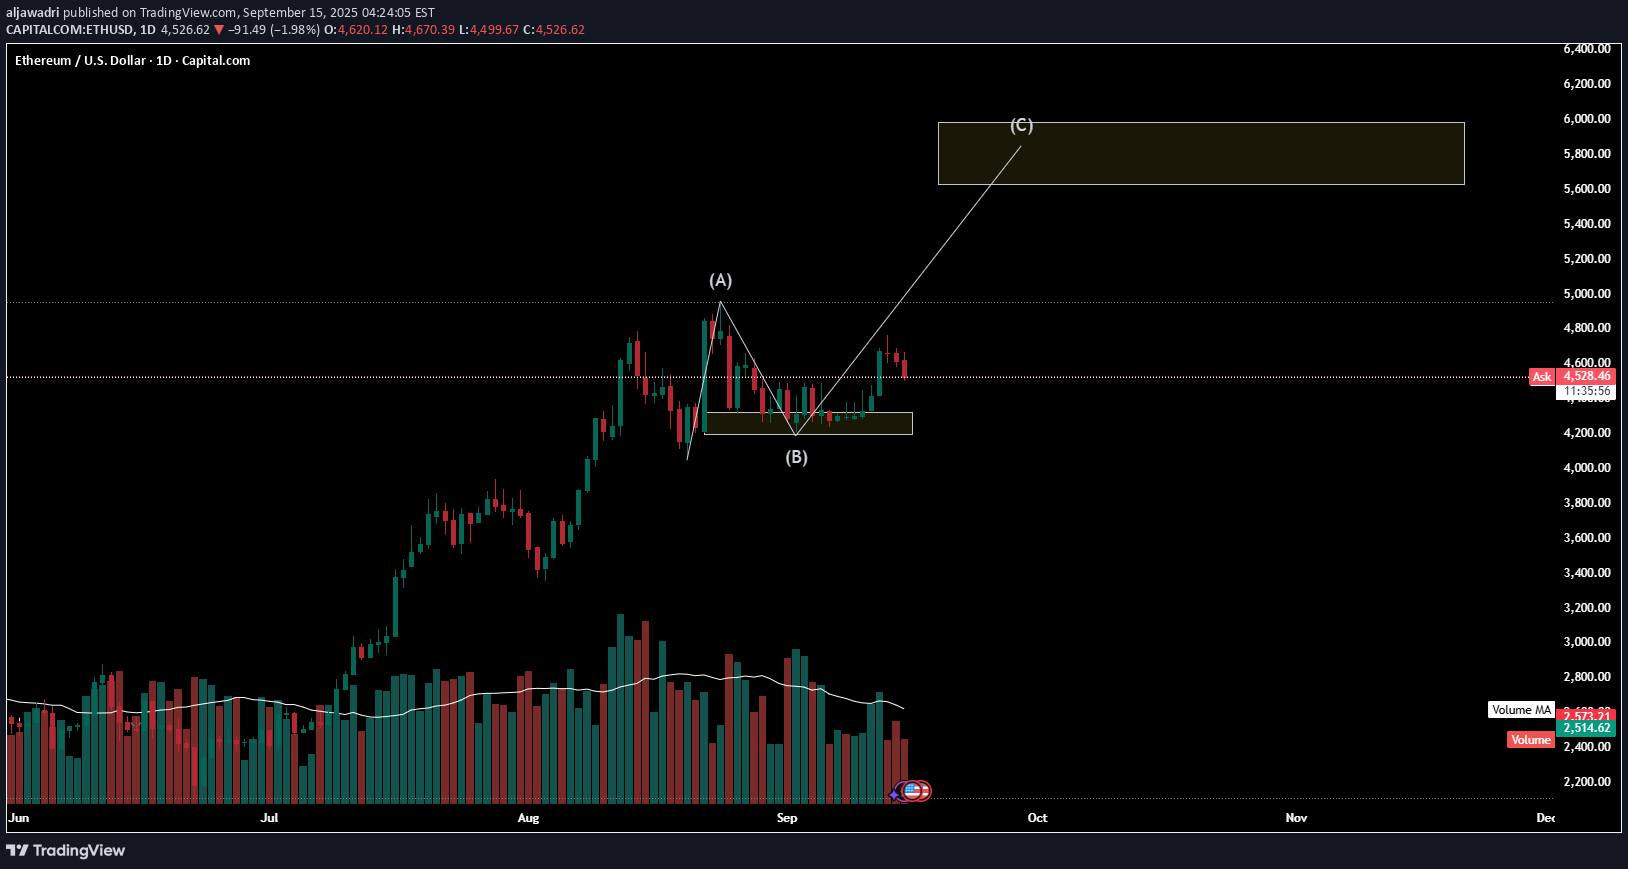
The chart shows a potential "ABC" corrective wave pattern, often seen as part of a larger bullish trend. Wave (A): The initial strong upward move from around $3,000 to over $4,800. Wave (B): A subsequent correction or consolidation phase, where the price pulled back and appears to be finding support around the $4,200 - $4,300 area (highlighted by the yellow line and the brown box). This area seems to have acted as both previous resistance and now potential support. Wave (C): If the bullish trend continues, the expectation is for a new impulse wave upward, potentially targeting the area between $5,600 and $6,000, as indicated by the white box and the projected line. This would represent a breakout above the previous high of Wave (A). In essence, the idea is: The recent pullback (Wave B) has found support, and if this support holds, the cryptocurrency could be poised for another significant upward move (Wave C) towards new highs. Please note that this is a technical analysis interpretation based on the provided chart and is not financial advice.
aljawadri
LDO forecasting

As the analytic trend of ABC correction and Fib, more likely trend going up when the price hit the "C" then going to correction to "BC" to get Entry for LONG to hit the next target.Great
aljawadri

aljawadri
Near Going Up

Near Going Up, Just waiting the correction. You can Take Entry Long In Box "BC" and stop loss 2%.Great ! target hit
aljawadri
OMG Going Up

Going Long, waiting the entry at BC as mention in chart.enjoy
Disclaimer
Any content and materials included in Sahmeto's website and official communication channels are a compilation of personal opinions and analyses and are not binding. They do not constitute any recommendation for buying, selling, entering or exiting the stock market and cryptocurrency market. Also, all news and analyses included in the website and channels are merely republished information from official and unofficial domestic and foreign sources, and it is obvious that users of the said content are responsible for following up and ensuring the authenticity and accuracy of the materials. Therefore, while disclaiming responsibility, it is declared that the responsibility for any decision-making, action, and potential profit and loss in the capital market and cryptocurrency market lies with the trader.