
alemicihan
@t_alemicihan

What symbols does the trader recommend buying?
Purchase History
پیام های تریدر
Filter
alemicihan
JASMY/USDT Price Analysis: Potential Cup and Handle Breakout
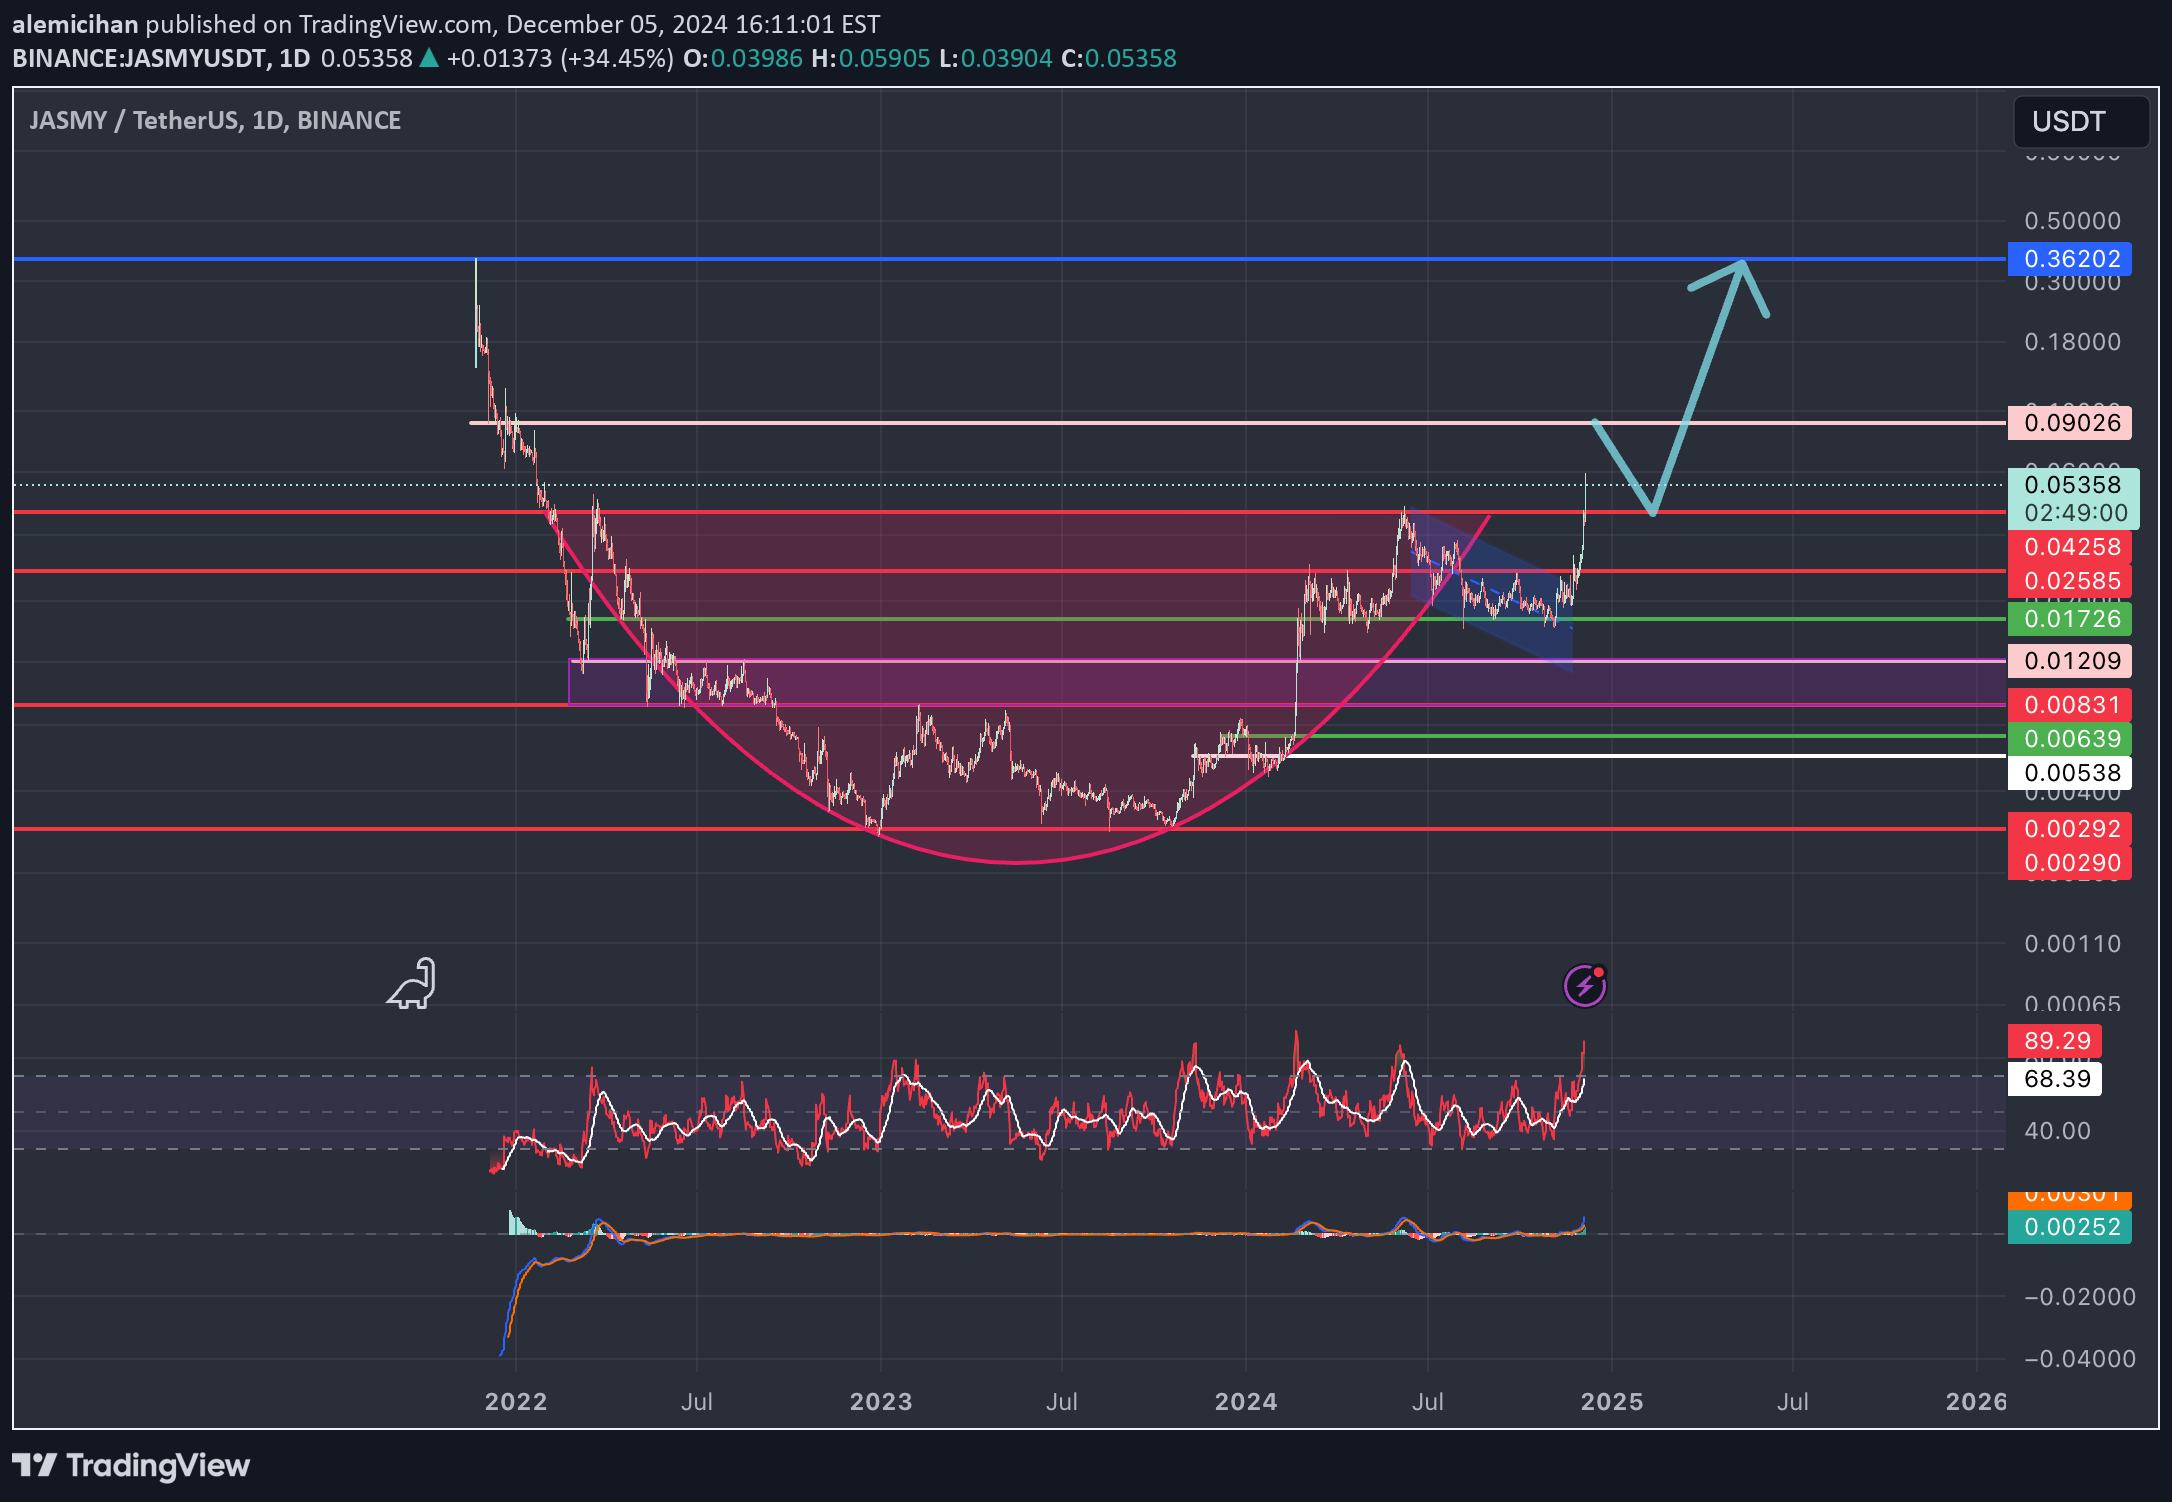
Key Highlights: Cup and Handle Formation: The pink curve represents the "cup" part of the pattern, showing a rounded bottom structure. This formation is typically considered a strong signal for a continuation of an upward trend. Fibonacci Levels: The red, green, and white horizontal lines represent significant support and resistance levels. These lines resemble Fibonacci retracement levels and indicate where the price might encounter resistance or find support. Flag/Channel Pattern: The blue highlighted narrow channel illustrates a consolidation phase, suggesting preparation for a breakout to the upside. Target Levels: The blue arrow on the chart indicates an expectation for the price to rise to the 0.09026 level first and potentially continue to the 0.36202 level in a strong bullish move. The price is currently trading at 0.05321 and seems to have broken through a previous resistance level. If the price manages to overcome the resistance levels at 0.04258 and 0.09026, this could signal the continuation of the bullish trend. However, if the price loses the support levels at 0.02585 or 0.01726, there is a risk of entering a bearish trend. From a trading strategy perspective, it may be worth considering positions above resistance levels or entries near support levels while managing risk effectively.
alemicihan
Potential Bullish Breakout for SAGA/USDT: Cup and Handle Pattern

Cup and Handle Pattern: The pink curve outlines a "Cup" formation, which is a bullish reversal pattern. This is typically formed when there is a gradual rounded bottom, followed by a breakout to the upside. The cup's depth is marked by a large percentage gain (272.58%), reflecting the potential move from the bottom of the cup to the breakout point (the green line at approximately $3.30). Price Levels: Current Price: Around $3.30. Resistance Levels: There’s a projected upward target of $6.5010, which aligns with the height of the cup pattern and indicates where the price might go following a successful breakout. Support Level: The lower green line at $1.7944 shows a significant support area in case the price reverses downward. Measured Moves: The text "2.3628 (272.58%)" and "4.7561 (272.57%)" indicates that this chart predicts a possible price movement of around 272% from the breakout point if the cup-and-handle pattern plays out correctly. These values reflect the price movements from the bottom of the pattern to the top. Blue Area: The blue dashed line and area likely represent a possible consolidation zone or retracement (the "Handle" of the Cup and Handle pattern) before the price potentially continues upwards. In summary, this chart suggests a bullish outlook for the SAGA/USDT pair, with a potential breakout from the cup-and-handle pattern leading to a significant price increase. However, the handle could form before the price reaches the predicted target of $6.50. Keep in mind that while this is a bullish technical setup, it’s important to manage risks and consider market conditions.
alemicihan
ETH Forecast

Trend Channels and Correction: There are two distinct descending trend channels visible on the chart. Currently, the price is near the lower boundary of these channels and might make an upward correction. This correction could aim towards the resistance levels marked above. Fibonacci Levels: The price appears to have touched the 1.618 Fibonacci extension at the 2,914.76 level. A reaction from this level is likely, and the price could move upwards to test the resistance levels. Support and Resistance Levels: Several important support and resistance levels are drawn on the chart: Resistance Levels: 3,125.86, 3,232.67, 3,306.00, 3,390.57, and 3,581.27. Support Level: 2,914.76. RSI (Relative Strength Index): The RSI indicator is close to the oversold region. This suggests that the price might soon experience an upward recovery. MACD (Moving Average Convergence Divergence): The MACD indicator might be signaling a potential upward reversal. Conclusion: The Ethereum price could potentially rebound from the lower boundary of the descending channel and initiate an upward movement. The first target for this upward movement could be the 3,125.86 resistance level. If it can break this level, it may test the 3,232.67 and 3,306.00 resistance levels subsequently. However, market conditions and the overall trend should be considered, and risk management is essential.
alemicihan
XRP Road MAP

Price Levels and Resistance Lines: The chart shows several horizontal resistance lines at different price levels such as $0.6025, $0.6135, $0.7915, $1.0260, $1.3437, $1.9716, and $4.1853. These lines are likely previous support and resistance levels where the price had significant interactions. Trend Lines:There are yellow downward and upward-sloping trend lines indicating bearish and bullish trends, respectively. The price has broken out of these trend lines multiple times, indicating shifts in the market sentiment. Pattern Formation: The chart shows a large triangle pattern with converging trend lines, suggesting a potential breakout. Smaller triangular patterns within the larger trend indicate periods of consolidation before the breakout. Measured Moves: Two measured moves are highlighted with blue rectangles, both showing a substantial 932.15% increase. These moves are indicative of significant upward momentum. The first move shows a price increase from approximately $0.19 to $1.97. The second projected move indicates a potential price increase from around $0.60 to the $4.18 target. Volume: The volume bar at the bottom indicates trading activity. Higher volume during breakouts and significant moves suggest stronger momentum. Current Price Action: The current price is around $0.6026, and it recently broke out of a consolidation pattern. The breakout suggests a bullish trend with potential targets at higher resistance levels. Key Observations: Support Levels: Around $0.59, $0.53, and $0.43. Resistance Levels: $0.6135, $0.7915, $1.0260, $1.3437, $1.9716, and $4.1853. Trend: The recent breakout suggests a bullish trend, with potential significant upward movement if momentum continues. Conclusion: The XRP/USDT pair appears to be in a bullish phase, with potential targets at higher resistance levels. Traders should watch for confirmation of the breakout and volume to gauge the strength of the move. Monitoring support and resistance levels will be crucial for making informed trading decisions.
alemicihan
COTIUSDT => Uptrend posibility

Price Action and Trend: We observe that the price has exited a long-term downtrend and entered an upward channel. The yellow downtrend line indicates that the price has broken this trend and started to rise. Support and Resistance Levels: There are several important resistance levels marked with red lines on the chart: 0.16873 0.14700 0.12527 0.08906 The support level marked with a green line is at 0.10158. Target Price and Potential Gain: The blue box and arrow indicate the potential for the price to reach the 0.12527 level. This represents an increase of 0.04543 (or 44.72%) from the current level (0.11223). Price Channels: We see that the price is moving within an upward channel marked in blue. This channel is used to define the boundaries of the upward movement of the price. Overall, the chart shows that COTI has recovered from an important support level and has the potential to move towards certain resistance levels. Such technical analyses can be important decision-making tools for investors.
alemicihan
BTC =>PO3 possibility

Overview of the Chart Timeframe: 1-hour (1h) candles Exchange: BINANCE Pair: BTC/USDT Current Price: Approximately 65,960 USDT Volume: 444.1 Key Chart Elements Support and Resistance Levels: Resistance Levels: Around 67,128 USDT Around 67,534 USDT Around 68,542 USDT Around 70,000 USDT (psychological level) Support Levels: 65,698 USDT 64,748 USDT 64,513 USDT 63,485 USDT Indicators: Relative Strength Index (RSI): Current RSI value around 50.24, indicating neutral momentum. MACD (Moving Average Convergence Divergence): Indicates bearish crossover, suggesting downward momentum. Volume Profile: Volume seems to have increased recently, indicating higher trading activity. Candlestick Patterns: Recent candles show a bearish trend, with a notable drop in the price to the current level. Observations and Potential Scenarios Bearish Scenario: If the price breaks below the current support at 65,698 USDT, the next potential support is at 64,748 USDT. The Ichimoku cloud and the stochastic oscillator indicate further downside potential. Bullish Scenario: If the price can hold above the support and move back above the 66,363 USDT resistance (purple moving average), it might aim for the next resistance at 67,128 USDT. RSI near neutral suggests there is room for an upward move if momentum shifts. Neutral/Balanced Scenario: Price might consolidate between 65,698 USDT and 66,363 USDT in the short term before deciding the next major move. Conclusion The chart suggests Bitcoin is currently in a critical zone, with a balance of bearish and bullish indicators. Close attention should be paid to the support at 65,698 USDT and resistance at 66,363 USDT. A break below or above these levels could indicate the next significant price movement. It's important to use this analysis in conjunction with other information and market conditions to make informed trading decisions.
alemicihan
WLDUSDT reversal possibility

Trend Lines and Patterns: The chart shows a descending yellow trend line indicating a downward trend. There is an upward channel marked by a series of blue and orange arrows, suggesting a potential reversal and upward movement. Support and Resistance Levels: Key support levels are marked in red around 2.1932, 2.0727, and 1.8819. These are prices where the asset found buying interest and bounced back up. Key resistance levels are marked in green at 2.4625, 2.2989, 3.5857, 3.7512, and 5.4107. These are prices where selling interest might increase and could potentially halt upward movement. Potential Price Movements: The chart suggests a bullish outlook with a projected rise to the green resistance levels at 3.5857, 3.7512, and 5.4107. The blue rectangle and the percentage (186.38%) indicate a possible target move to 5.4107, which represents a significant increase from the current price of 2.1941. Price Analysis: The price has recently broken above the descending trend line, indicating a potential trend reversal. If the price continues to follow the projected path (blue and orange arrows), it could encounter resistance at the identified levels before potentially moving higher. In summary, after a significant downtrend, WLD/USDT may be preparing for a bullish reversal, aiming for the higher resistance levels, with a potential substantial price increase if the bullish momentum continues.
alemicihan
PO3 possibilities on BTCUSDT

General Overview Time Frame: The chart displays price movements in a 1-hour (1h) timeframe. Current Price: The current price of Bitcoin is around 57,619.99 USDT. Previous Movements: There are two main downward trends followed by recovery movements evident on the chart. Technical Analysis Elements Descending Channels (Yellow Channels): The yellow descending channels indicate Bitcoin's downward trend.First Descending Channel: Represents a longer and broader downtrend. Second Descending Channel: A shorter-term downtrend, followed by an upward movement in price. Support and Resistance Levels (Horizontal Lines): Support Levels: Identified around 56,858.28 USDT and 53,400 USDT. Resistance Levels: Identified around 58,379.08 USDT and 61,997.53 USDT. Box Patterns: These indicate areas where the price has consolidated before breaking out. Each box shows that after a period of sideways movement, the price has broken either upwards or downwards. Trend Lines and Moving Averages (Blue Lines): These lines determine the average movement of the price and the general trend direction. The blue line indicates that the price is recovering following a decline. Potential Scenarios Upward Scenario: If the price breaks the 58,379.08 USDT resistance level, the next target could be 61,997.53 USDT. A movement toward 66,000 and 67,534.95 USDT levels may be observed if it holds above this level. Downward Scenario: If the price drops below the 56,858.28 USDT support level, the next support could be at 53,400 USDT. If this level is broken, a further decline to lower levels might occur. Conclusion This chart is used to analyze the short-term price movements of Bitcoin. Technical analysis attempts to predict future movements based on past price actions. Investors can use such charts to support their trading decisions. However, it's important to remember that cryptocurrency markets are highly volatile, and such analyses may not always yield accurate results.
Disclaimer
Any content and materials included in Sahmeto's website and official communication channels are a compilation of personal opinions and analyses and are not binding. They do not constitute any recommendation for buying, selling, entering or exiting the stock market and cryptocurrency market. Also, all news and analyses included in the website and channels are merely republished information from official and unofficial domestic and foreign sources, and it is obvious that users of the said content are responsible for following up and ensuring the authenticity and accuracy of the materials. Therefore, while disclaiming responsibility, it is declared that the responsibility for any decision-making, action, and potential profit and loss in the capital market and cryptocurrency market lies with the trader.