
ahmed_albalooshi6666
@t_ahmed_albalooshi6666

What symbols does the trader recommend buying?
Purchase History
پیام های تریدر
Filter
ahmed_albalooshi6666
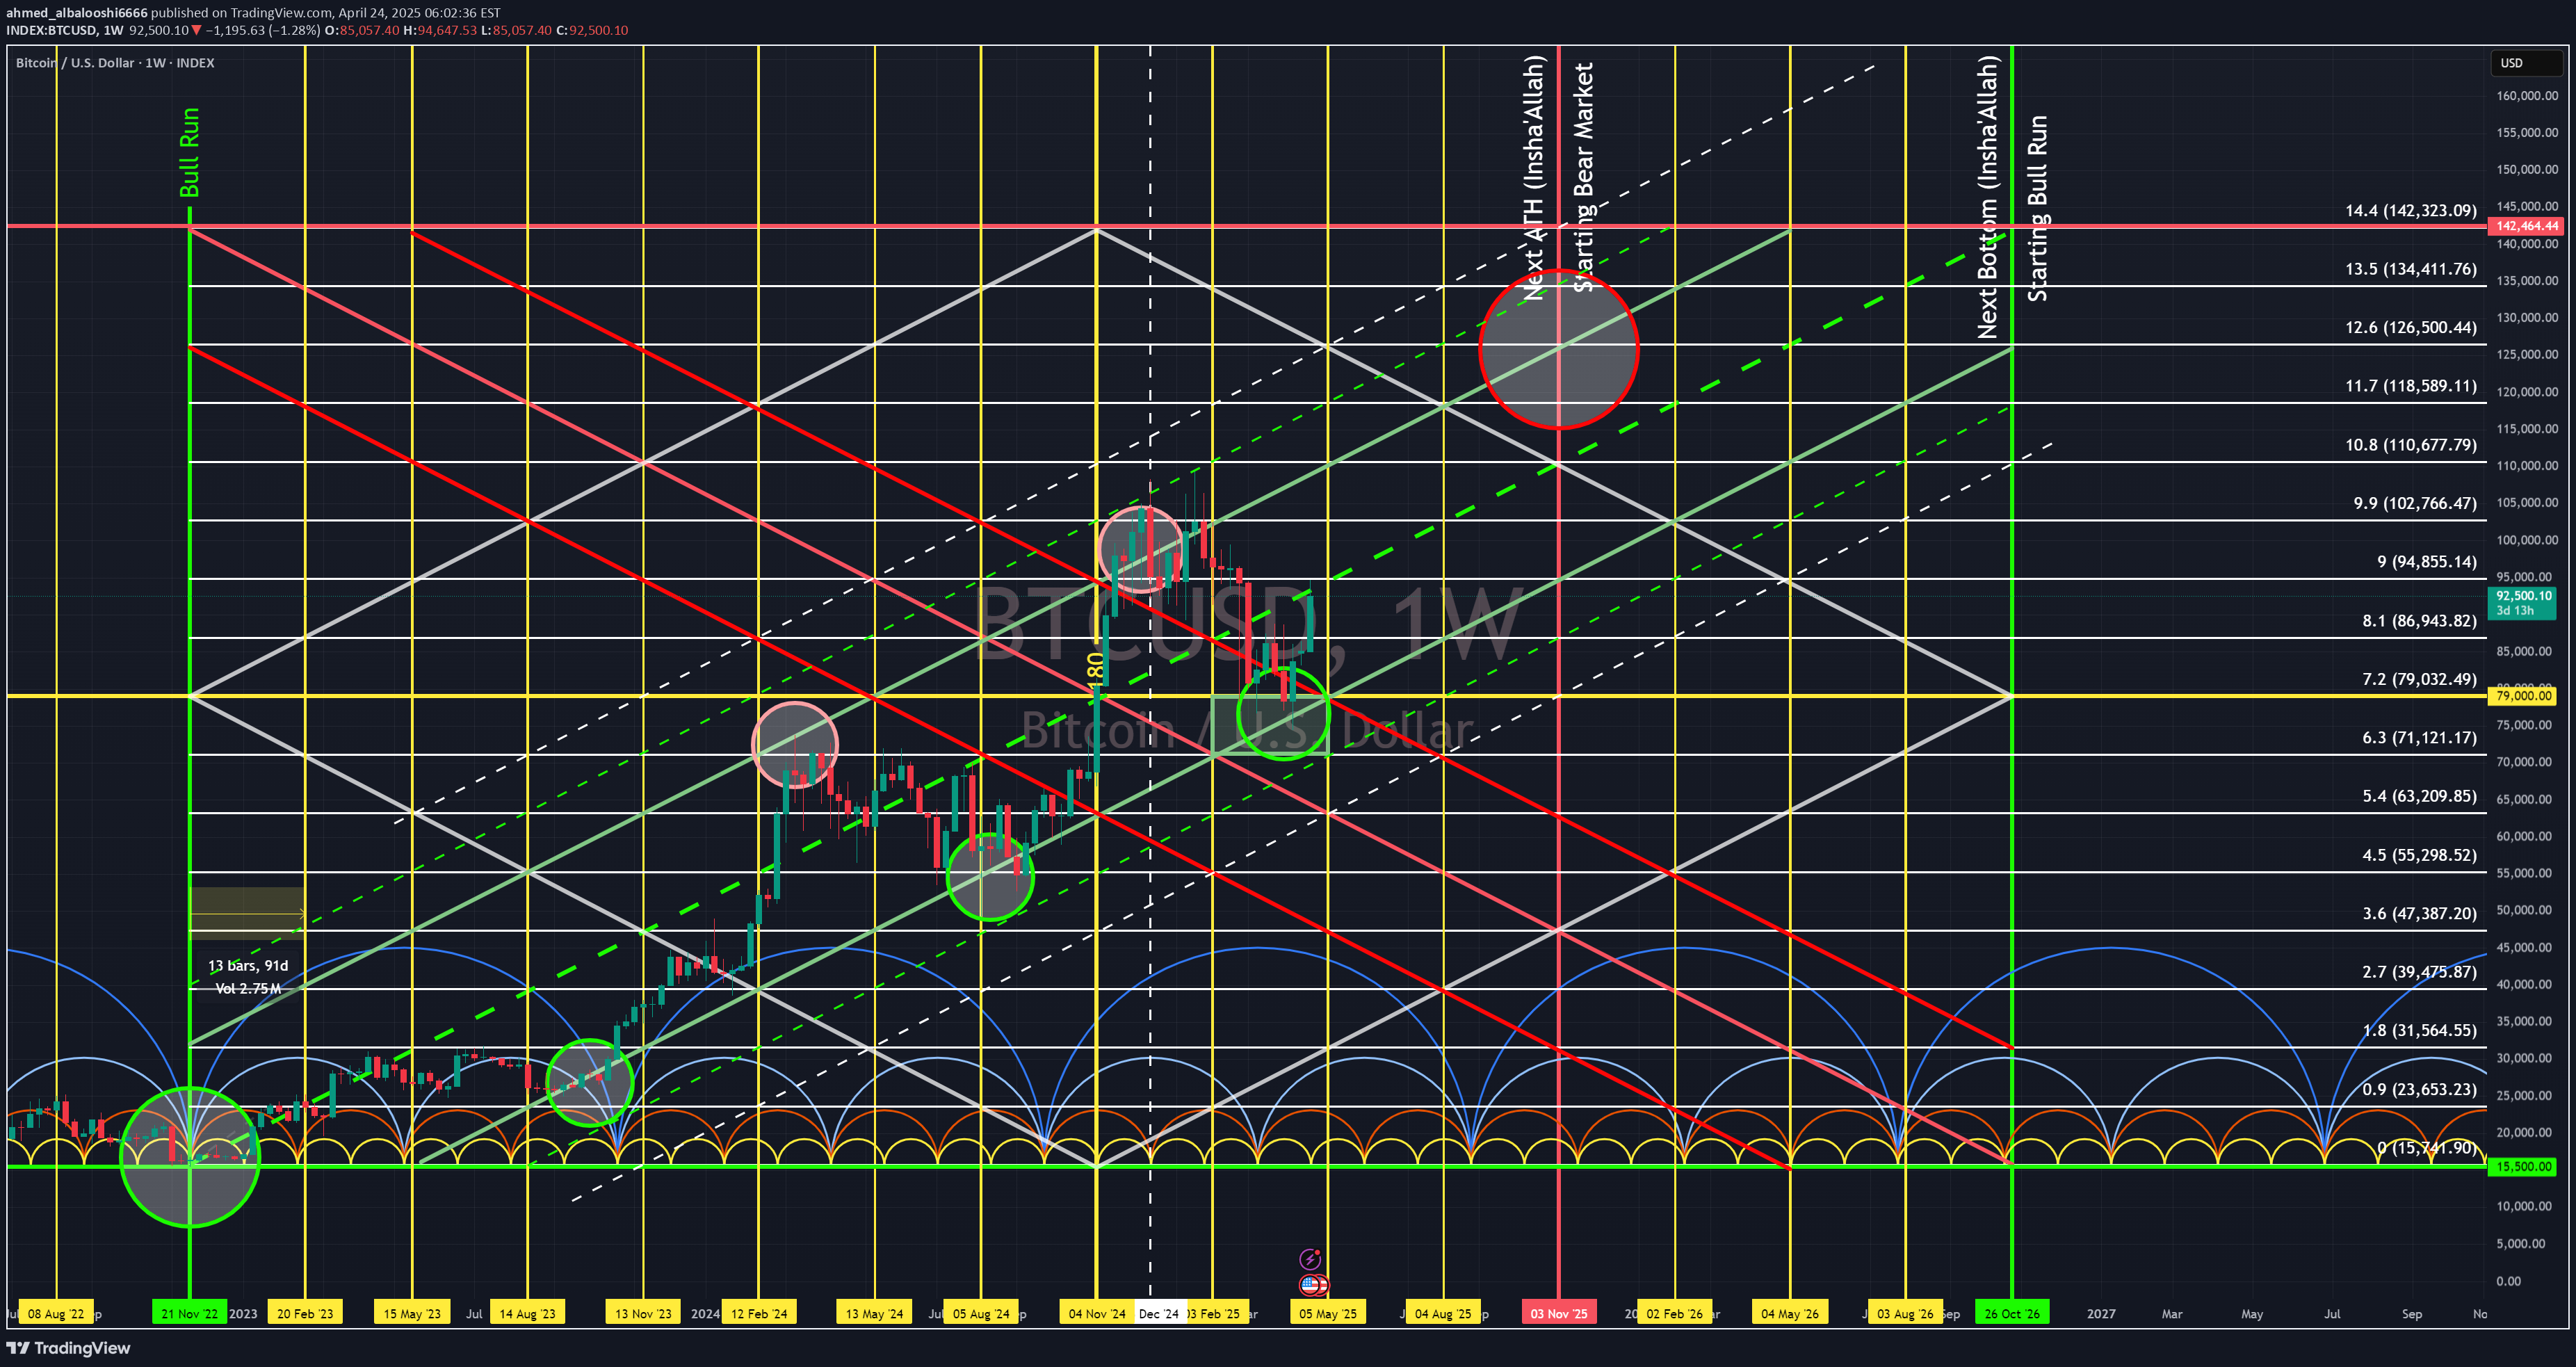
#Bitcoin Has Entered a Danger Zone – Is a Correction Imminent?

From a time-cycle perspective, we’re approaching what appears to be a macro cycle peak — a historically risky zone that often precedes a significant correction. That said, this doesn’t necessarily signal the end of the bull phase just yet. 🔸 Interestingly, altcoins are behaving differently this cycle. Many holders have been sitting on positions since 2021, and market psychology is shifting. Still, chart structures suggest a potential upward move, especially among leading altcoins. 📊 Technical Outlook: Bitcoin may wick into the 115–118K zone Followed by a correction toward 84–94K Then, potentially a final wave toward 120–130K levels (As always — this is a personal outlook, not financial advice) ⚠️ Traders & Investors Take Note We're entering a phase that demands: Clear strategy Emotion-free execution Strong risk management As I’ve warned earlier this year — most of 2025 could be corrective (≈70%), with the remaining upside coming in sharp, rapid moves. If you study the charts, you’ll notice that downtrends take longer, while uptrends move faster. 📌 Final Thought: Don’t chase — position smart. The market rewards those who prepare, not just those who react. #Crypto #BTC #Bitcoin #Altcoins #TradingStrategy #TechnicalAnalysis
ahmed_albalooshi6666
GANN Analysis for BTC/USDT – Time/Price Intersection Zones

⚡️ Chart Type: 1D Toolset: GANN Fan + GANN Box + VWAP-MA Combo + Custom RSI Cycle + Dynamic S/R levels Asset: Bitcoin / Tether (BTCUSDT) 🔍 Key Observations: 1- GANN Fan & Box Alignment Multiple converging GANN angles from key pivot lows (notably 74,626.93) create a price/time compression zone. The green and red fan lines show clear support and resistance “rails” guiding current BTC movement. 2- Support/Resistance Cluster: Major GANN resistance zone: ~91,500–91,900 USDT. Strong mid-range support: ~83,400 USDT (0.75 retracement). A possible reaction zone near 86,300 USDT, in line with VWAP deviation and GANN grid intersection. 3- Time-Based Turning Points: April 9, 2025, was a confirmed local bottom, matching RSI cycle lows. May 4–6, 2025 (highlighted in red) is the next GANN timing arc, suggesting a potential swing high or local top. Jun 27, 2025, is the next major GANN time intersection. Depending on the trend strength leading into it, it is highly likely to act as a macro inflection point. 4- RSI Cycle Outlook: RSI Master v3 shows overbought conditions (~77), historically signaling near-term cooling or consolidation. Previous similar RSI peaks led to pullbacks into mid-fan levels. Timeline Expectation : Short-Term (5–12 May): Watch for price rejection near 92k, with possible retracement to 86k–83k. Mid-Term (June–July): A consolidation phase likely leading to expansion near July 25, where directional breakout potential increases. Strategy Suggestion: Traders may consider this period (early May) as a high-alert zone. If BTC fails to hold above 91.5k, expect a deeper rotation toward fan base support. July 25 could serve as a strategic entry/exit timing based on confirmation. 📈 Not financial advice — time/price confluence zones like these are tools for probabilities, not guarantees. Always manage risk and follow your plan.
ahmed_albalooshi6666
BTC — The Power of Time, Numbers... and a Touch of the Cosmos
🌀 Since November 2022, I've been sharing this time-based projection for Bitcoin, not with hindsight or emotion… but with numbers, cycles, and precise timing. From the bottom regions in late 2022 to the recent rejection near $74k, in Apr 2025, This roadmap was not built on opinions… But on a science of measured structure. 🔍 A note to the reader: ---------------------------------- What I share is not a "school" of thought or a trading style. It is not built on price patterns or indicators that change with each wave. This is a discipline grounded in mathematical cycles, harmonic angles, and yes, occasionally, the elegant symmetry of planetary motion. 📌 Science Vs. Hypothesis This is a science, not a setup. A structure, not a strategy. And a study, not a shortcut. 🧠 While others debate theories and frameworks, This work measures time itself, where price is merely the reflection. ⏳ If you're seeking quick gains or signals, this is likely not your path. But if you're drawn to precision, harmony, and deep structure, you've touched the edge of something far greater than a method… "Time is the governing force. Price only follows." — Inspired by W.D. Gann #TimeCycles #BTC #AstroTrading #NumericalAnalysis #CryptoMacro #GANNTIME #SquareOfNine #PriceAndTime #BitcoinForeca
ahmed_albalooshi6666
GOLD (XAUUSD) – Gann Time Cycle Analysis (0° to 360°)

From the November 30, 2015 low, we've entered a long-term Gann square cycle. Each 45° marks a price movement zone, while 360° = full cycle completion. We're now near 270°–315°, typically the zone of cycle tops. 📅 360° = December 14, 2026 This could mark a long-term time-based high for gold before a macro correction unfolds. When time and price complete a cycle — a new story begins. ---------------------------------------- 🔢 Gann Degree Levels for Gold (from 2015 Low): 0° → $1,046 (Cycle Start) 45° → $1,357 (Initial resistance) 90° → $1,709 (Now support) 135° → $2,102 (Warning zone - passed) 180° → $2,535 (Mid-cycle balance) 225° → $3,008 (Breakout confirmed) 270° → $3,638 (Current region) 315° → $4,317 (Major overextension) 360° → $5,223 (Full cycle top) ⏳ Current price is approaching 270°–315°, historically where long-term tops form. 📅 Cycle completion expected by Dec 14, 2026 #GannAnalysis #TimeCycles #Gold #XAUUSD #MacroForecast
ahmed_albalooshi6666
BTCUSDT – Critical Time Pivot Approaching

🟡 A major convergence point is forming around April 19, 2025, 19:00 (Bahrain time) , where a long-term symmetrical triangle is set to be resolved. Price is coiling tightly near the apex, suggesting an imminent breakout or breakdown. Watch volume and RSI closely — momentum is building. This could mark a decisive shift in BTC’s medium-term trend. 📌 Stay alert. The chart is speaking — and it’s almost time. #Bitcoin #BTCUSDT #PriceAction #CryptoTrading #ChartAnalysis #BreakoutWatch
ahmed_albalooshi6666
Bitcoin at a Time Crossroads — Technical & Temporal Confluence

According to the current cycle-based chart structure, Bitcoin has reached a key temporal bottom, aligning with previous cycle lows. Technically, we are entering the final phase of this bull run, where timing outweighs sentiment. While global headlines grow increasingly bearish — from aggressive trade policies under Trump, to overextended U.S. markets breaking above all expected tops — Bitcoin now faces a crucial test: Can it prove itself as a resilient, time-bound asset like gold? History tells us: news creates noise, but cycles guide price. What happens next could redefine Bitcoin's narrative as a macro-hedge and cyclical leader. 📉 Watch closely — this is not just about charts, it’s about conviction. #Bitcoin #CryptoCycles #MarketTiming #BTCUSD #TechnicalAnalysis #MacroView #TradingView
ahmed_albalooshi6666
BTC/USD Forecast Using Gann and Astronomical Analysis

4-hour Chart: Watch the reversals on Gann Fan lines. Today, I am sharing a comprehensive analysis of Bitcoin (BTC/USD) using a combination of Gann Angles, Planetary Cycles, and Astronomical Events. This method blends W.D. Gann's legendary market geometry with planetary transits that influence financial cycles. 🔥 Key Insights from the Chart: 1️⃣ Date of Importance: March 11, 2025 (3:00 UTC) This date marks the Gann Square Base where multiple angles converge. Significant planetary transits align with Gann angles, suggesting a potential reversal or breakout zone. Expect high volatility around this time frame. 2️⃣ Critical Angles and Price Levels: Yellow Lines: Represent major Gann angles projecting long-term resistance and support. 🌟 1x1 Angle: Strong upward trendline, which, if broken, indicates a shift in market momentum. ⚡️ 45° Angle: Positioned near $105,333 and may act as a key resistance zone. Red Lines: Bearish Gann angles acting as resistance from the base point. ⚠️ 1/8, 1/4, and 1/2 Lines: Intermediate resistance points with potential to cause retracement. Green Lines: Bullish support angles with the following key zones: ✅ 81,185 (3/8 Support): Important level that Bitcoin may retest before continuing the upward trend. ✅ 77,160 (4/8 Support): Strong support indicating a potential bottom if price corrects further. 3️⃣ Planetary Events and Their Influence: Sun Ingress (21 March 2025): Historically marks shifts in trend and market sentiment. Mercury and Venus Retrograde/Direct Movements: Key planetary events that align with trend changes in crypto markets. ⚡️ March 31, 2025: Pay close attention to this date as it coincides with Mercury Direct and possible price breakout. 4️⃣ Future Price Zones Based on Gann Squares: 109,358: Projected upper target if bullish breakout occurs. 81,185: Intermediate support where price action might bounce. 77,160: Strong long-term support, a break below indicates a potential bearish move. ⏳ Time Windows to Watch: March 31, 2025: Mercury Direct is signaling a possible change in market direction. April 7 - April 9, 2025: Gann Square 90-degree rotation, suggesting another potential market turning point. 🎯 Trading Strategy: ✅ Long Entry: If BTC finds support near the 3/8 angle ($81,185) or 4/8 angle ($77,160), anticipate a bounce toward $92,500 and beyond. 🚨 Short Entry: If BTC fails to hold the 1/2 Gann Angle and breaks below $77,160, expect further downside toward lower price levels. 🌌 Why Gann and Planetary Analysis? Gann believed that "As above, so below" — suggesting that planetary cycles often influence market trends. By aligning Gann's time cycles with astronomical events, we can predict key price reversals and market turning points with increased accuracy. 💡 Final Thoughts: Watch closely how Bitcoin reacts around the highlighted dates. Time and price alignment at Gann angles combined with planetary influence create a powerful confluence of signals that should not be ignored. 🔔 Follow for more insights and upcoming market updates. Happy Trading! 📈🌌
ahmed_albalooshi6666
Bitcoin’s Path: Precision of Time Cycles and Digital Analysis

Can any traditional analysis method claim to have mapped Bitcoin's trajectory since its breakout in November 2022 with such precision—without a single major time cycle deviation for over two years? 📊 Now, as we approach the end of the cycle in late 2025 , this current correction could very well be the final dip before a strong rally , followed by a major drop. We are getting closer to the time-based bottom; from there, the next phase begins! 🚀 Yet, despite the precise alignment with digital and time cycle analysis, some still dismiss these methods without understanding the mathematical foundations upon which they are built. Instead of exploring the deep connection between numbers and market behavior, they reject what they don't comprehend. To those willing to learn and evolve, I wish you success on your journey. As for the critics without knowledge, I’m not here to convince everyone. I’ve spent years refining this craft through study and experience—if you’re open to learning, welcome aboard. If not, good luck! 😉 Let’s see how time proves everything once again. 💡🔥 #Bitcoin #BTC #TimeCycle #GannAnalysis #DigitalAnalysis
ahmed_albalooshi6666
Market Outlook & Key Dates to Watch – March 2024

📌 Key Market Dates Ahead We have a significant market shift on March 7, but the most crucial period to watch will be March 13-14. ⚠️ Risk Management Reminder: Stay disciplined with your entry and exit strategies, and avoid emotional trading—whether it's fear or greed. Proper risk management will be key in navigating the upcoming market conditions. 📉 2025 Market Outlook: The year ahead is shaping up to be challenging, with moments of upward movement that may not sustain for long. Staying adaptable and strategic will be essential. 🔹Wishing you all successful trades and a profitable journey ahead! 🚀📈
ahmed_albalooshi6666
GALA Crypto: Critical Turning Point on Feb 16!

📉 GALA/USDT is approaching a key decision point! Based on trend lines, Fibonacci levels, and RSI signals, we see: 🔹 Strong bullish momentum since Feb 3 📈 🔹 Resistance near $0.025 - breakout or rejection? 🚀 🔹 Bearish RSI divergence forming – possible correction ahead? ⏳ Feb 16 is a critical date! If GALA holds above support, we could see further upside. However, a breakdown may trigger a retest of lower levels. Watch price action closely! 👀 💬 What’s your target for GALA? Bullish or bearish? Drop your thoughts below! 👇 #GALA #Crypto #Trading #Altcoins
Disclaimer
Any content and materials included in Sahmeto's website and official communication channels are a compilation of personal opinions and analyses and are not binding. They do not constitute any recommendation for buying, selling, entering or exiting the stock market and cryptocurrency market. Also, all news and analyses included in the website and channels are merely republished information from official and unofficial domestic and foreign sources, and it is obvious that users of the said content are responsible for following up and ensuring the authenticity and accuracy of the materials. Therefore, while disclaiming responsibility, it is declared that the responsibility for any decision-making, action, and potential profit and loss in the capital market and cryptocurrency market lies with the trader.