
ZoharCho
@t_ZoharCho

What symbols does the trader recommend buying?
Purchase History
پیام های تریدر
Filter
Short AMZN finished with pinbar candle
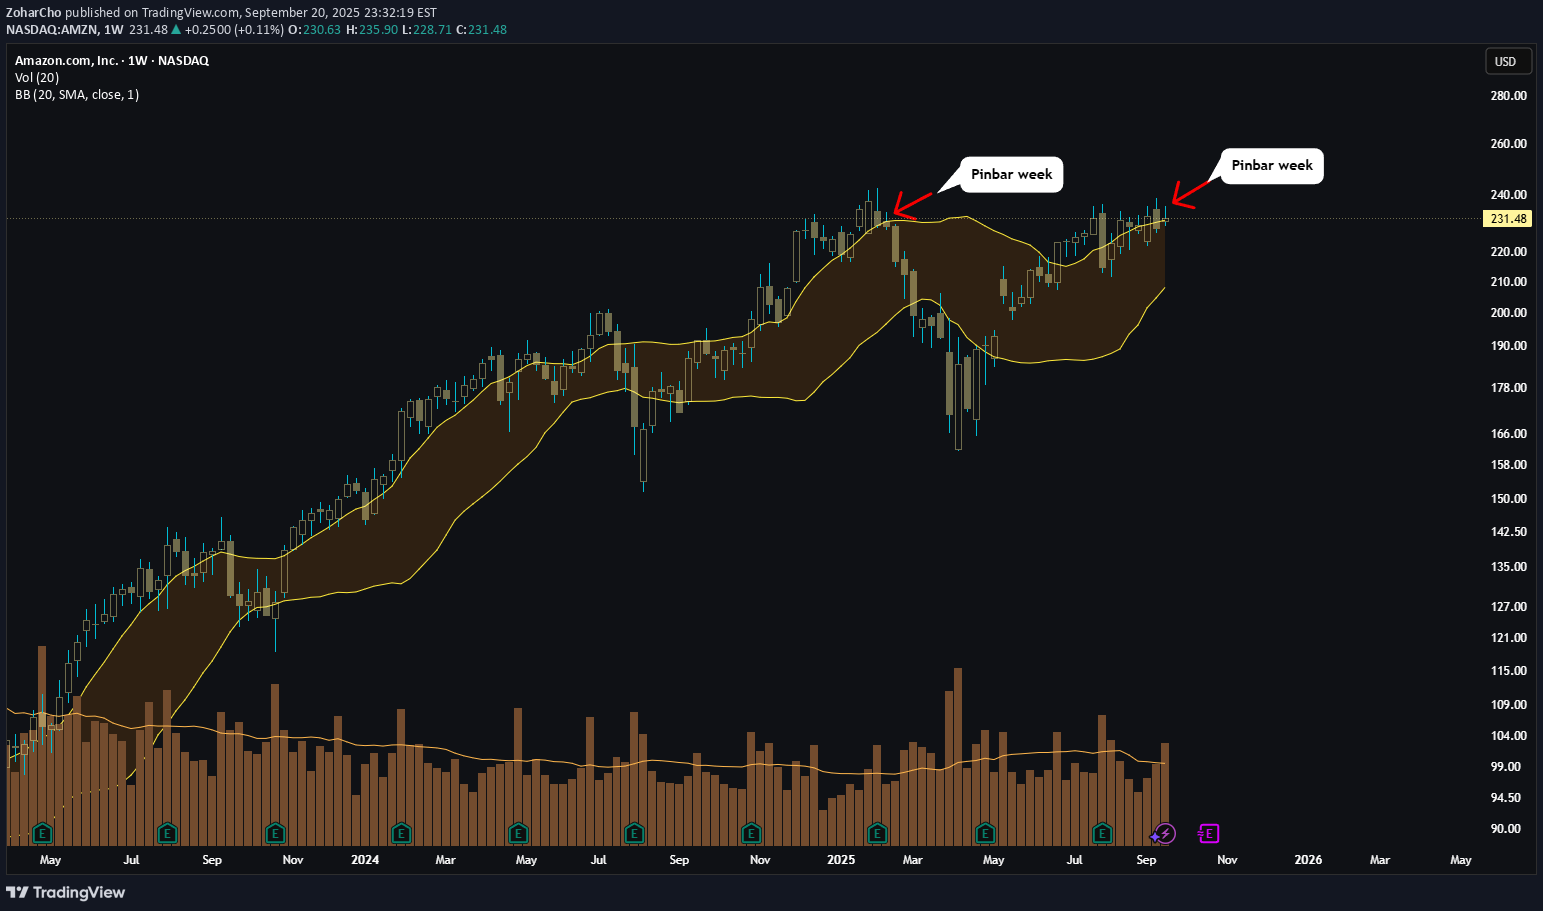
The market is in position for a correction. There is a similar pinbar pattern on the weekly, like the previous drop. Expecting a drop in AMZN to materialize. Look at the daily, there was a gap down on earnings, a warning of what is coming ahead. If long, we would expect after the gap close, to continue higher, especially after Fed announcement about the interest rate. Since it did not materialize to the long side, then the hypothesis of long, is now invalid. Hence, the hypothesis of short, is more likely.
TSLA is about to fly as NVDA
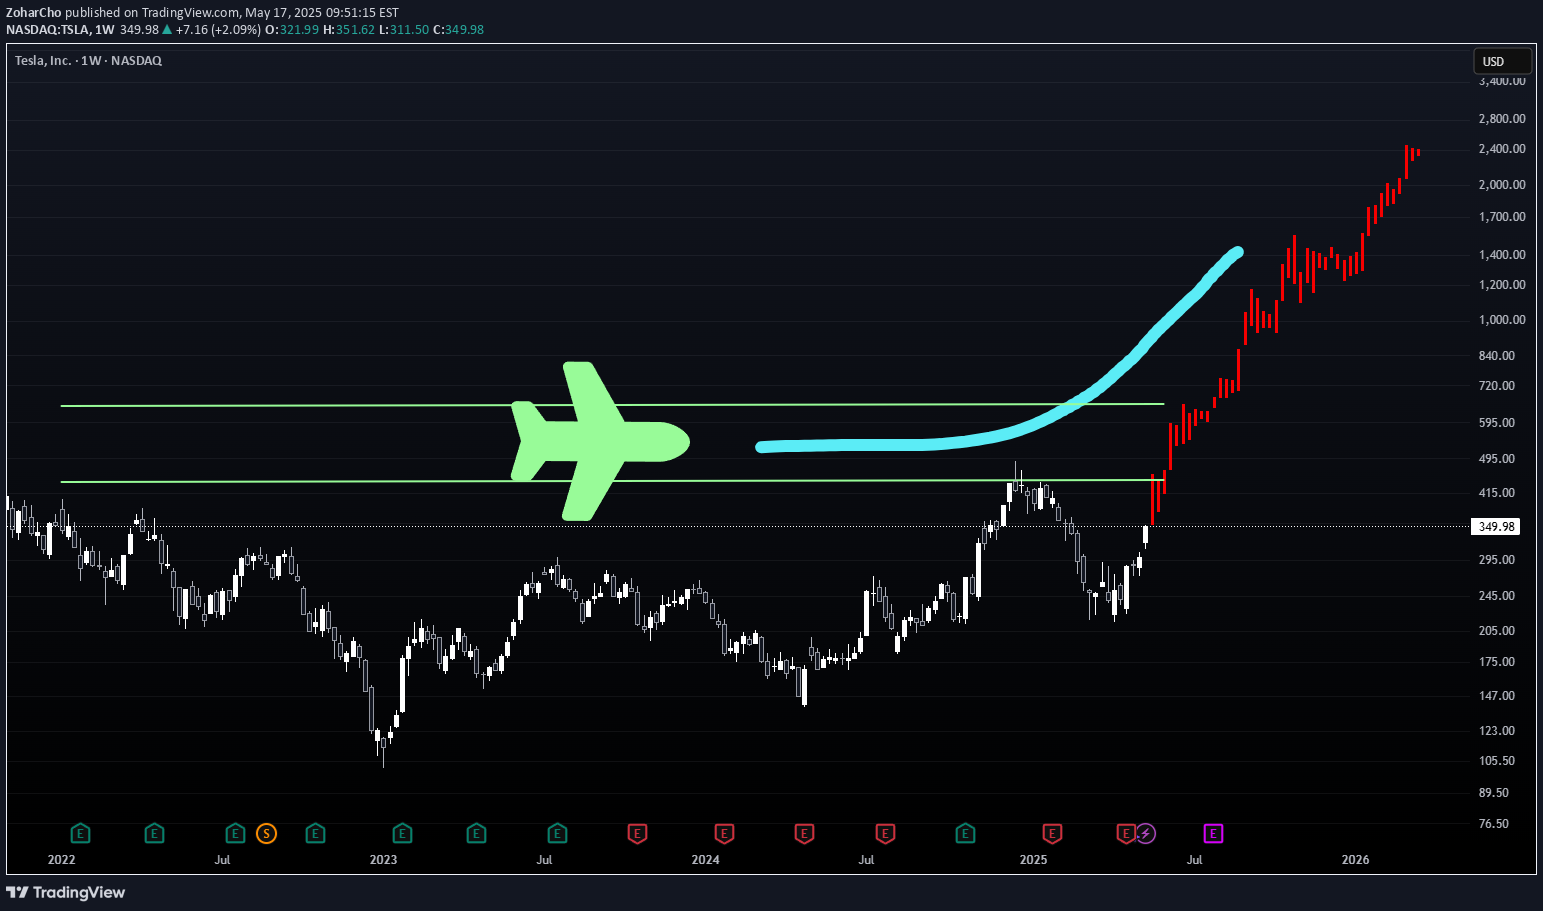
After a long basing, we finally have our runway to fly to new heights... Same as NVDA did... Yes... Maybe Elon is not popular, but popular does not produce and drive money. LOGIC does. And if you saw his robots... You know you want one... Think about the potential it has! Everywhere there is a HUMAN, and it is supposed to function as HUMAN... How many humans are in the world? How many of them are working in factories? Now imagine you don't need to pay pension, social rights, food... to those robots... and there is only a cost for maintenance and electricity... 24hr work.... Factory workers... Mall guards... Private property security guards... High risk danger activities... THE GROWTH POTENTIAL IS BILLIONS... Think about the growth of cars...

We potentially about to see a HUGE move on TSLA
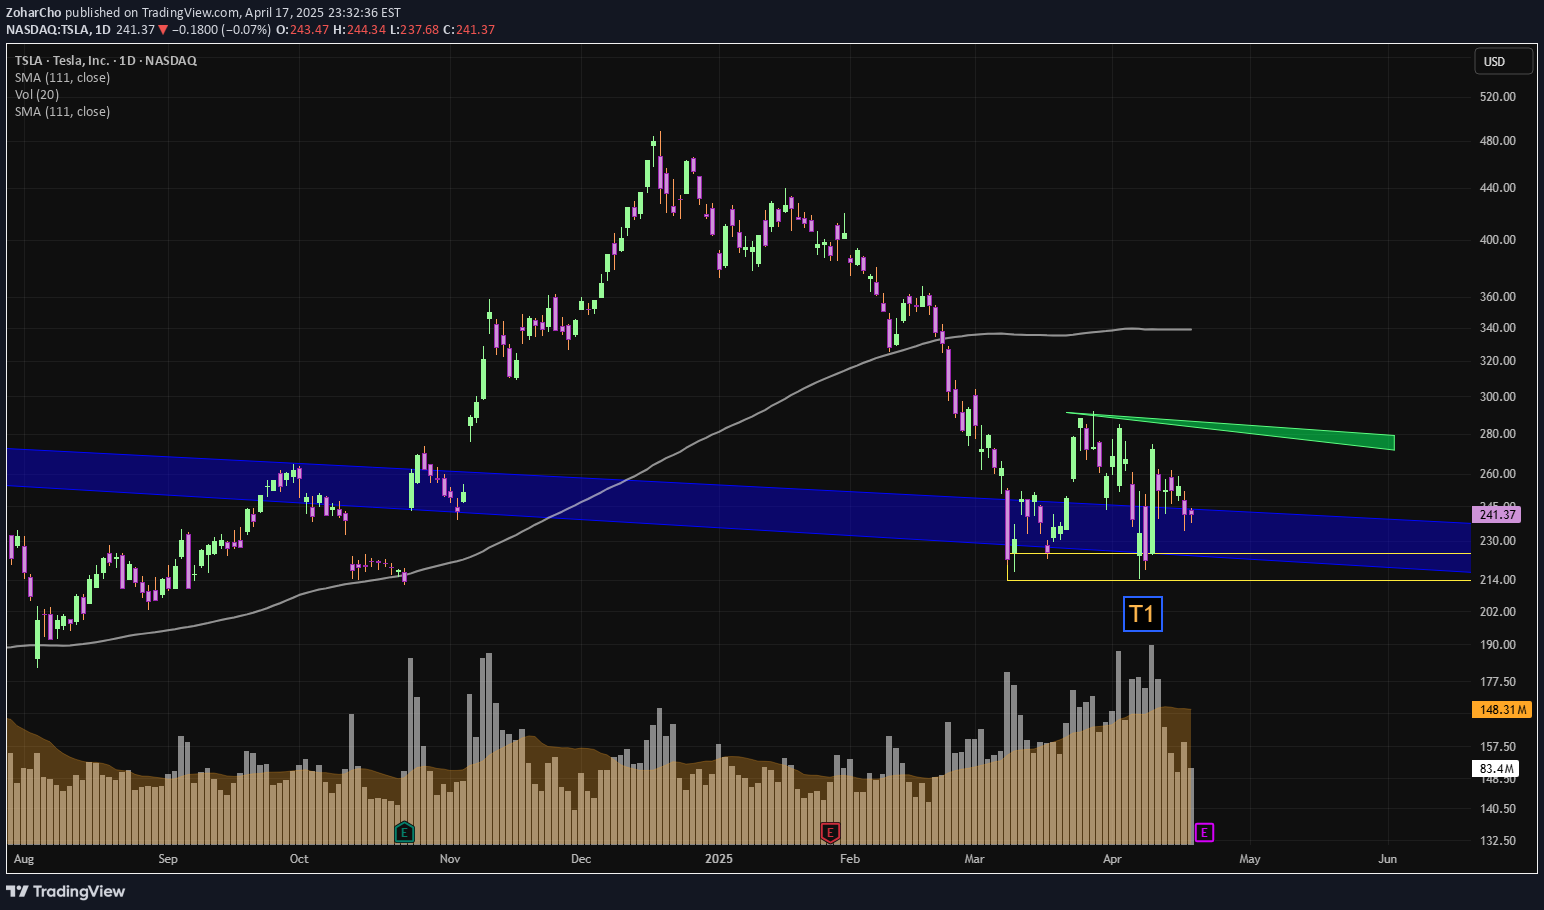
We broke a SUPER LONG-TERM BEARISH TRENDLINE (blue) on the weekly timeframe. + We have been RANGING for quite some time... + TSLA has a personality of explosive, crazy moves + TSLA builds HUMAN ROBOTS... (SUPER HIGH VALUE in my opinion, the potential for this is astronomical) What do we actually need for this move to materialize? We need the market in our favor. Lets see if the market will push strongly up or bleed down. Please also note that before explosive move previously that no one believed it would happen, the earnings reports of TSLA were RED the same as now. ALWAYS MAKE SURE YOU MANAGE YOUR RISK.
META watch out if market is not completing a V-form
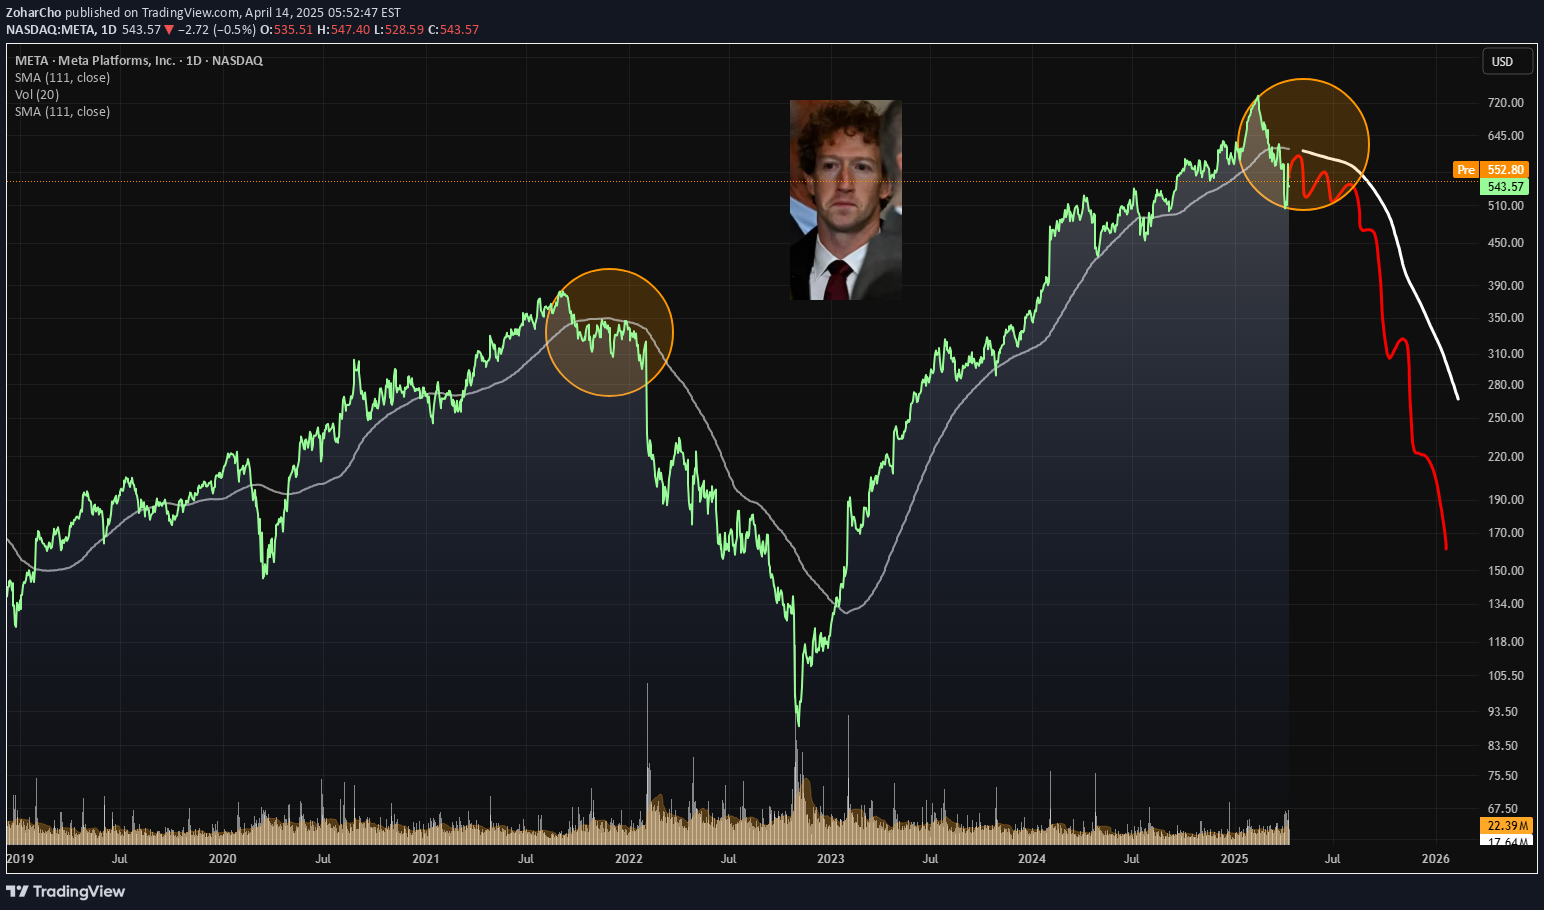
Mark does not look happy.... See that META is now below the MA, since it had the previous behavior of falling like a stone massive amount of percentage, it is more likely to do it again. Look on this one carefully if you are long. If the market will not complete the V-Formation, and shoot up, we may see the stock fall again, substantially.Picture of Mark from Reuters
NVDA rebound after PANIC SELLING
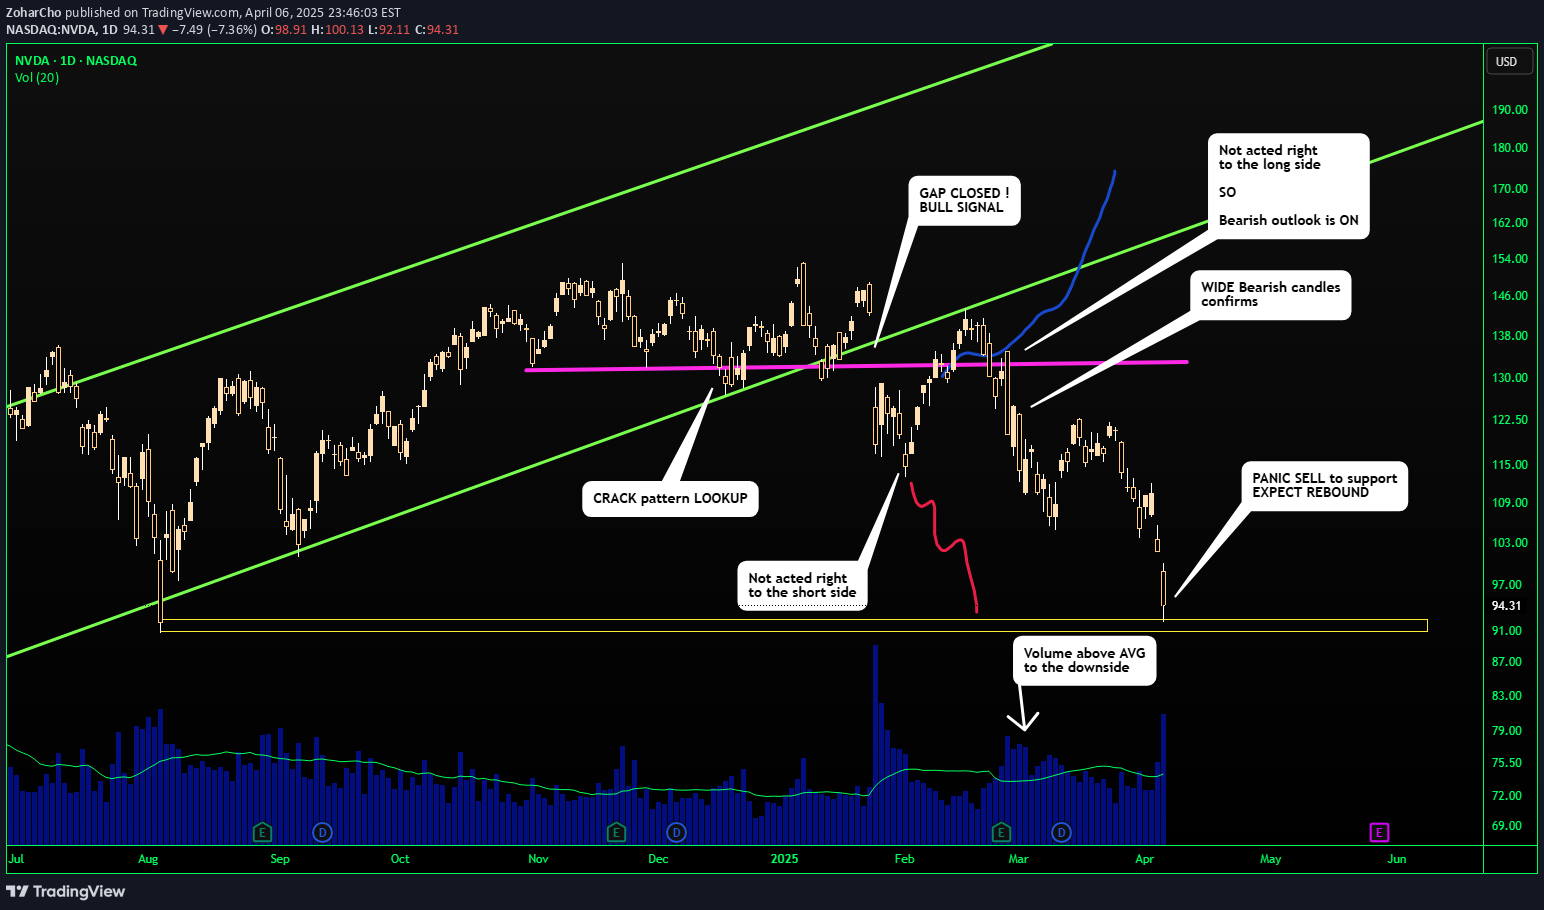
This idea is a perfect example of how the market gives you different signs at the reversal points. Let's recap from the beginning: 1. First, there was the CRACK pattern of the support, which warns of a bearish move. 2. There was an attempt to go higher which did not work out. 3. There was a GAP DOWN, that needed to materialize the CRACK pattern to the downside, but it did not act right, and did not spill right away and there was a bounce above the broken pink support line. 4. After #3, you would expect a Bullish move, the BLUE trajectory, since #3 acted as a real-time lookalike of a SPRING by Wyckoff methodology. But the BLUE did not materialize, so it did not "act right" according to Jesse Livermore. 5. When we started going down again on wider and wider bearish candles, this confirms again the CRACK PATTERN. What is the CRACK PATTERN? The crack pattern is when there is a CLEAR support/resistance line, that has been "cracked", but then there is a "retest" a false move, to the other side, as if the CRACK is the false move, but the CRACK signifies the upcoming strong move. Once the CRACK is being CRACKED again, the big explosive move should come. 6. The CRACK pattern materialized, and we got the spilldown = STRONG SHORT MOVE. 7. See my educational idea about this CRACK PATTERN, as "found" before the fact, this time it was more tricky than usual since it did not follow "the right way" as right away as usually happens on a weaker stock since NVDA has a bullish outlook. So it "put out a fight. Or in the puppet master view... if the public want to buy higher before the fall... there is no reason to sell him lower... so the price rebound and the fall did not materialized right away. 8. The moral lesson from this, is that in realtime, you need to change your hypothesis as you go. Once a signs for strong movement happen, then you want it to "ACT RIGHT". If it does not act the way you know, you need to quickly change your direction.The rebound happened beautifully. I hope you made money on this one. Here is what happened for the historical record:Result.
HOW TO Document your RESEARCH using TradingView
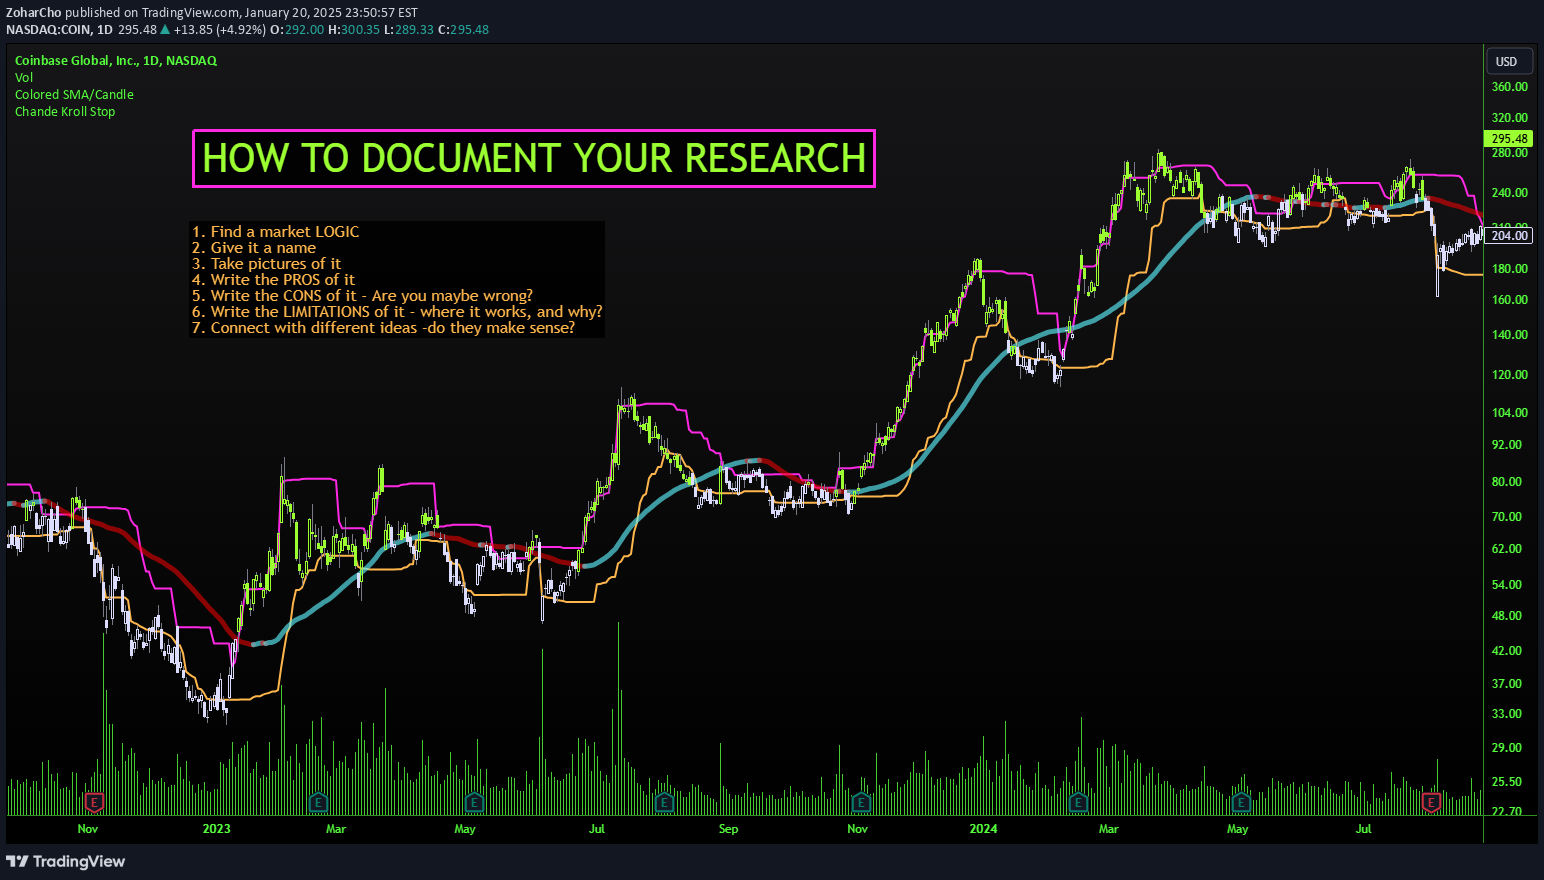
Documenting your research as a trader is not just beneficial—it's essential. After a decade in the trenches, I know that organized, thorough documentation can make the difference between a profitable strategy and a missed opportunity. TradingView is not just a charting platform, it is also a journal, a diary, for ALL your trading ideas. The features it has are enormous. You can literally screenshot/snip your screen or part of it from another window and then CTRL+V it onto the chart itself. Personal TIP: I picture my physical notes, then I put the picture inside next to the chart, then I save the chart image with a link, and then I put the link into the idea text, and it shows me the note, like here: You can always revise your documentation and add to it as much as you want. The more evidence you can add, the more sound your pattern is, and the more confident you will be in putting your money on it, since you "KNOW" it should manifest because it is backed up by stock market logic and research. The price will move, with you or without you, ask yourself always the question: "Can this move be predicted beforehand?" and start your way from there... Be honest with yourself, some moves just CANT be predicted, they come out of nowhere, but others CAN and WILL give you HUGE SIGNS... if you document them... Here’s a structured approach to help you capture and refine your trading insights: 1. Find a Market Logic Before diving into trades, establish a market logic—a hypothesis or theory that drives your trading decisions. This might stem from historical data patterns, news-driven market reactions, or economic indicators. Ensure your logic is grounded in data and has a clear basis for expected outcomes. This foundational step helps avoid random, emotion-driven trades. 2. Give It a Name Assign a distinct and memorable name to your market logic. This helps you quickly reference and differentiate between multiple strategies. A good name can be as simple as “Earnings Reversal Strategy” or as creative as “The Phoenix Rebound.” Naming your strategy not only aids in documentation but also enhances your cognitive recall during decision-making. 3. Take Pictures of It Documenting your strategy visually is crucial. Take screenshots of relevant charts, trade setups, and indicators. Annotate these images with key details like entry and exit points, stop-loss levels, and any other pertinent information. Visual aids can clarify your logic and make it easier to analyze past trades. TradingView allows you to insert a chart into your research, giving you the most visual documentation possible. By the way, if you are short in time, you can do a video of your documentation and speaking your idea of a strategy instead of writing it, much faster documentation. Also, much more interactive for future reference. 4. Write the Pros of It Clearly outline the pros of your strategy. These could include: Consistency: Does your strategy yield reliable results over time? Risk Management: Does it have built-in mechanisms to minimize losses? Simplicity: Is it straightforward to execute without complex calculations? Adaptability: Can it be applied across different market conditions? 5. Write the Cons of It - Are You Maybe Wrong? Be honest about the cons of your strategy. Acknowledge potential weaknesses: Overfitting: Does your strategy rely too heavily on historical data, potentially failing in real-time? Complexity: Is it too complicated to execute consistently? Market Conditions: Does it only work in specific market environments? Emotional Bias: Are there elements that could lead to biased decision-making? 6. Write the Limitations of It - Where It Works, and Why? Define the limitations of your strategy. Clearly state where and why it works, and under what conditions it might fail: Timeframes: Does it perform best on certain timeframes (e.g., daily, weekly)? Market Phases: Is it more effective during trending or ranging markets? Instrument Specificity: Does it work better with certain asset classes (stocks, forex, commodities)? Understanding these limitations helps you apply your strategy more effectively and avoid unnecessary risks. 7. Connect with Different Ideas - Do They Make Sense? Finally, cross-reference your strategy with other ideas and strategies. This process involves: Finding synergies: Does your strategy complement other existing strategies? Seeking validation: Are there external sources or research that support your logic? Peer Review: Discuss your strategy with fellow traders to gain different perspectives.
HOW TO TRADE with the ICHIMOKU
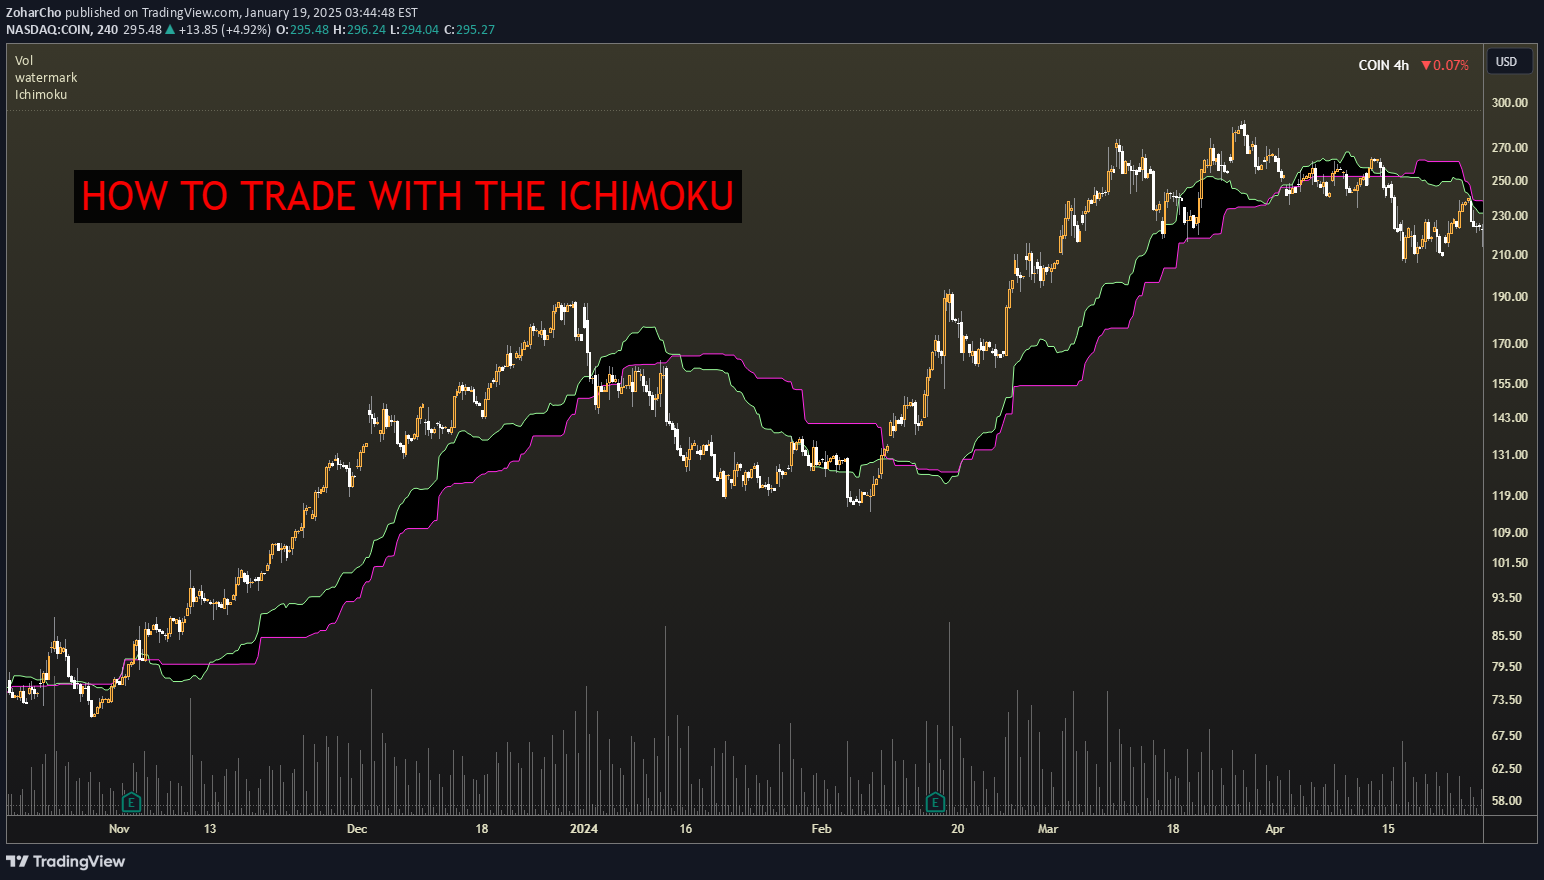
The Ichimoku is one of the best-trending indicators out there. The best strategy you could use is the CLOUD BREAK. When the price is breaking out of the cloud, you enter into a trade in this direction. This is the best strategy because the Ichimoku Indicator shows you multiple timeframes simultaneously, but the cloud is the highest timeframe, which means it is the strongest, and you will have fewer whipsaws and false entries with it. This indicator is also a great tool, to hold onto your winning trades and let your profits run. Once you get professional with it, you will know how to recognize both trending environments and ranging environments. This means that you will know how to apply different strategies that are fit to that specific environment.Identify when buyers are stuck:Identify when sellers are stuck:
Odds favor the long side on BTC

You can clearly see that there was a volume spike that absorbed the selling of the weak hands, now you see that the volume returns to the direction of the trend up, so people are not willing to sell Bitcoin at a lower price, so the puppet master has to increase his bidding price so he can get filled after Trump WON the election.Add to it that the price was consolidating for half a year and holding its value near the top.This is actually a very useful pattern, some will call it the "spring" if you are a Wyckoff follower. The volume on the downside can be misleading and be thought as a selling, but it is actually a fear technique to induce selling so the puppet master can buy and get liquidity from all the weak hands. This is why as Livermore said better to wait for the market to show you, you are right, and then ride on the right wave direction. Also, Livermore mentions that stock trading is done by having a hypostasis, seeing that the market confirms or invalidates the hypostasis, then trade accordingly. You would expect the RED marking I did to manifest... for it to be short... since it did not manifest, it means that the hypothesis of short is wrong, so the hypothesis of long is more probable.This is a continuation of my post of BTC taking elevator up:BTCUSD, bitcoin hit the 100k mark, It was a very nice easy move to hold on to.This is a NOTE FOR EVERYONE WHO SEES IT, the pattern I showed previously, is repeating and it is a very strong indicator of the LONG side, it should not be neglected. Also, the thinking type I have shown you here, is how to realize that according to stock market logic, it favors the LONG side. NOTE TO SELF: this pattern is important I need to make educational post about it. Hope I will get the time. so busy this days.
What are Volume Candles and how to use them
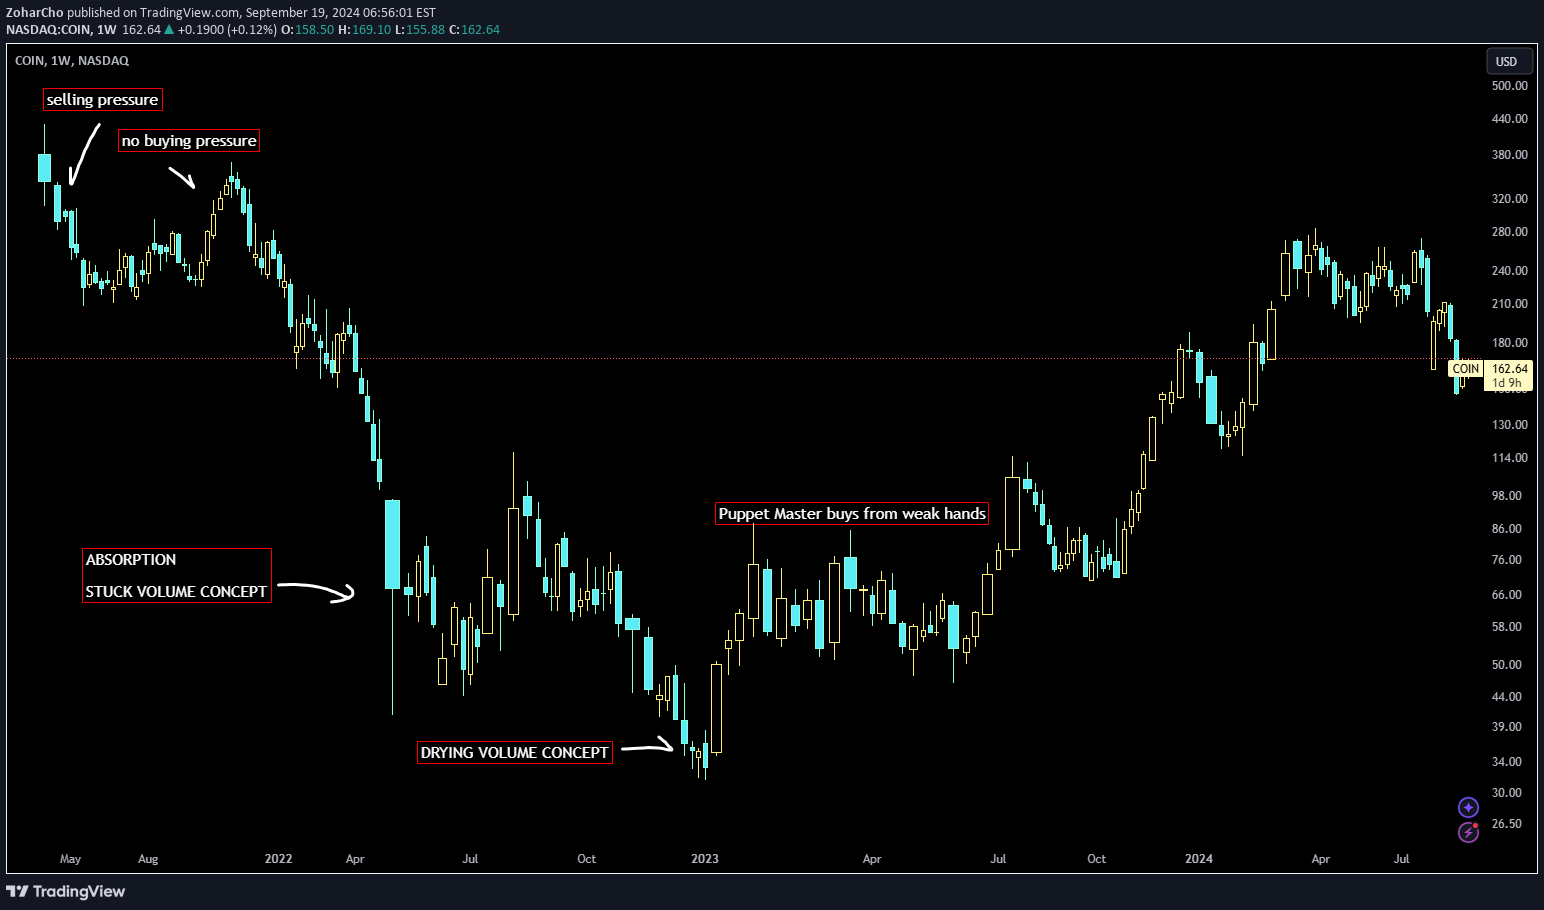
Volume Candles are a great chart type you can use to integrate volume analysis into your trading. TradingView is a superb platform that offers this chart type in real-time, so you can immediately get a completely different feel of what the market is actually doing. As an experienced trader, understanding volume candles is crucial in getting a deeper insight into market dynamics. Unlike standard candlestick charts, which focus primarily on price movement, volume candles combine price action with the strength of trading activity (volume). This offers a unique perspective that can give you an edge in reading market sentiment and momentum. What Are Volume Candles? Volume candles are modified candlestick charts where the width of the candle is proportional to the trading volume during the corresponding time period. The typical candlestick elements—open, high, low, and close prices—are still present, but the volume aspect adds an additional layer of information, enhancing the clarity of price action. Key Features of Volume Candles: Height: Represents price movement (just like in regular candlesticks). Width: Indicates the volume of trades within that period. Unique Information You Can Extract from Volume Candles: 1. Volume-Driven Price Action Volume candles show how much trading interest exists at various price levels. When you observe a large volume candle, it tells you that a lot of market participants were active at that price. Conversely, a thin candle signals lower activity. This helps you: A. Identify levels where strong participation occurs (institutional players what I call the puppet master). B. Spot consolidation zones where volume is low, which often precedes significant price moves. 2. Momentum Confirmation High-volume candles that align with price trends suggest strong momentum. Wide Bullish Candles: If you see a wide up candle during an uptrend, it indicates that the buying pressure is backed by solid volume. This gives more credibility to the uptrend and hints at a continued move upward. Wide Bearish Candles: Similarly, a wide down candle during a downtrend signals strong selling pressure. Volume Candle Chart can also be used for day trading purposes where you need to act FAST. This TradingView chart type is extremely good so you don't need to compare the traditional volume bars on the bottom of the chart. IMPORTANT: You must understand the puppet master mentality, which gives you context. *** EXTRA: You can use this theme color.
Disclaimer
Any content and materials included in Sahmeto's website and official communication channels are a compilation of personal opinions and analyses and are not binding. They do not constitute any recommendation for buying, selling, entering or exiting the stock market and cryptocurrency market. Also, all news and analyses included in the website and channels are merely republished information from official and unofficial domestic and foreign sources, and it is obvious that users of the said content are responsible for following up and ensuring the authenticity and accuracy of the materials. Therefore, while disclaiming responsibility, it is declared that the responsibility for any decision-making, action, and potential profit and loss in the capital market and cryptocurrency market lies with the trader.