
Zickey_11
@t_Zickey_11

What symbols does the trader recommend buying?
Purchase History
پیام های تریدر
Filter
Zickey_11
آماده پرواز! تحلیل طلا (XAUUSD): سیگنال صعودی قدرتمند با هدف ۴۰۳۰ دلار
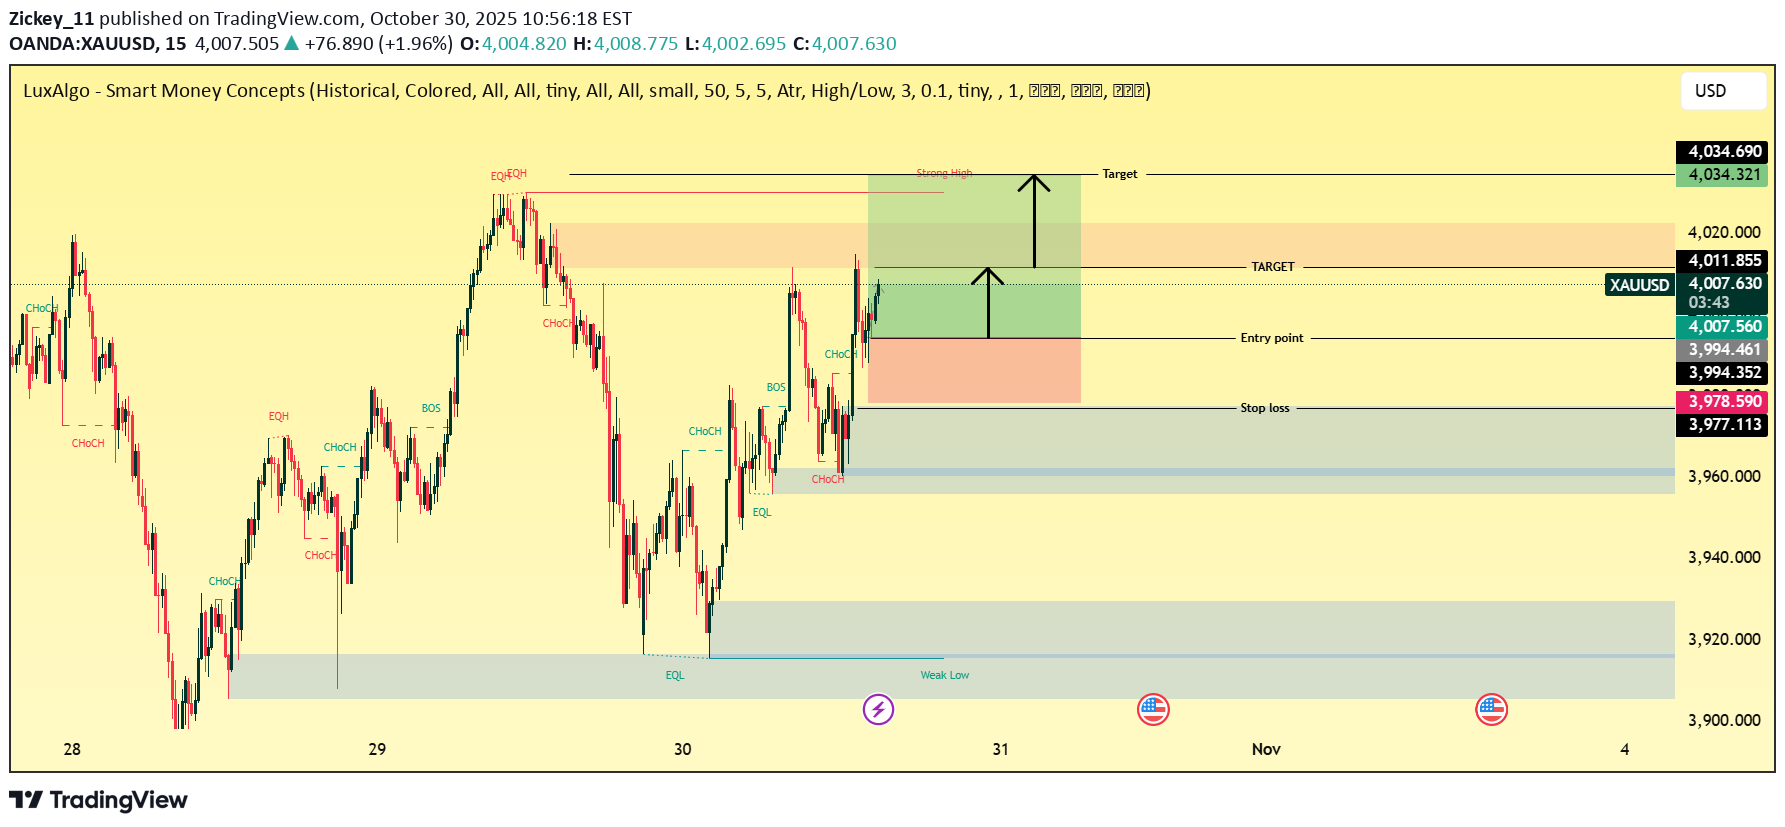
Entry Point: Around 3,994 – 4,000 USD — where price retested the demand zone after BOS. Stop Loss: Below 3,978 USD, just under the last higher low to protect from fakeouts. Target Zone 1: Around 4,011 USD — short-term resistance and first liquidity area. Target Zone 2: Around 4,034 USD — strong supply zone and next liquidity pool (EQH zone). Smart Money Concept (SMC) Insights: Liquidity Sweep: The chart shows that equal lows (EQL) were swept before bullish structure formed — a common SMC pattern indicating accumulation. Fair Value Gap (FVG): Price may fill a small imbalance before continuing higher. Strong High Zone: Around 4,034, which could act as the final liquidity target before a potential pullback. Trade Idea: Setup: Bullish continuation after market structure shift. Risk/Reward: Approximately 1:3 R/R ratio. Bias: Bullish as long as price holds above 3,978 – 3,980 zone.
Zickey_11
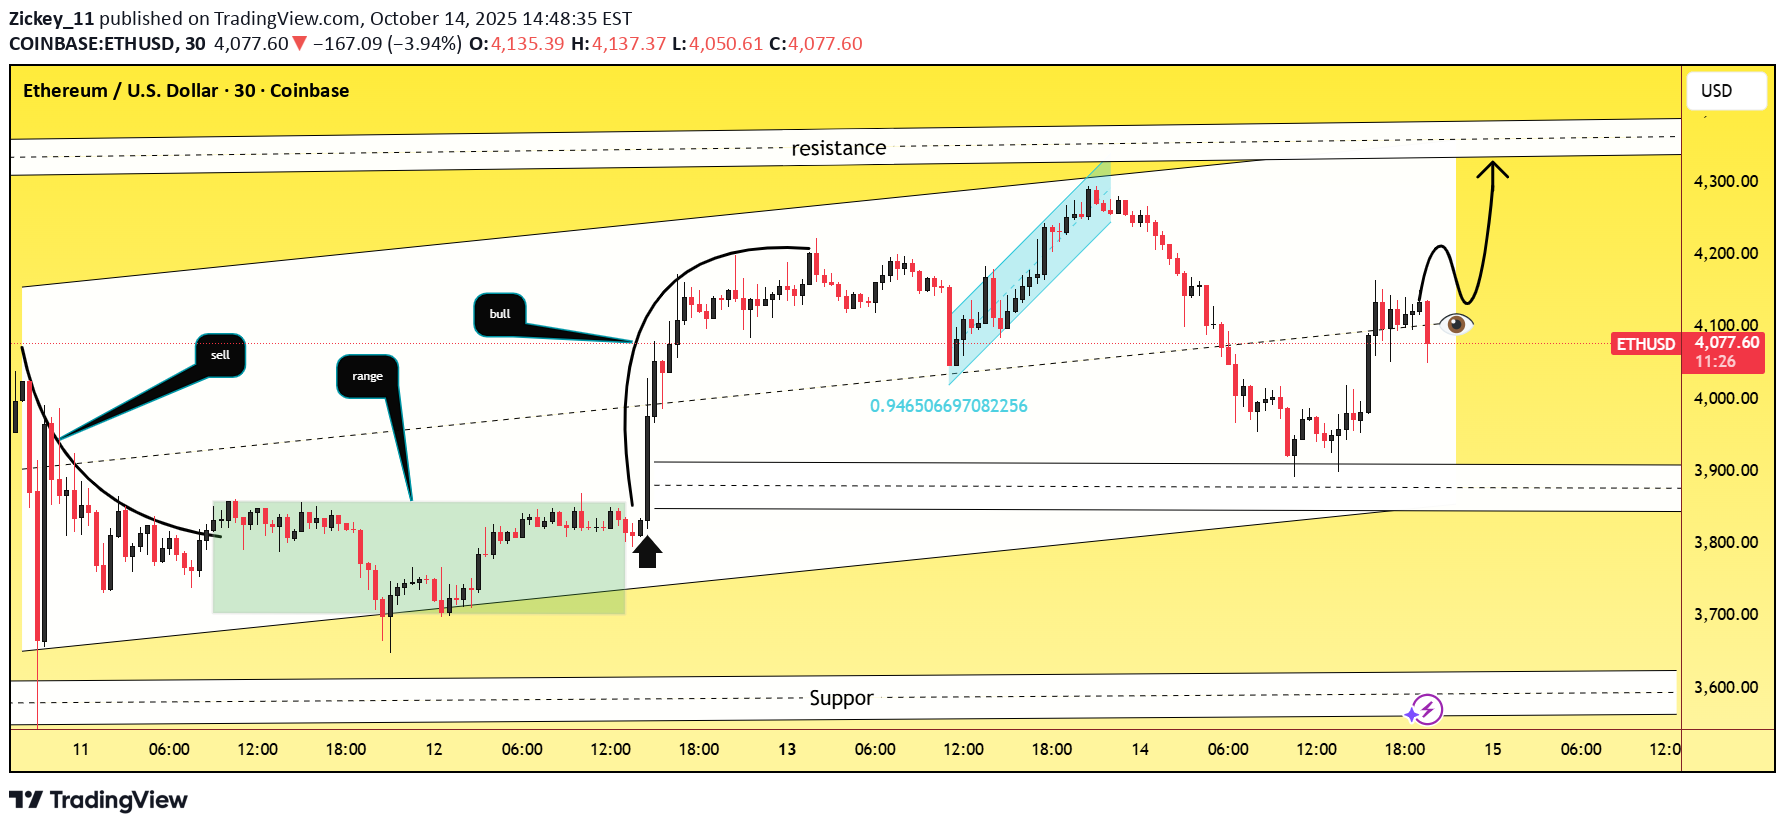
اتریوم آماده شکست مقاومت کلیدی: هدف بعدی ۴۵۰۰ دلار!
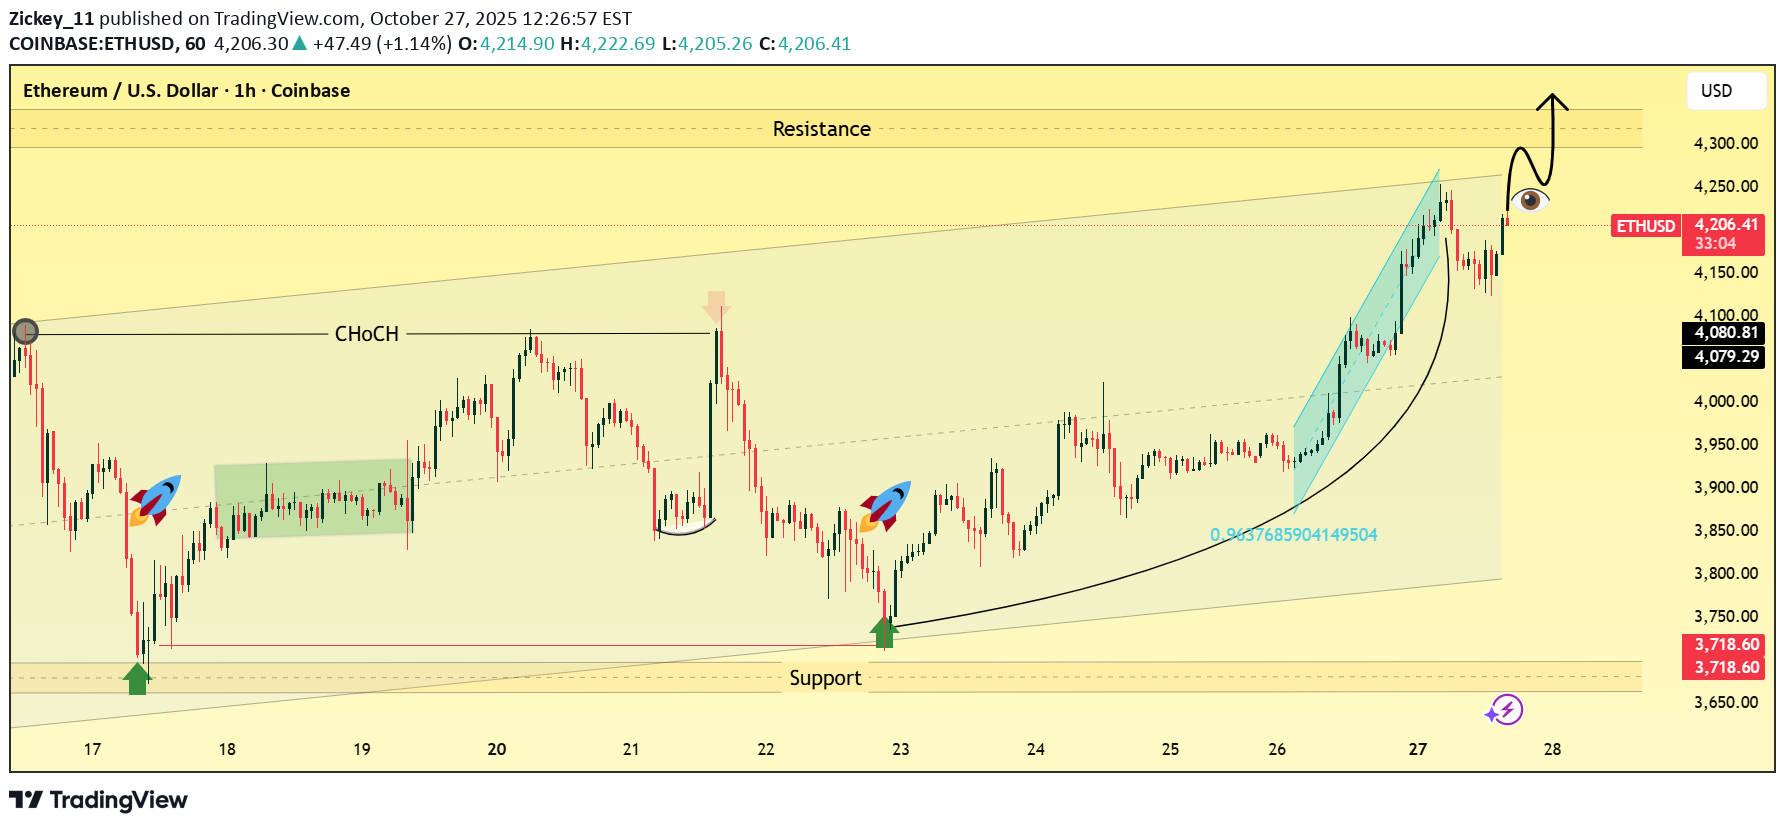
Technical Analysis: Market Structure: Ethereum has shown a clear change of character (CHoCH) around the $4,080 level, confirming a bullish shift in structure after consolidating for several sessions between $3,900 and $4,100. Trend: The pair is now in a strong ascending channel, with a clear parabolic curve supporting the recent rally. Price action has been consistently forming higher lows, indicating healthy momentum from buyers. Support Zone: Primary Support: $3,700 – $3,750 Intermediate Support: $4,050 – $4,080 These areas are key for potential pullbacks before further continuation upward. Resistance Zone: The main resistance lies at $4,280 – $4,330, marked by previous structural highs and supply zone rejection. A clean break and retest above $4,330 could open the path toward $4,450 – $4,500. Momentum & Volume: The bullish impulse leg highlighted in blue shows strong momentum with minimal retracement, suggesting institutional participation or aggressive buying pressure. Projection: Short-term expectation is a minor pullback around $4,200 – $4,150, followed by another push upward toward the resistance zone ($4,300 – $4,350).
Zickey_11
تأیید صعود بیت کوین: آماده جهش به سمت ۱۲۱ هزار دلار؟
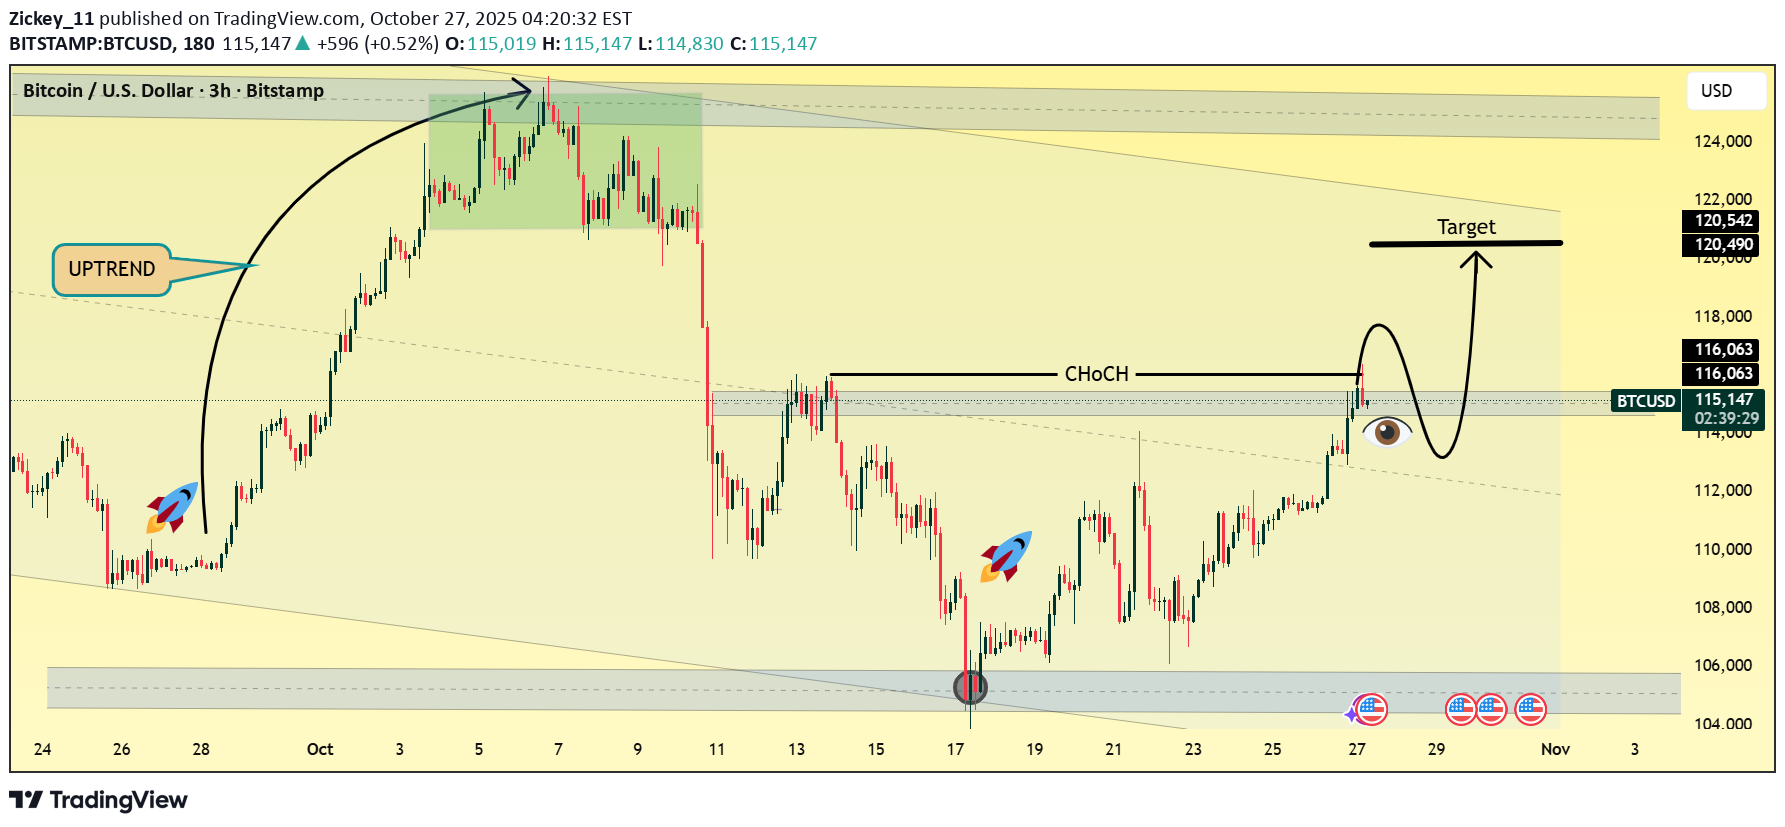
Technical Analysis (3H Chart) 1. Market Structure: The chart shows a clear uptrend phase earlier, followed by a corrective pullback. Recently, Bitcoin has formed a Change of Character (CHoCH), indicating a potential shift back to bullish momentum after the correction. Price has broken key resistance around $114,500–$115,800, confirming short-term bullish strength. 2. Key Zones: Support Zone: $110,000–$112,000 (previous consolidation area; strong liquidity zone). Resistance / Target Zone: $120,000–$121,000 (major supply area & top of descending channel). 3. Current Price Action: BTC is currently testing the CHoCH breakout area (~$115,000–$116,000). A minor pullback (retest) toward the breakout level is expected before another bullish leg begins. The “eye” symbol suggests monitoring this retest for a long entry confirmation. 4. Target Projection: If the breakout retest holds, the next target lies near $120,500, aligning with previous highs and upper trendline resistance. 5. Technical Outlook: ✅ Bias: Bullish (short to medium term) 📈 Entry Zone: $114,800–$115,500 (retest zone) 🎯 Target: $120,000–$121,000 🛑 Invalidation: Below $113,000 (structure break)
Zickey_11
سقوط طلا (XAU/USD): راز تشکیل سقف دوقلو و هدف نهایی کجاست؟
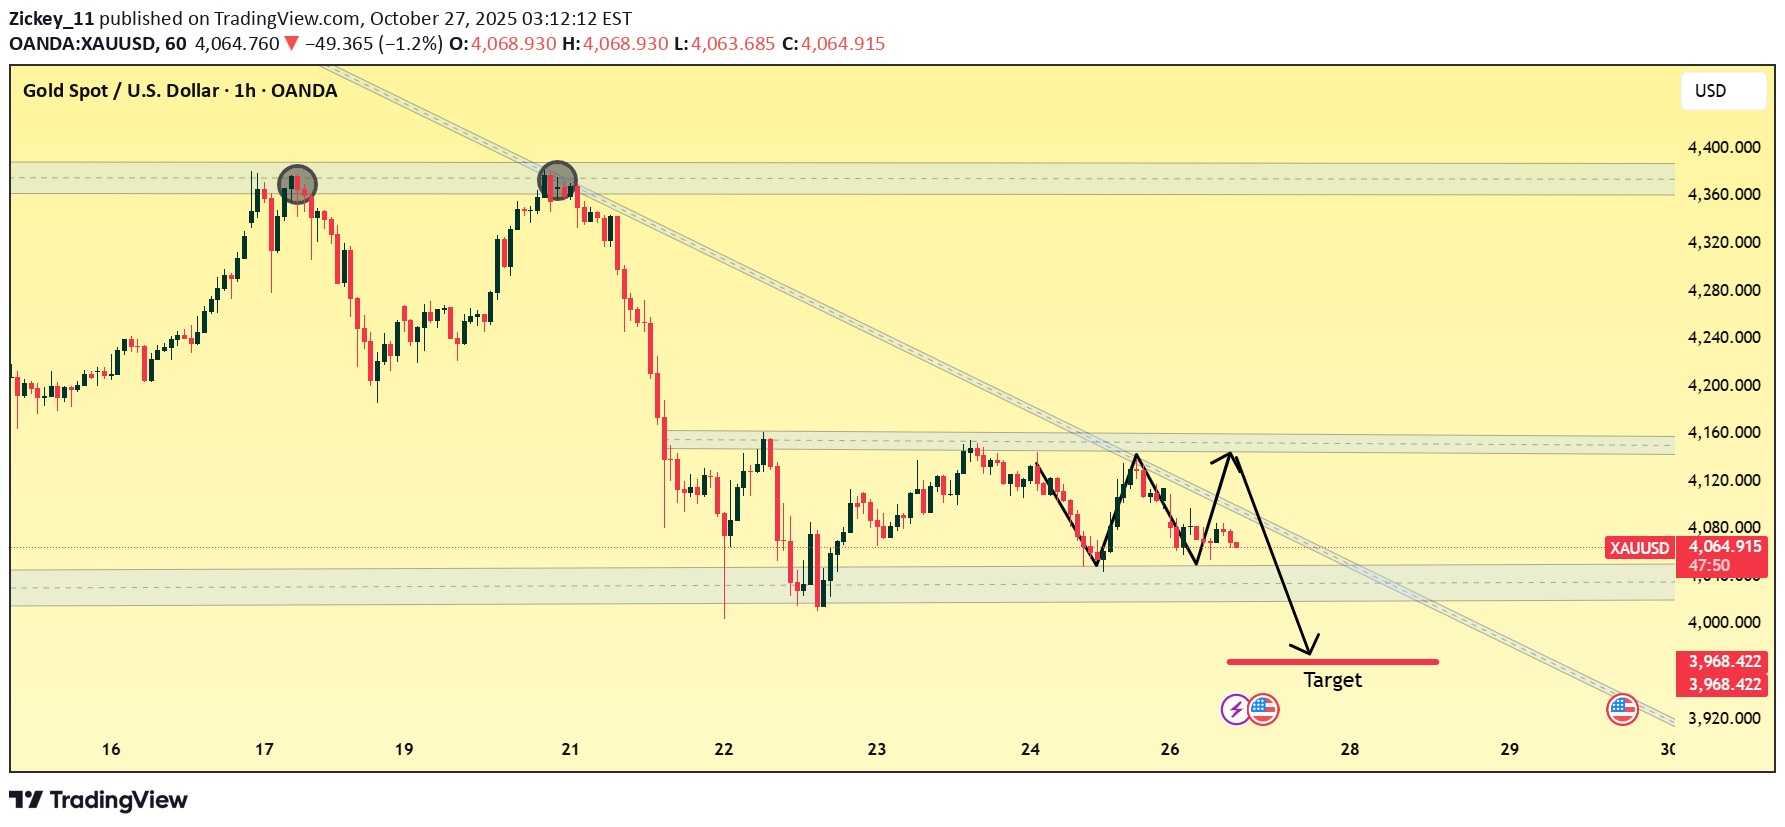
🧩 Key Observations: 1. Double Top Formation Two clear peaks around 4160–4180 zone (marked circles). This confirms strong resistance and a potential reversal zone. 2. Trendline Resistance A descending trendline from previous highs keeps price suppressed. Every retest of this line has led to rejection — confirming bearish control. 3. Bearish Structure Lower highs and lower lows clearly visible → consistent with downtrend. Recent pullback appears corrective before another potential drop. 4. Projected Move (Arrow Path) The arrow suggests a short-term retracement to ~4120–4150 zone (trendline + resistance confluence). Then, a continuation down toward the target zone near 3968–3980. 5. Support & Target Levels Immediate Support: 4040–4050 Main Target: 3968–3980 (shown on chart) Major Resistance: 4160–4180Gold Market Has Started Falling Time is nearer to Achieve The Targettarget completed
Zickey_11
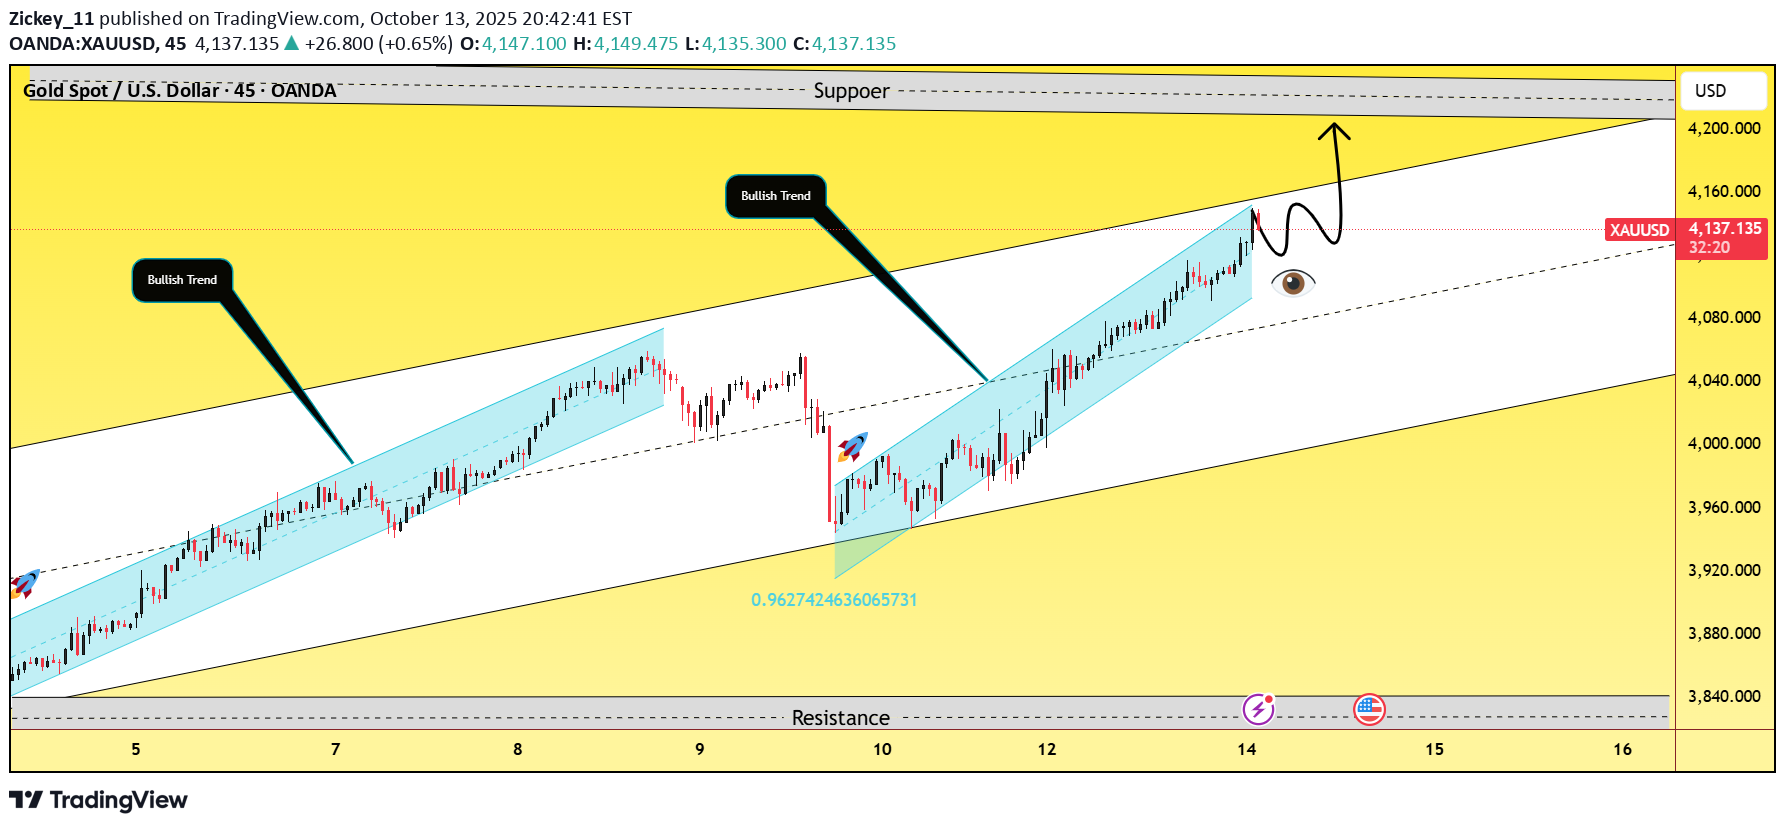
طلا در آستانه حمله مجدد به ۴۲۷۰ دلار: استراتژی شکست و بازآزمایی را از دست ندهید!
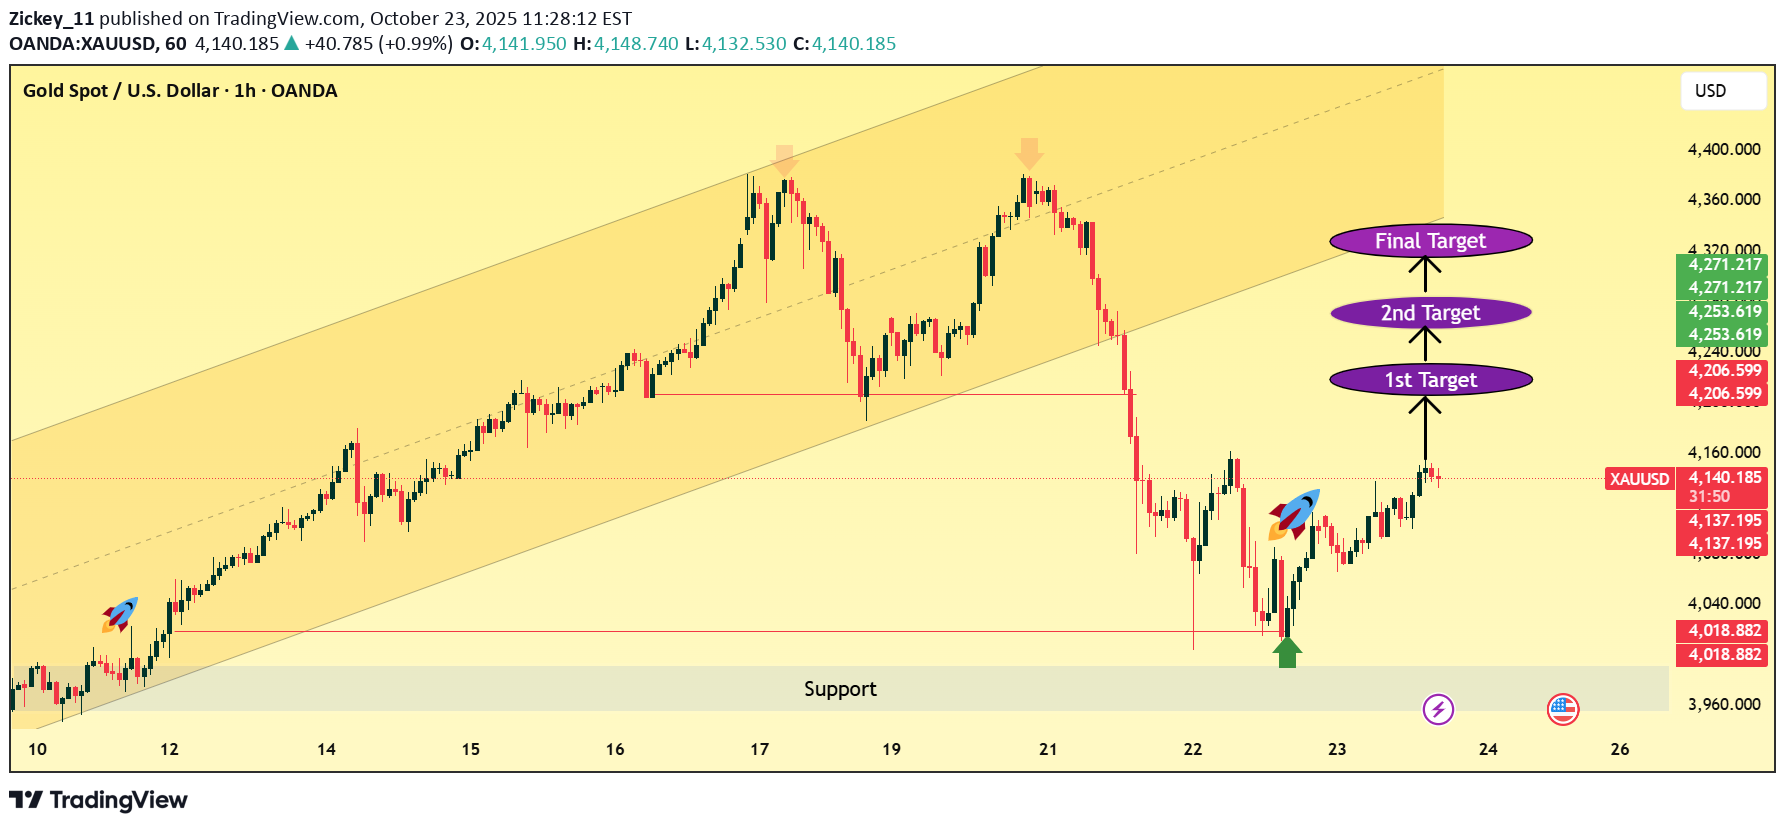
Overall Structure The chart shows a rising channel pattern (ascending parallel channel) that gold had been trading within for several days. Recently, price broke below the channel, found support, and is now retracing upward toward potential resistance levels. 🧭 Key Observations 1. Trend Context Previous trend: Bullish, as seen from the steady higher highs and higher lows inside the yellow channel. Recent move: Sharp bearish breakout below the channel, followed by a strong recovery bounce. Current structure: Gold is attempting to retest the lower boundary of the broken channel — a common “break and retest” setup. 2. Support Zone The green arrow marks the support zone around $4,018–$4,040, where the last drop reversed sharply. This area held as strong de… 📊 Trading Outlook Bias: Short-term bullish recovery within a medium-term corrective structure. Buy zone: Above $4,140–$4,150 with confirmation candle. Targets: $4,206 / $4,253 / $4,271. Stop-loss: Below $4,100 (for short-term trades).
Zickey_11
Trend: Strong uptrend within a rising channel Key Zones: Resistance: $4,350 – $4,400 Support: $4,050 – $4,100 Major Demand Zone: $3,950 – $4,000 Analysis: 1. Uptrend Confirmation: Gold is trading inside a clear ascending channel, consistently forming higher highs and higher lows. Momentum remains bullish, supported by strong impulsive candles. 2. Resistance Reaction: Price recently touched the upper boundary (resistance zone) near $4,350 – $4,400 and faced rejection. This is a natural pullback zone as buyers take profits. 3. Possible Pullback Setup: The current short-term correction appears healthy within the trend. Price may retest mid-channel support or the $4,200 area before continuing upward. 4. Bullish Continuation Expected: As long as price stays above $4,100, the uptrend structure remains intact. A bounce from the current or lower support levels could push gold toward $4,400 – $4,450 again.Blue Lines Became Havier On The Chart Market flew towards $4380 And Target Achieved With 1280+ Pips Profit
Zickey_11
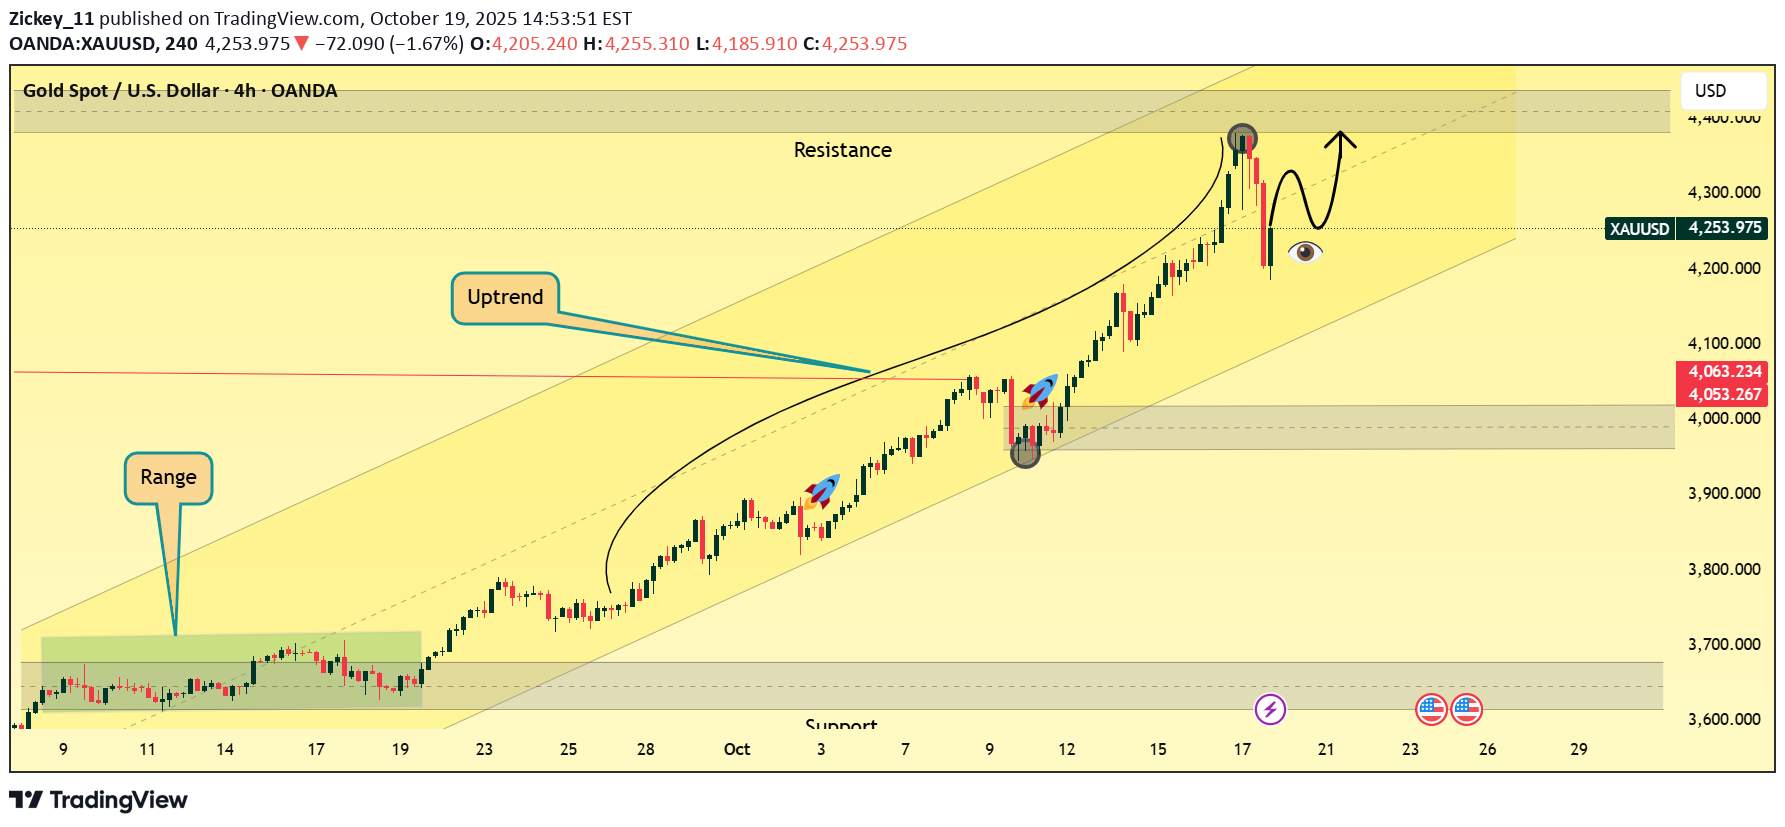
اصلاح نزولی طلا: سقوط به کدام منطقه حمایتی؟
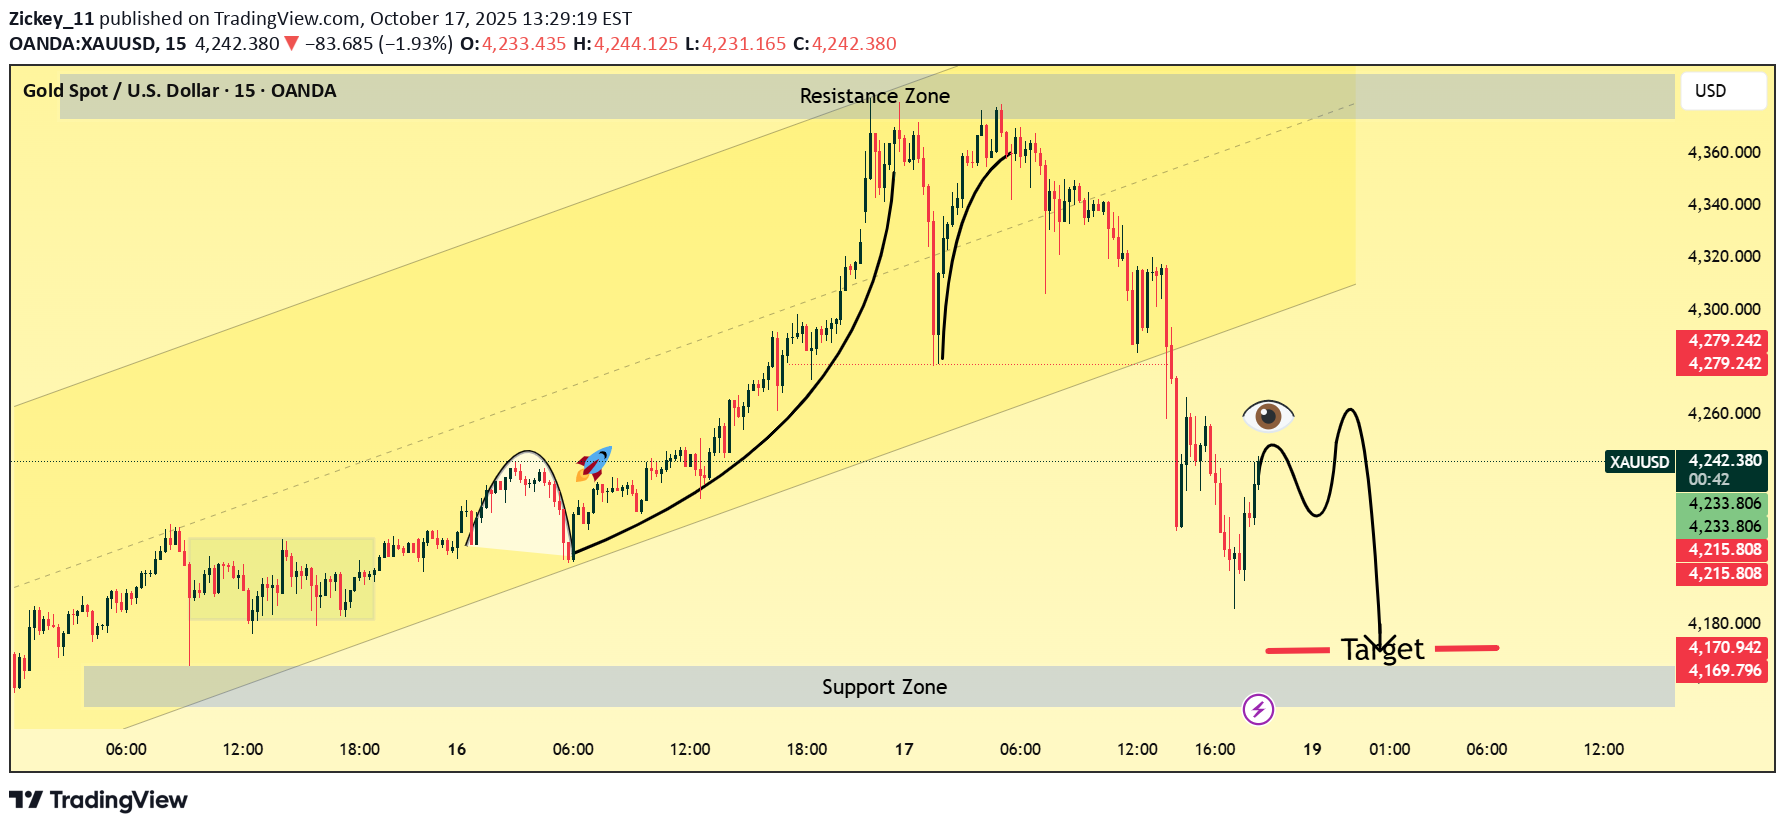
Chart Overview: Timeframe: 15-minute Price Range: 4,170 – 4,360 USD (visual scale) Current Price: 4,240 USD Trend Channel: Uptrend channel (yellow) with a recent breakdown from the midline. 🧠 Technical Analysis: 1. Previous Move: Gold experienced a strong bullish run within an ascending channel, reaching the resistance zone near 4,360. The momentum formed a rounded top pattern, signaling potential exhaustion of buyers. 2. Pattern Development: A head-and-shoulders–like formation is visible at the top of the structure. Price broke below the neckline and tested lower support near 4,215 before rebounding slightly. 3. Current Structure: Price is retesting the broken support (now resistance) area near 4,260. The black curve projection shows a potential lower high forming — a bearish continuation setup.
Zickey_11
صعود طلا (XAUUSD) به کجا میرسد؟ مسیر رسیدن به قیمت ۴۴۵۰ دلار!
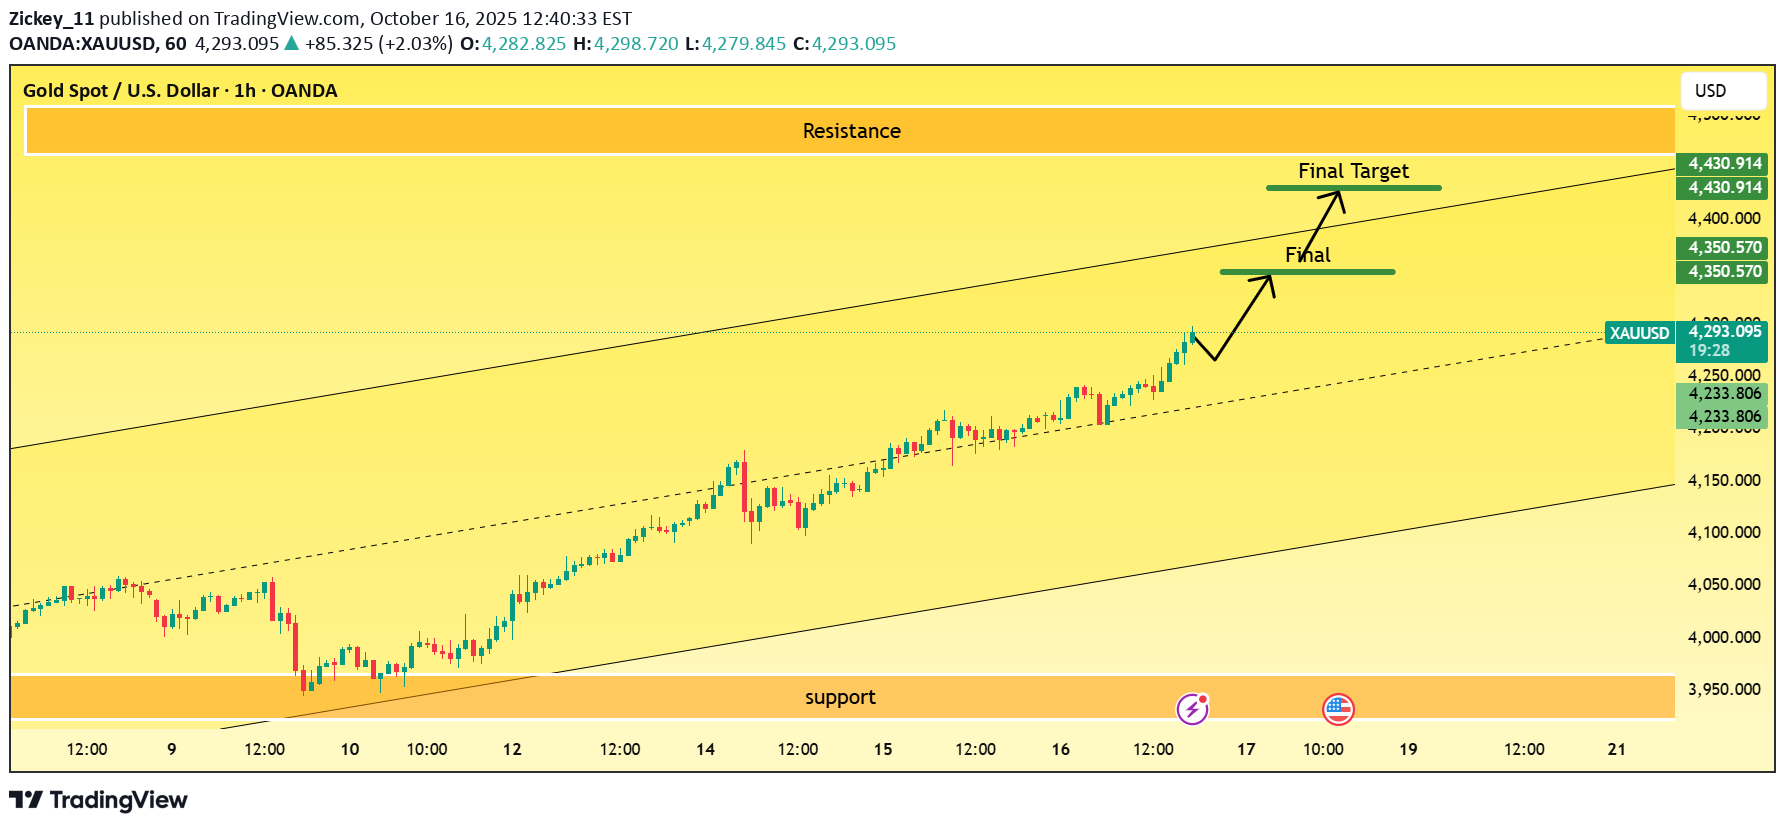
Technical Overview Current Price: $4,292.85 Support Zone: $4,000 – $4,050 Resistance Zone: $4,450 – $4,500 Trend: Bullish (ascending channel) 🔹 Chart Analysis The price is moving steadily inside the upward channel, respecting both upper resistance and lower support trendlines. A short-term retracement may occur near the $4,350 zone (first target), aligning with mid-channel resistance before continuing toward the final target around $4,432–$4,450. The market shows strong bullish candles, confirming buying pressure with limited corrective dips. The support base near $4,150 remains strong — as long as this zone holds, the bullish trend is expected to continue. 🔹 Price Targets First Target: $4,350 Final Target: $4,432 – $4,450 Stop-Loss (if trading): Below $4,200 (trendline support)gold is flying like rocket its an unlimited hitting on my first target of my analysis.
Zickey_11
اتریوم به سوی ۴۲۰۰ دلار: آیا مسیر صعودی ادامه مییابد؟
Ethereum (ETH/USD) Bullish Continuation Towards 4,200 Resistance Ethereum is showing a strong bullish recovery pattern after rebounding from the lower trendline support around the $3,900–$4,000 zone. The chart structure indicates a clear phase transition: 1. Previous Phases: Sell Zone: Initial downward move from overbought levels. Range Zone: Period of consolidation where price accumulated strength. Bull Phase: Breakout from the range with strong bullish candles confirming renewed buying interest. 2. Current Market Behavior: ETH is now trading near $4,130, testing a mid-level resistance area. A slight pullback or minor correction is possible before the next upward move. The eye symbol and curved arrow suggest the market is gathering momentum for another push higher. 3. Key Levels: Support Zone: $3,850 – $4,000 (strong demand area; previous breakout base) Immediate Resistance: $4,200 – $4,250 Major Resistance: $4,300 – upper channel boundary 4. Bullish Scenario: If ETH holds above $4,000 and breaks $4,200, we can expect a continuation toward $4,300+, confirming bullish dominance within the ascending channel. 5. Bearish Risk: A break below $3,950 could invalidate the bullish structure and send ETH back toward $3,800–$3,600 support levels. 📈 Outlook: Ethereum remains bullish in the short term as long as price action stays above $4,000. Traders may look for buying opportunities on dips targeting $4,200–$4,300. Summary: ➡️ Trend: Bullish continuation ➡️ Buy Zone: $4,000–$4,050 ➡️ Targets: $4,200 → $4,300 ➡️ Support: $3,850–$3,950
Zickey_11
طلا آماده شکست مقاومت؛ هدف بعدی کانال صعودی ۴۲۰۰ دلار کجاست؟
Gold (XAU/USD) is currently trading around $4,146, continuing its bullish trajectory within a well-defined ascending channel on the 45-minute chart. The price action shows consistent higher highs and higher lows, confirming a strong uptrend. 🔍 Key Observations: Trend: Clear bullish trend as price respects the channel boundaries, with momentum increasing after each pullback. Support Zone: Around $4,000 – $4,050, aligning with the lower boundary of the channel — a key area to watch for potential buying interest. Resistance Zone: Near $4,180 – $4,200, where the price may face short-term selling pressure or consolidation. Momentum: Price is riding the upper half of the channel, indicating strong bullish sentiment and potential for continuation toward new highs. Volume/Momentum Indicator (implied): The consistent upward slope suggests sustained buyer strength with limited correction depth. 📈 Outlook: If gold sustains above $4,100, bulls could target $4,200 – $4,250 next. A break below $4,080 (channel support) might signal a short-term correction toward $4,000, but the overall bias remains bullish unless the lower trendline is decisively broken. 🧭 Summary: Bias: Bullish Immediate Target: $4,200 Support: $4,000 – $4,050 Resistance: $4,180 – $4,250lets get the enjoyed with market gold market is moving wonderfully according to my analysis market hit my target 4200 and 620+ pips completed successfully.
Disclaimer
Any content and materials included in Sahmeto's website and official communication channels are a compilation of personal opinions and analyses and are not binding. They do not constitute any recommendation for buying, selling, entering or exiting the stock market and cryptocurrency market. Also, all news and analyses included in the website and channels are merely republished information from official and unofficial domestic and foreign sources, and it is obvious that users of the said content are responsible for following up and ensuring the authenticity and accuracy of the materials. Therefore, while disclaiming responsibility, it is declared that the responsibility for any decision-making, action, and potential profit and loss in the capital market and cryptocurrency market lies with the trader.