Technical analysis by Zickey_11 about Symbol PAXG: Sell recommendation (10/17/2025)

Zickey_11
اصلاح نزولی طلا: سقوط به کدام منطقه حمایتی؟
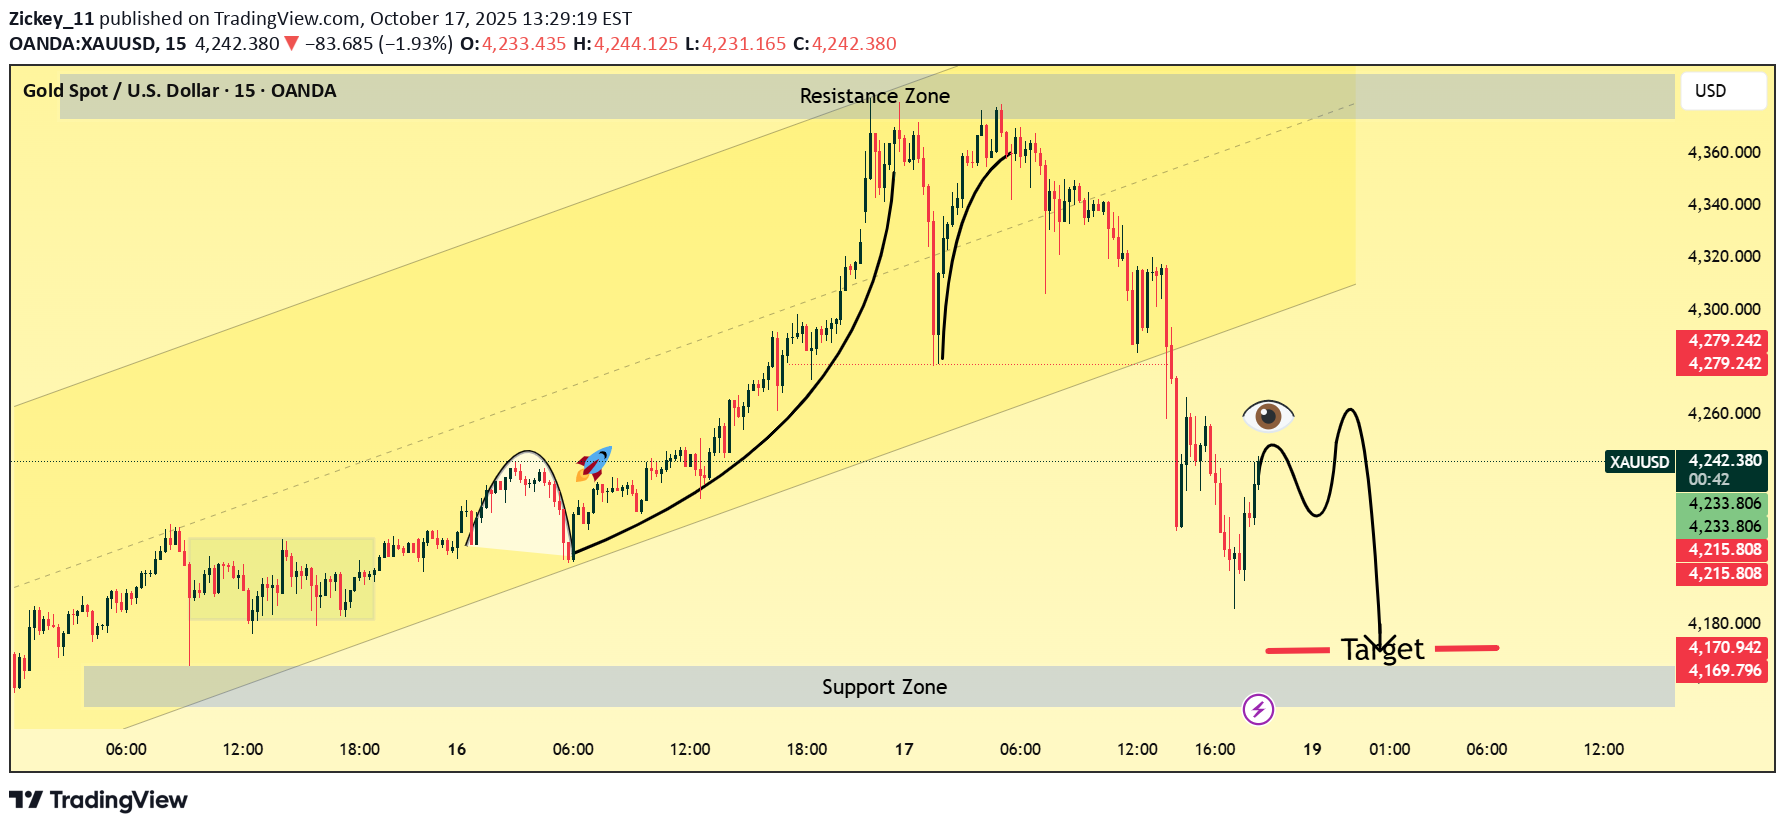
Chart Overview: Timeframe: 15-minute Price Range: 4,170 – 4,360 USD (visual scale) Current Price: 4,240 USD Trend Channel: Uptrend channel (yellow) with a recent breakdown from the midline. 🧠 Technical Analysis: 1. Previous Move: Gold experienced a strong bullish run within an ascending channel, reaching the resistance zone near 4,360. The momentum formed a rounded top pattern, signaling potential exhaustion of buyers. 2. Pattern Development: A head-and-shoulders–like formation is visible at the top of the structure. Price broke below the neckline and tested lower support near 4,215 before rebounding slightly. 3. Current Structure: Price is retesting the broken support (now resistance) area near 4,260. The black curve projection shows a potential lower high forming — a bearish continuation setup.