
Z4F4R
@t_Z4F4R

What symbols does the trader recommend buying?
Purchase History
پیام های تریدر
Filter
Z4F4R
Solana (SOL) Holds Key Support – Is a Reversal in Sight?
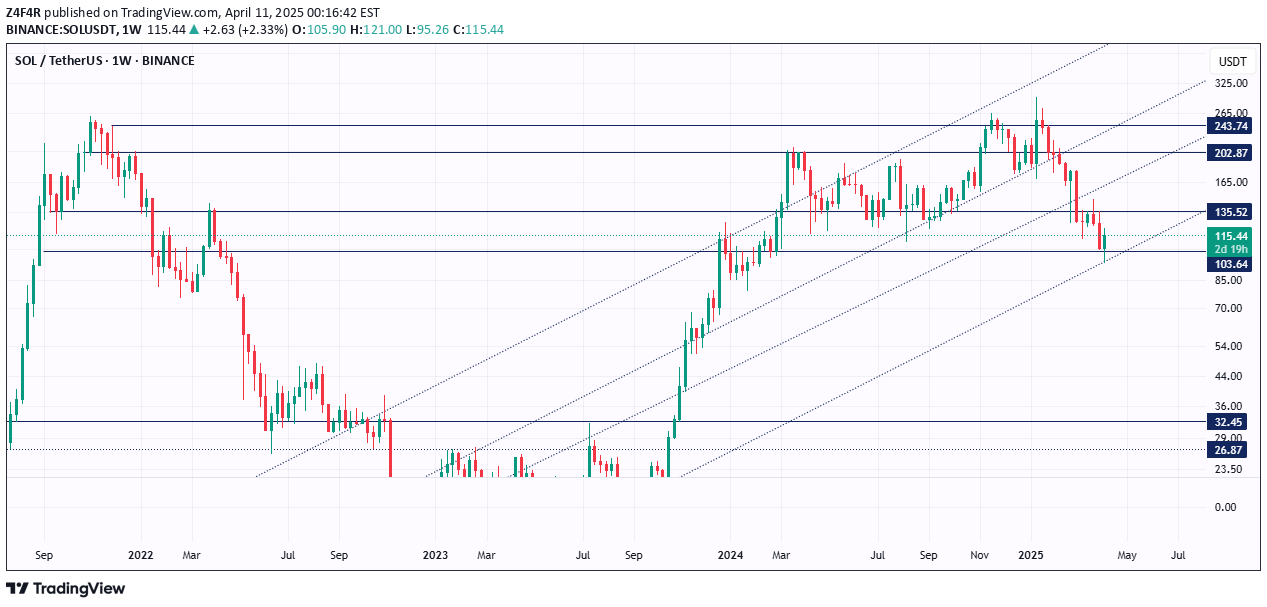
As of April 11, 2025, Solana (SOL) is showing signs of life after a sharp pullback from its 2024 highs. The weekly chart reveals a crucial technical development as the price rebounds from a major support zone around $103.64, gaining over 8.8% this week to trade at $115.26.This level has historically acted as strong support, and the recent bounce suggests that buyers are stepping in to defend it once again. SOL is also testing the lower boundary of a long-standing ascending channel, which has guided price action since early 2023. A continued bounce here could reignite bullish momentum.However, for bulls to regain full control, the price must reclaim $135.52, the next major resistance level. A successful breakout above that could open the doors to higher targets at $165 and even $202 in the coming weeks.On the flip side, if the $103 support fails and the price closes below the channel, it could signal a breakdown toward the $85 region—or worse, a revisit of long-term demand zones between $50–$70.In summary, Solana is at a technical crossroads. The coming weeks will be critical in determining whether this bounce evolves into a full reversal or just a temporary relief in a broader downtrend.Join us in building a vibrant crypto and blockchain community! Engage in discussions, share insights, and like posts to contribute.https://bitrr.io
Z4F4R
Bitcoin’s breakout above $73,000, target of $75,000 to $77,000

Here's a technical analysis based on your Bitcoin (BTC/USD) chart:1. **Current Price and Key Levels**: - **Current Price**: Bitcoin is trading around $72,595. - **Breakout Level**: The price recently broke through the $73,000 resistance level, indicating a strong upward momentum. - **Support Levels**: Key support levels are visible around $66,593 and $54,896.2. **Trend Analysis**: - Bitcoin is in an uptrend channel, with higher highs and higher lows forming. - The breakout above the $73,000 resistance signals potential bullish continuation.3. **Target Levels**: - **Short-term Target**: Based on the channel and breakout, the next target range is around $75,000 to $77,000.4. **Stochastic RSI**: - **Current Stochastic RSI Level**: The Stochastic RSI is around 67.25, showing that it is nearing the overbought zone. - If the Stochastic RSI enters the overbought zone, it may indicate a potential pullback or consolidation.5. **Volume**: - The net volume is relatively low, suggesting that the breakout might need more volume support for a sustainable uptrend.Summary:Bitcoin’s breakout above $73,000 indicates bullish momentum with a possible target of $75,000 to $77,000. However, watch for overbought signals in the Stochastic RSI, which may indicate a pullback. Maintaining support above $66,593 will be crucial for the bullish trend to continue.The initial target of $75,000 has been met. If the weekly close remains above $73,000, it is reasonable to anticipate that the Bitcoin could reach between $90,000 and $95,000 in the upcoming weeks.Bitcoin has successfully hit the anticipated target of $77,000!On November 8th, I predicted that Bitcoin would reach $95,000 to $97,000. If the momentum continues unabated, Bitcoin could climb to between $103,000 and $125,000.
Z4F4R
FTM Rebound After Finding Support, a buy opportunity.
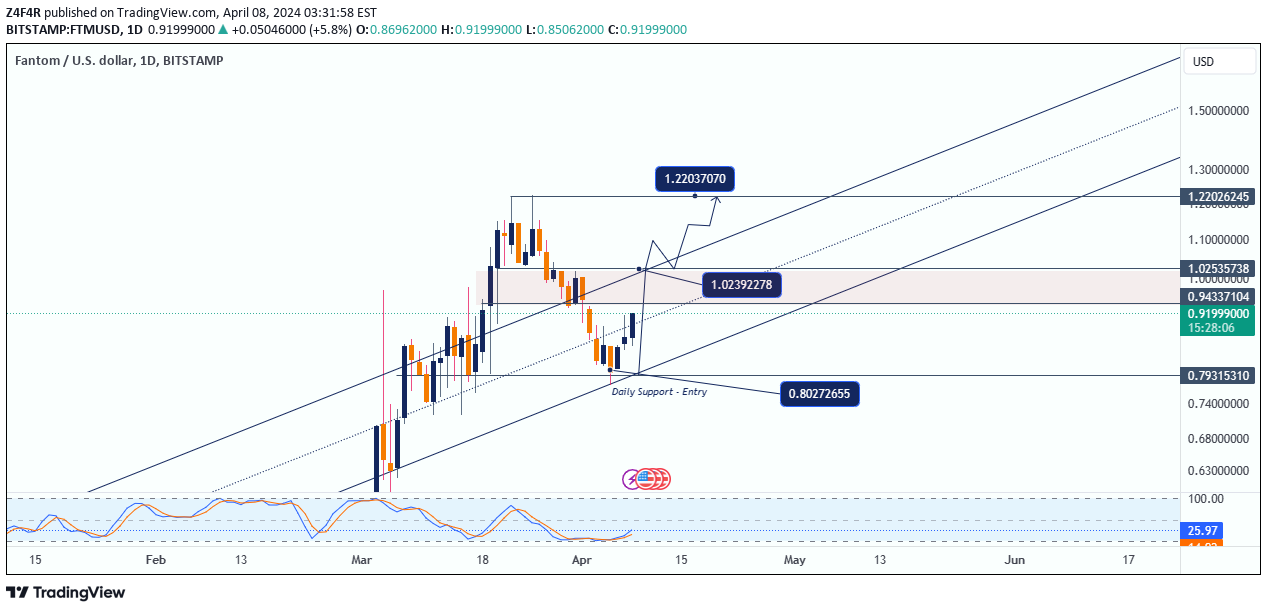
Fantom (FTM) bulls may be catching their breath after a recent price dip. FTM found support at $0.80 on the daily timeframe chart, following a fall from a high of $1.22. If FTM breaks above the current resistance, key levels to watch include:First Resistance: $0.94 - A successful breakout above this level could indicate further bullish momentum.Second Resistance: $1.023 - Surpassing this resistance could be a significant step towards revisiting the previous high of $1.22.Price fallen after my second resistance prediction $1.023Find support on daily trend line pattern at $0.57 Price will be back-and-forth range between $0.60 to $0.80 (as $0.72 > $0.80 resistance)FTM is exhibiting positive indicators, with a breakout above $0.94 potentially driving the price to $1.90.Bullish or bearish? The price is currently at weekly support and could rebound if the cryptocurrency market exhibits a high net inflow.As outlined in my previous post, I demonstrated that if the support price of $0.62 failed, it would drop to between $0.50 and $0.48. The support target of $0.48 has been reached.
Z4F4R
POLYX Bullish Trends and Key Levels: A Technical Overview

Let's delve into the intricacies of this chart for POLYX/USDT and uncover the story it tells. At first glance, the weekly chart exudes a sense of optimism with a recent upward trajectory that's hard to ignore. The price action is encapsulated within an ascending channel, suggesting a bullish trend with higher highs and higher lows.Key Levels and Trend AnalysisResistance and Support Zones:- **Resistance:** Around 0.5235 USDT, the price has encountered resistance within the upper bounds of the channel. The recent high of 0.7862 USDT marks the pinnacle of this upward move, a crucial level that traders will be eyeing for a breakout.- **Support:** The support level at 0.3170 USDT provides a solid foundation for this upward trend. Should the price experience a pullback, this level is expected to offer significant buying interest.In the chart I reveals that if the volume diminishes, there might be a reversion to the support level, making it a critical area for traders to watch.Technical Indicators**Stochastic RSI:**The Stochastic RSI, currently around 16.16, suggests that the market is in the oversold territory. Historically, these levels have provided lucrative buying opportunities, hinting that we might witness a price surge soon. The blue line crossing above the orange line would further solidify a bullish reversal.**Cumulative Volume Delta (CVD):**The CVD indicator reflects a cumulative value of 126.76M, signaling a balance between buying and selling pressure. A rising CVD often precedes a bullish trend continuation, aligning with our ascending channel narrative.Chart Patterns and ImplicationsThe price has been consolidating within the beige-colored resistance zone, showing hesitation to break higher immediately. This consolidation phase is crucial as it allows the market to gather momentum for the next significant move. If the price can sustain above 0.5235 USDT with increased volume, we could see a retest of the 0.7862 USDT high or even a breakout toward new highs.Conversely, if the volume does not pick up, the price might retrace to the 0.3170 USDT support level or even lower, which coincides with the lower boundary of the ascending channel. This level also aligns with the previous consolidation phase, making it a strong support area.ConclusionIn summary, the POLYX chart is painting a picture of potential and promise. The ascending channel, combined with bullish indicators like the Stochastic RSI and CVD, suggests that the market might be gearing up for another leg higher. However, prudent traders will keep an eye on volume trends and key support levels to navigate any potential retracements.By staying attuned to these technical cues, one can make informed decisions, whether it's capitalizing on a breakout or buying the dip. The market, much like a narrative, evolves and tells its story—those who listen carefully are often the ones who reap the rewards.
Z4F4R
A Promising Uptrend for LQTY

The recent performance of LQTY/USDT suggests an optimistic outlook, marked by significant bullish momentum. Currently trading at $1.337, LQTY has made a substantial gain of 15.26% in the latest week, signaling a strong recovery from recent lows. In this chart, I have revealed several key technical levels and patterns that traders should consider for potential opportunities.Key Levels and Patterns1. Weekly Support and Breakout: The price bounced off the critical weekly support level at $0.945, which has proven to be a strong foundation for the current uptrend. The recent breakout above $1.235 indicates a bullish reversal and potential for further gains.2. Trendline Breakout: A clear breakout above the descending trendline points to a continuation of the upward movement. This breakout has the potential to propel the price towards the next significant resistance at $1.768.3. Primary Resistance: The primary resistance level stands at $2.163. If the bullish momentum sustains and the price manages to break through the intermediate resistance zone around $1.768, reaching this level is plausible.4. Stochastic RSI: The Stochastic RSI, currently at 31.09, shows a potential for upward movement. It indicates that the market is not yet overbought, leaving room for more upside.5. Cumulative Volume Delta (CVD): The CVD indicator reflects positive buying pressure, with a notable increase to 35.327M. This buying pressure supports the bullish sentiment and enhances the likelihood of continued price appreciation.Bullish OutlookThe technical indicators and chart patterns are aligned, suggesting a promising bullish trajectory for LQTY. With the price breaking significant resistance levels and the indicators supporting further gains, traders should watch for continued momentum. Should the price sustain above the trendline breakout and overcome the resistance at $1.768, the path towards the primary resistance at $2.163 becomes increasingly likely.Important: DYOR before making any investment decision
Z4F4R
UNISWAP Prepares for uptrend, anticipating reaching $17 above

UNISWAP price has been volatile over the past years, with both up and down trends. However, looking at the most recent price action, there could be signs of a short-term uptrend.Support and Resistance:-Several potential support and resistance levels. These are areas where the price may have difficulty breaking through.Support levels are at $7.514, $10.231, and $11.00.Resistance levels are at $12.00, $16.00, $17.615, and $17.733. The area between $12.00 and $17.00 is highlighted as a primary resistance range.IndicatorsThe chart also shows the volume (CVD), which is the amount of UNI that has been traded in a given period. The volume has been increasing recently, which could be a sign of increased volatility.OverallThe technical analysis of this chart is inconclusive at this time. The price has been volatile and there is no clear trend. However, there are some signs that the price could be due for a rebound in the short-term.
Z4F4R
PEOPLE may experience a pullback of up to -50%.

After reaching a weekly resistance, can expect a short liquidation leverage. Data from glassnode shows selling pressure on weekly TF.
Z4F4R
ORDI Rejection

ORDI rejecting from 4-hrs timeframe resistance, failing to break the trendlineSupport can find $45 to $44 in short timeframeORDI has surpassed resistance in the 4-hour timeframe and is currently trading at $52.40. It is expected to reach above $55, which is a daily resistance level.Target reached $55.38 from my initial post price of $47.60ORDI has hit a weekly resistance at $59, and there is a possibility of a price decline if the volume decreases, with an anticipated range pullback to between $55 and $51.Will ORDI cross this daily resistance and move even further up? or it's ready to fall back to $55 to $50
Z4F4R
HIGH found support and ready to pump

Support Level (Entry Point): Around 6.354 USDT. This level has been tested and appears to hold, indicating buying interest around this price.Resistance Levels: There are multiple resistance levels:6.779 USDT | 7.107 USDT | 7.139 USDT | 7.612 USDTRecent candlesticks show some bearish pressure with the price retreating from recent highs, yet finding support around the 6.354 USDT level.Price Targets:1. Immediate Target: 6.779 USDT, which is the first resistance level after the current support.2. Secondary Targets: 7.107 USDT and 7.139 USDT. If the price manages to break through these levels, it may reach the next significant resistance at 7.612 USDT.Bullish Scenario: If the price respects the current support level (6.354 USDT) and bounces back, we can expect a retest of the resistance levels mentioned above.Bearish Scenario: If the price breaks below the support level, the next potential support would be the previous low, which is around 6.000 USDT.
Z4F4R
ALICE Strike - Can it reach $3.20

Alice has experienced a significant price surge due to increased volume over the past few days. Currently, the price is above the resistance level; it remains to be seen whether it will maintain this position or close below the resistance.
Disclaimer
Any content and materials included in Sahmeto's website and official communication channels are a compilation of personal opinions and analyses and are not binding. They do not constitute any recommendation for buying, selling, entering or exiting the stock market and cryptocurrency market. Also, all news and analyses included in the website and channels are merely republished information from official and unofficial domestic and foreign sources, and it is obvious that users of the said content are responsible for following up and ensuring the authenticity and accuracy of the materials. Therefore, while disclaiming responsibility, it is declared that the responsibility for any decision-making, action, and potential profit and loss in the capital market and cryptocurrency market lies with the trader.