
Yaroslav_Krasko
@t_Yaroslav_Krasko

What symbols does the trader recommend buying?
Purchase History
پیام های تریدر
Filter
Yaroslav_Krasko
Stock Market Hits Extreme Oversold Levels — Rebound Already ...
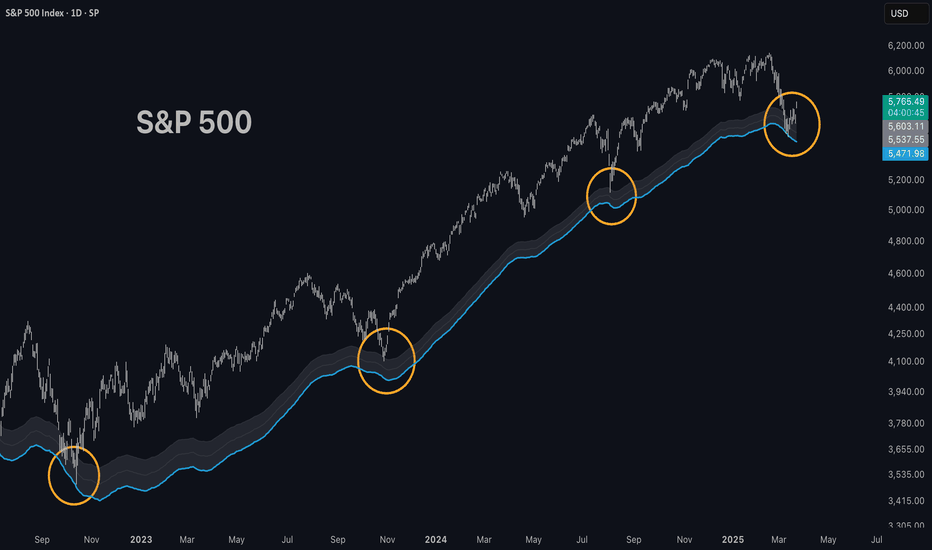
Trump tariffs and other geopolitical events triggered a market correction. But in the bigger picture, this noise means very little. Mathematical models and indicators are pointing to extreme oversold levels. If a recession hasn't started yet — this could be a great opportunity. Even if it has already begun, strong bounces from current levels are possible across many stocks. In fact, some of those bounces are already happening — and we can see that across multiple instruments. Personally, I picked up a few quantum tech tickers like IONQ, which is already up +40%, and added a bit of NVDA. Holding for now.
Yaroslav_Krasko
All Signs Point to Bitcoin Hitting a New ATH in the Next 2 Month

The entire market is currently in fear following the recent crypto correction. But if we take a step back and look at the bigger picture, it’s clear that Bitcoin is still in an uptrend — consistently forming higher highs and higher lows on the macro scale. What we’ve just seen is a typical 30% pullback within the cycle, which is completely normal in crypto. Throughout this cycle, we’ve already witnessed several 20–30% corrections. According to the majority of my systems, the cycle is still ongoing, and I don’t expect it to end before fall 2025. On the chart, I highlighted one particularly interesting metric: Global Liquidity Index. This indicator has been rising for the past two months, and historically, it has shown strong correlation with market performance — although markets tend to react with a slight delay. The logic is simple: more liquidity → money flows into markets → markets rise. From a macro-fundamental perspective, this is a positive signal suggesting that the correction may be coming to an end — and that a new upward phase could be starting soon. 📈 In my opinion, we could revisit previous ATHs and set new ones in the near future. Based on current data, a potential recovery may begin as early as April. This is not financial advice — just sharing my personal view. As for me, I’m currently out of the market, having closed all positions from my algorithmic systems at around $97,500 BTC. Now simply waiting for fresh signals.
Yaroslav_Krasko
Are We at the Start of the Next Altseason?

The chart showcases the Veselka system, which I’ve finally brought to completion. This system helps identify the specific phase of the cycle the cryptocurrency market is currently in. Take note that this system is demonstrated on the chart of one of the oldest altcoins — Dogecoin, whose history dates back to early 2014. As you can see, when the "Are you ready?" phase began, there was a very strong and rapid growth not only in Bitcoin’s chart but also in altcoin charts. In fact, this was the main growth phase for all coins — a very fast and explosive rally often referred to as altseason. If we trust this system and several other models, everything is still going according to plan, and we are currently in this phase, still relatively at the beginning.
Yaroslav_Krasko
Crypto winter is coming! Don’t miss the final rally.

At this point, it’s already possible to see the structures the market operates within, specifically the influence of major market participants: how they accumulate liquidity and set the market trend. Everything follows a pattern: a long 6–8 month consolidation → 1st wave of growth → redistribution + liquidity collection above and below → 2nd wave of growth → another long consolidation → repeat. This generally fits logically into the framework of this cycle, both in structure and timing. The main target of this cycle — $140,000 — has not yet been reached. The market almost never exits an accumulation phase with just one growth wave. There’s a high probability that this will repeat once more: a second wave of growth to $140,000, followed by a six-month range until the end of summer, possibly in the form of an ascending structure, such as a wedge, potentially even reaching $173,000. During this time, there will be distribution. This will take a while since big players need time to exit via retail. Selling to retail is most effective when there’s hype in the market. Exits may also occur through altcoins, as has happened before. Therefore, there’s still a chance that altcoins will surge during this period, creating the biggest market hype. Just some market thoughts for now. Let’s keep observing. DYOR.So far, the markets remain in anticipation. Everything is still within the structure I showed not too long ago. The beginning of the year is often accompanied by a price pullback, so the scenario of liquidity being collected below the channel is still relevant. Today, I’d like to show where the price might go if this happens. Indicators that highlight strong support zones can help us here. The first zone is local and dynamic, but for now, it’s worth paying attention to the $89,000 level. I also demonstrated another indicator and how the price reacted to it in the past. In the case of a quick squeeze, this could be a potential level where the price might settle. $89,000 seems to be the more likely level. I believe the first quarter of 2025 will show very strong growth for both Bitcoin and altcoins. Of course, I could be wrong, but my expectations for the end of this cycle are exactly that.Several of my systems have signaled long trades. I’m not sure whether there will be a liquidity grab below the channel under these circumstances or if the price will move upward from here. These trades might end up being unprofitable. We’ll keep monitoring the situation. However, in any case, I’m always ready to put my money on my trading systems, regardless of my personal opinions or analysis.To be honest, I didn’t even expect such consequences after this drop. For me, it's just another good market shake-up. However, when I read various communities and see that some funds have capitulated, how heavily all crypto communities are trapped, including experts with truly vast experience, I realize even more the value of our strategies. ✅ Pump Tracker – exited trades at Bitcoin price of 104,000. ✅ Green Candles – exited Bitcoin trades at 102,000. ✅ Greenwich – almost at breakeven. ✅ The system trading alts – exited 4 weeks ago at the highs, just before the 50-80% drop in alts. Sitting in stables and watching all this chaos from the sidelines is, of course, the highest level of satisfaction. According to various estimates, around 80% of retail was almost entirely in alts. rect 🪦😅The structural plan is still relevant. I expect the formation of higher price lows now, followed by the second wave of growth. The scenario will be invalidated if the price forms lower highs and lower lows on the chart.
Yaroslav_Krasko
Why could Bitcoin easily and quickly reach $100 000? But...

Why could Bitcoin easily and quickly reach $100,000 if it breaks out of this sideways trend upwards? But... Using various services like coinglass, it's possible to analyze different metrics, such as the liquidation map. What is this and why is it important? Liquidations are liquidity, and as we well know, the price moves from liquidity to liquidity. I'm sure you've often noticed how, after sharp and significant drops, the price quickly reacts and reverses. This is the moment when the price finds liquidity through the liquidation of a large number of market participants. In simple terms, it's like a magnet that will eventually attract the price. What do we see right now? According to coinglass, at the $70,000 level alone, there are $20 billion worth of liquidation orders, and the same amount just slightly higher, at $71,500. These are potential liquidations of short-sellers (those betting on the market going down). What happens when short-sellers are liquidated? When a short position is liquidated, a buy order is triggered automatically, which in turn pushes the price higher. This long accumulation + liquidations can easily push the price up to $100,000 or even higher! And this could set the market trend direction for the next 4-6 months. But... If you've read the previous post, you know that the current trend is bearish (downward), and until that changes, a further decline is more likely. Importantly, according to coinglass, there’s a lack of liquidity below, all the way down to the $44,000 - $42,000 range, with a large pool of liquidity and liquidations at the $33,000 level. And where there is no liquidity and it's empty, there are no barriers, meaning the price could drop just as rapidly. Additional thoughts: As long as the downward trend continues, the probability of the price moving lower remains higher. However, since this downtrend has lasted for almost 200 days, there’s also a significant chance that the trend could reverse, and we could move upwards. So, we are currently in a rather interesting and uncertain spot, where the likelihood of going up or down is about 50/50. I’ll keep following my algorithmic trading systems!
Yaroslav_Krasko
Key Level for Bitcoin Trend Reversal is ...

Last week, the price closed below the previous low, forming another lower low. This further confirms that Bitcoin is in a bearish trend, which has been ongoing for the past six months. The crucial level at the moment is $64,220 (the last formed high). This key level separates us from a bullish (upward) trend. If the price on the weekly timeframe can break this level and close above it, it will be a very important indicator of a trend reversal. Until then, we remain in a bearish trend.
Yaroslav_Krasko
ARKM Near Buy Zone – Is This the Perfect Entry?

When it comes to investing in cryptocurrency, it's important to know when to act most effectively ⬇️ The best approach is to rely on robust trading systems or indicators that have been tested on historical data and hundreds of cases. This is exactly the approach I use in my analysis. All eyes on the current system zone, when the price drops to this zone, it means that the coin is oversold and its price is in the zone of fundamental value—a good opportunity for investment. ARKM is currently 17% away from the buy zone according to my analysis. And the best price range for investing in this coin is between $0.5 - $0.8. Follow my page to not miss this moment.
Yaroslav_Krasko
I’ve spent 8 years in crypto, and here’s what I’ve discovered ↓↓

I’ve spent 8 years in crypto , and here’s what I’ve discovered ⏬ ------------------- ▪️ Throughout my journey, I’ve met hundreds of ambitious traders, but today only a few remain —those who were willing to wait and those who didn’t dream of quick profits. ▪️ According to most official studies, only 1-3% of traders make money. ▪️ Only 1% can overperform the market and earn more than a simple buy-and-hold strategy. ▪️ Intuition and prayers don’t work here; without a clear strategy , you will lose everything, I guarantee it. ▪️ The best of the best earn 100-150% annually (check the World Cup Trading Championships to verify this). Yes, there are sometimes bull markets where you can make 500% or more, but this happens only once every four years, and you need to be earning consistently. ▪️ The crypto market is changing, and this cycle is very challenging , even for professional market participants. The only way to succeed is to constantly adapt. ▪️ 99% of bloggers and influencers you follow are complete scams. Most of them won’t be able to show you a yearly trading account performance report upon request in real-time. They make money not from trading, but from you, by selling yet another course. (Always check their profitability statistics; it's the only way to verify if this person is a professional or a fraud). ------------------- Everyone is looking for the holy grail , and I searched for it too, but I found it in algorithmic trading . This trading style allows me to rely solely on numbers, clear profitability indicators, and statistics. Most importantly, it removes the human factor (staying emotionally stable, not succumbing to fear and greed).
Yaroslav_Krasko
What's next for TON?

Many are currently concerned about the future of the TON cryptocurrency and Pavel Durov, who is behind this project. I am more than confident that this is yet another manipulation, just like many other manipulations in the market. And if you hold this coin and feel the urge to sell it – the manipulation worked. You might ask, what should we do? Will the coin grow? Clearly, no one knows the future, but according to my indicator, the best buying zone is within the $3 - $4.6 range. (See the indicator's performance on the chart; I've attached a screenshot). $3 - $4.6 is the zone where I would be interested in buying this cryptocurrency. I plan to buy in parts and average my entry price, of course, if the market presents such an opportunity. For those who are particularly risk-prone, you might try buying now with a small percentage of the capital you're willing to allocate to this coin.
Yaroslav_Krasko
Bitcoin Closed the Gap—Is $44,000 Next?

The price has closed the gap on CME, which acted as a magnet. It will be interesting to see what happens next. I'll reveal key details and my expectations at the end and in the middle of the review, so make sure to read until the end. 1. I created an indicator for convenient tracking. If you're interested and following this as well, feel free to add this system to your setup using the link: 2. CME, or the Chicago Mercantile Exchange, is where Bitcoin is traded. For the American market, this is an important opportunity to trade cryptocurrency. Considering that the U.S. accounts for 20% of the global GDP and that 40% of all millionaires in the world are based there, it's clear how significant this market is. The CME exchange does not operate on weekends, which causes gaps on the chart from the time the exchange closes to the time it reopens. This happens because platforms like Binance, ByBit, OKX, and others trade Bitcoin 24/7. Naturally, the price doesn't stay still waiting for the CME to reopen, which is why these gaps occur. For traders, this is an important chart to monitor closely. Traders pay close attention to gaps because the price often returns to "fill" the gap, meaning it moves back to the level it was at before the gap occurred. This is similar to how a magnet attracts metal: the price is drawn to the gap. 3. Statistically, 80-90% of gaps are filled, which highlights the importance of these levels. 4. Many traders build strategies around gaps. If you are developing in this direction, you might consider using this as one of the conditions for your own system. If not, it’s still a useful tool that helps explain why the price reached certain levels or reversed from them. Overall, it provides a better understanding of the market. 5. Additionally, a few examples from historical data. 6. I would like to see a scenario where the price drops again to $44k, so that everyone who bought the dip gets shaken out. This would allow the market to fully reset and then continue its trend more calmly. But as we know, the market doesn't always move the way we want it to. No expectations = no disappointments. I continue to monitor the situation and wait for signals from my trading systems.
Disclaimer
Any content and materials included in Sahmeto's website and official communication channels are a compilation of personal opinions and analyses and are not binding. They do not constitute any recommendation for buying, selling, entering or exiting the stock market and cryptocurrency market. Also, all news and analyses included in the website and channels are merely republished information from official and unofficial domestic and foreign sources, and it is obvious that users of the said content are responsible for following up and ensuring the authenticity and accuracy of the materials. Therefore, while disclaiming responsibility, it is declared that the responsibility for any decision-making, action, and potential profit and loss in the capital market and cryptocurrency market lies with the trader.