
WyckoffMode
@t_WyckoffMode

What symbols does the trader recommend buying?
Purchase History
پیام های تریدر
Filter
WyckoffMode
BTC Has High Probability for 70 to 72 but May go Higher
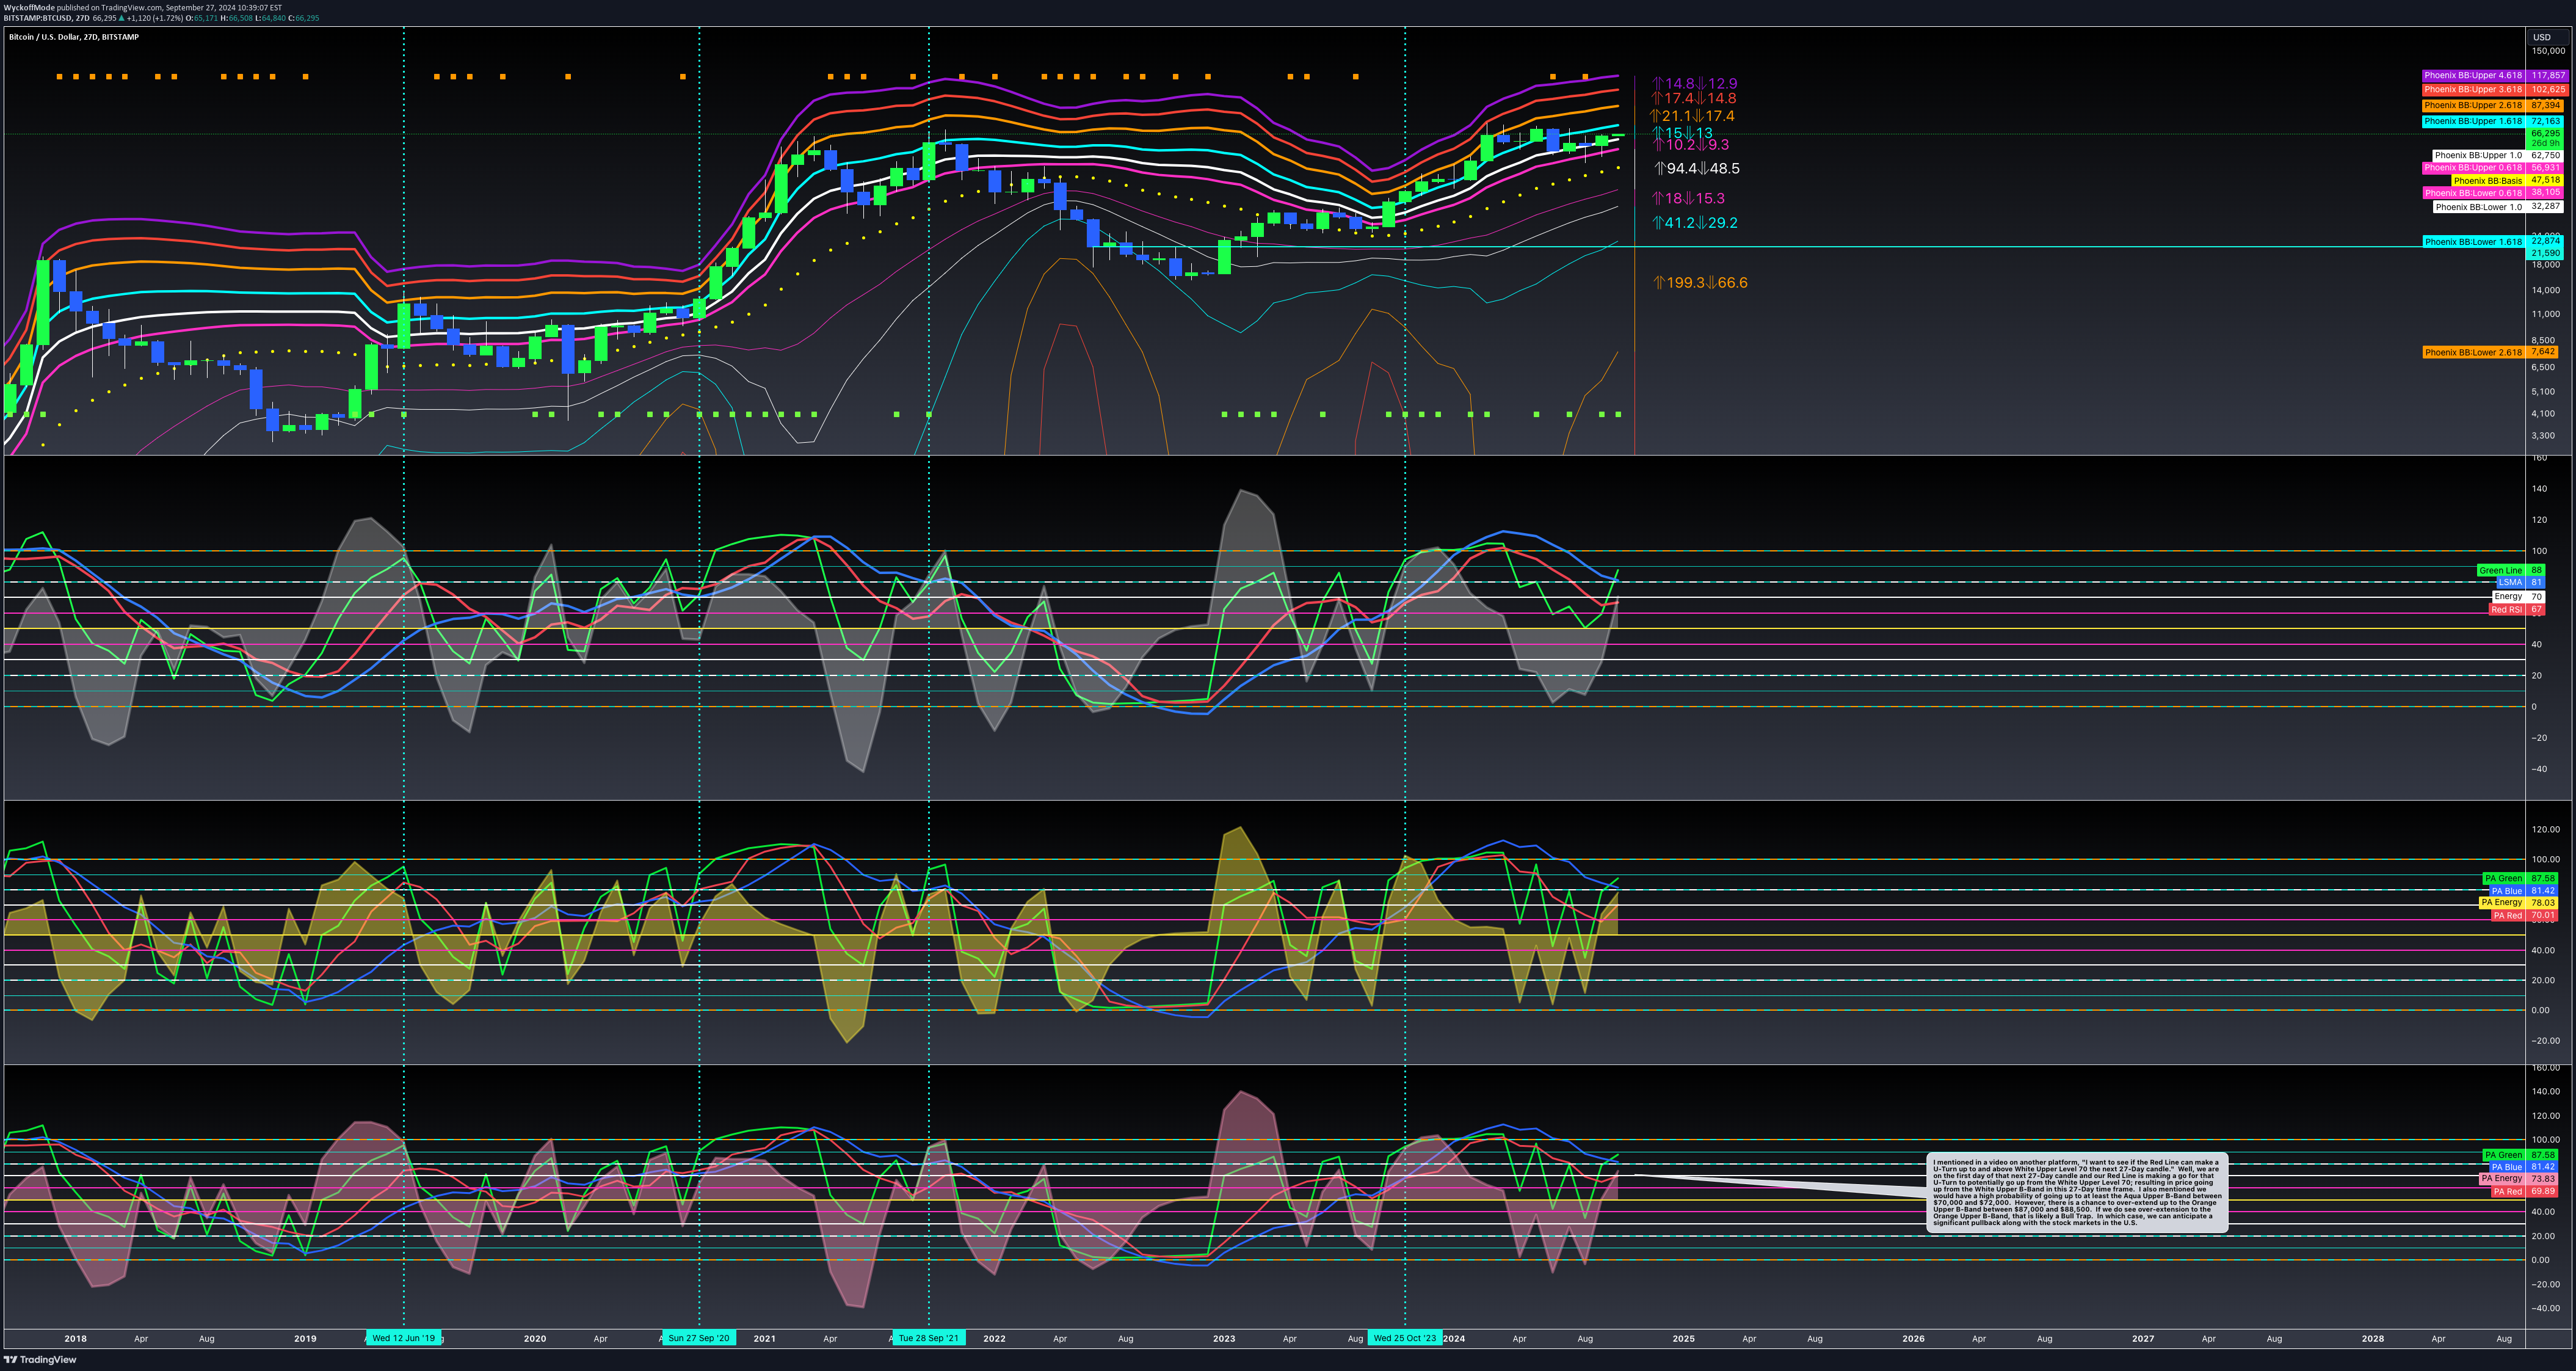
Hi Everyone! I mentioned on another platform a couple of days ago, "I'm looking to see if the Red Line can make a U-Turn and go up from White Upper Level 70 in the NEXT 27-Day time candle." We are currently in the first day of that NEXT 27-Day candle and it appears the Red Line is making an attempt to go up from the White Upper Level 70 in my Phoenix Ascending True XCES (PA True XCES) indicator. This also means we have a high probability of rising up from the White Upper B-Band to the Aqua Upper B-Band around $70,000 to $72,000. BE ADVISED: It's possible to continue rising up even higher to the Orange Upper B-Band between $85,000 and $88,500. If we do, we would be over-extended at that point. How so? Well, is the Red Line ready to go up from the Aqua Upper Level 90 or Orange Upper Level 100? No... Therefore, a move up to the Orange Upper B-band in the CURRENT 27-Day candle would be considered "over-extension up" and would likely indicate a bull trap. At which point, we would anticipate a significant pullback along with the stock markets in the U.S. Here is the 27-Day time frame:UPDATE: Added a Red Text Bubble; referring to historical data: RED TEXT BUBBLE: Note how the Red Line was on the verge of going up from White/Aqua Level 80 here. This showed we had "support within Phoenix Ascending" to go up with authority WITH SUPPORT. Meaning, we would have high probability of support at Aqua Upper B-Band in the event of a pullback. We do NOT have this present day during the CURRENT 27-Day candle. Will we have this support the NEXT 27-Day candle? Time will tell... I want to see what lower time frames look like as the NEXT 27-Day candle approaches approximately 3 weeks from today..UPDATE: Here is the 2-Week Time Frame: MAGENTA TEXT BUBBLE: We generally need to see BOTH the Red and Blue Line above Magenta Level 60 in this 2-Week time frame in order to have a high probability for a significant move to the upside resulting in EXPANSION of the B-Bands and price action rising signficantly with this expansion. Our Red Line is on the verge of going up from Magenta Level 60 but our Blue Line is not quite there yet. This is why I said what I said about us going up to the Orange Upper B-Band in the 27-Day time frame would be a high probability of OVER-EXTENSION and likely a bull trap if we go up to the Orange Upper B-Band in the 27-Day time frame.UPDATE: 1-Week Time Frame: WHITE TEXT BUBBLE: NOTE: Red Line was going UP FROM White Level 70 here in this 1-Week time frame; resulting in price going UP FROM White Upper B-Band with EXPANSION of the B-Bands. PRESENT DAY: We do not see the Red Line ready to go UP FROM White Level 70. Therefore, a significant move going up well above 70 to 72 thousand would have a high probability of OVER EXTENSION; resulting in a significant pullback. I simply want you to guard your emotions if we see a significant move higher than 72,000.
WyckoffMode
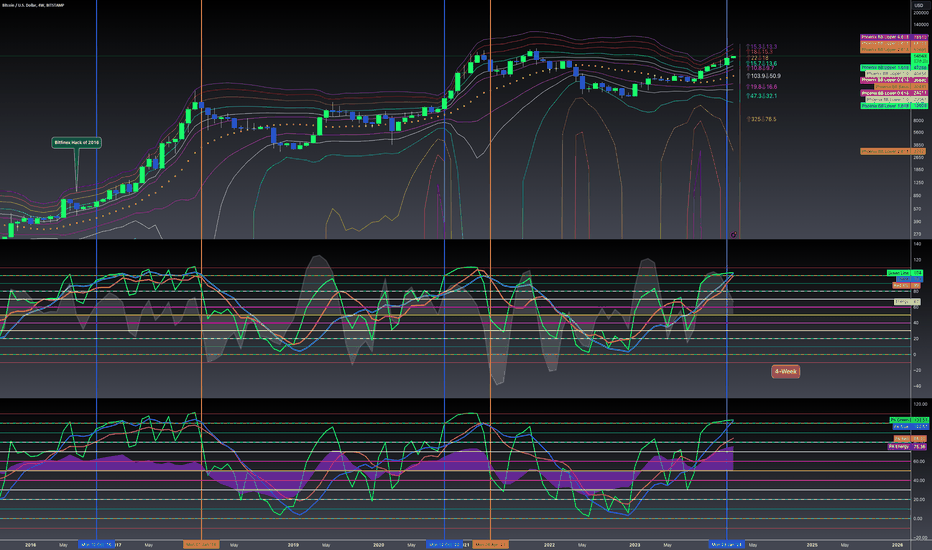
BTC: High Probability of 60600 and Can go Down to 51800
Hi Everyone! We currently still have Bearish Divergence in the 2-Week time frame with Red Line currently at Magenta Upper Level 60 Within Phoenix Ascending. The current price of the Magenta Upper B-Band within Bad Ass B-Bands is $60,600. So, we have a high probability of continuing down to proximity of $60,600 over the next 6-Days and 22-hours remaining in the 2-Week time frame from this writing. Here is the 2-Week time frame: Here is a MACRO View using the 5-Week time frame: I have placed Vertical Time Lines along with Trend Lines and text bubbles to point out how we identify Bullish Divergence and Bearish Divergence. 2023 to 2025 MACRO Accumulation Schematic: I will not begin to use the chart below on a regular basis until we see a 3-Day candle CLOSE "above" $73,000:UPDATE: BTC 2-Week TF with text bubbles: YELLOW TEXT BUBBLE: Tops of White Energy are trending downward WHILE Price is FLAT or RISING; indicating high potential for Bearish Divergence approaching. MAGENTA TEXT BUBBLE: Red Line already at Magenta Upper Level within Phoenix Ascending; indicating high probability for price to continue down to Magenta Upper B-Band at $60,577 currently. Yes, we can continue falling further to the Yellow B-Band Basis at $51,786 currently in this 2-Week time frame.UPDATE: For many months WHALES have accumulated Bitcoin on the Alt-Coin/BTC pairs by slowly stair stepping down the price of Alt-Coin/BTC pairs. WHALES cannot accumulate a sufficient amount of Bitcoin on the BTCUSD and/or BTCUSDT pairs. They (Whales) must utilize the Alt-Coin/BTC pairs to accumulate Bitcoin. Well, that Phase utilizing Alt-Coin/BTC pairs to accumulate Bitcoin is coming to a close. Now, WHALES are selling quite a bit of Bitcoin they accumulated over these many months. They are selling their Bitcoin for USD and USDT. Why? To accumulate enough USD and USDT to eventually begin pumping Alt-Coin/USD and Alt-Coin/USDT pairs. But for now, < in regard to Alt-Coin/USD pairs > they are slowly accumulating more Alt-Coins on the Alt-Coin/USD pairs and Alt-Coin/BTC pairs before they begin to eventually pump Alt-Coin/USD pairs along with Alt-Coin/BTC pairs. This means we will slowly begin to see Bitcoin Dominance decrease due to Whales selling their Bitcoin for USD to buy Alt-Coins; as well as using a significant amount of their Bitcoin to buy Alt-Coins on the Alt-Coin/BTC pairs.UPDATE: Added a White Text Bubble along with two (2) White Circles to this 2-Week TF chart below: WHITE TEXT BUBBLE: You will see two (2) WHITE CIRCLES on the cnadles in this 2-Week TF. The reason I'm pointing this out with the white circles is to point out how the Magenta UPPER B-Band held support during a similar period of time to present day. Will we see the Magenta UPPER B-Band in the 2-Week TF "hold support" during present day? We will see... Important to note the B-Bands were expanding during historical period of the white circles. B-Bands PRESENT DAY are "contracting" instead of expanding.UPDATE: Energy indicator built within Phoenix Ascending indicating POTENTIAL for a pullback on or around September 11, 2024. Could we see major black swan event occur on September 11th; resulting in a major correction in the stock market exchanges as well as crypto currency exchanges? Certainly possible... If the black swan ends up being a hack of the financial system; as well as a hack of exchanges, it may take a while for liquidity to come back into the markets to see a significant recovery in the crypto market again. I would think if we are to see a black swan on September 11, 2024, we would likely see people front running that date to begin selling before that day gets here. Here is the 12-Week TF:UPDATE: BTC: I plan to provide an update for Bitcoin/USD some time this evening. We need to look at indicators in MULTIPLE time frames to determine if we are in RE-Accumulation or RE-Distribution. May require more time for better idea as well. 12-hour:
WyckoffMode
ADA: Has Transitioned from Phase D into Phase E
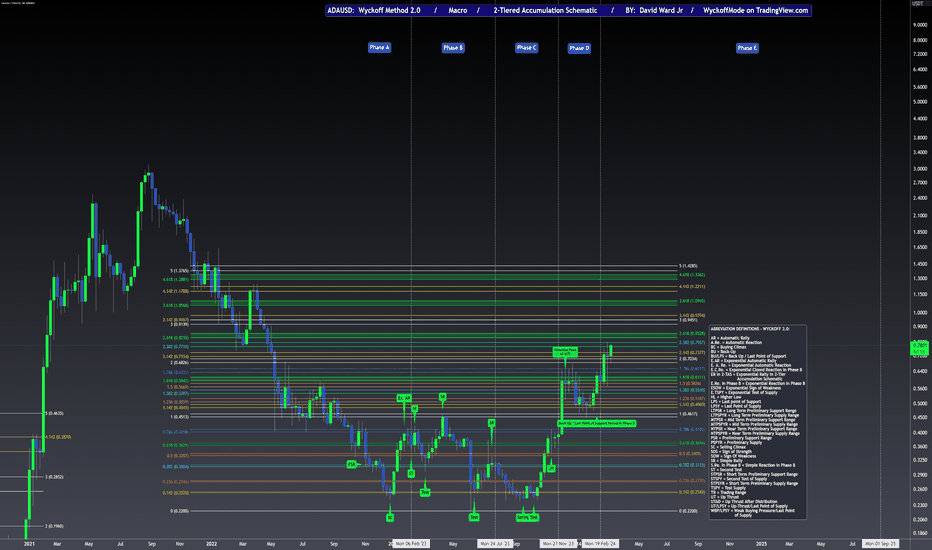
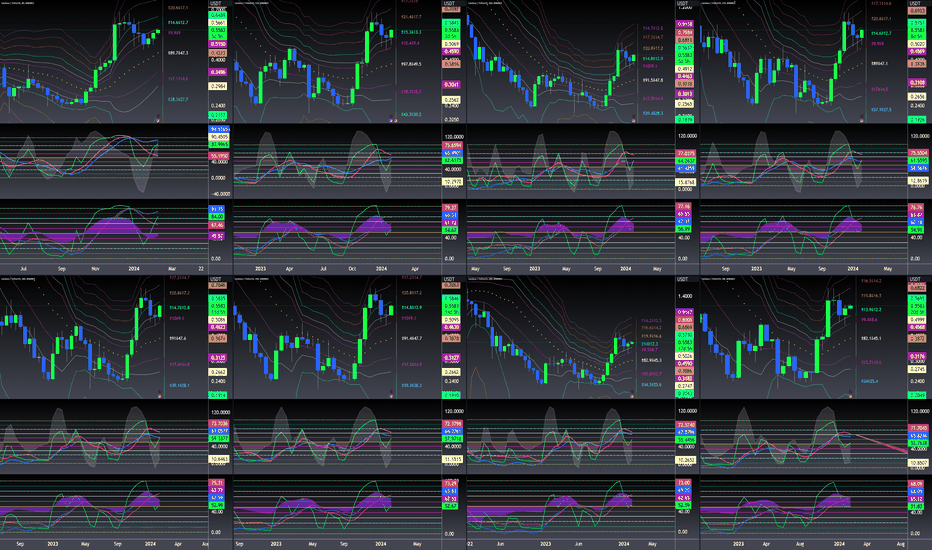
Hi Everyone! I'm anticipating the peak of this Sign of Strength event in Phase E to get us to at least $1.055 to $1.095 at a minimum. It's possible to continue higher but I want to see us make it to $1.055 to $1.095 price range first and then have a look at our White Energy in the 1-Week, 2-Week and 3-Week time frames to see how much upward pressure remains at that time; before pointing out whether or not upward pressure has exhausted or not. Which would let us know if we can or cannot go higher than $1.055 to $1.095 price range. Red Line in the 8-Week time frame is above Magenta Upper Level 60 at level 62. Since the Red Line is above Magenta Upper Level 60, I'm anticipating the price going up to at least around the Magenta Upper B-Band at $1.099. However, we could continue higher to the White Upper B-Band at $1.32. As mentioned previously, let's see what the white energy looks like in the 1-Week, 2-Week and 3-Week when we make it to $1.099 before determining if we can go up to $1.32. Here's the 8-Week:UPDATE: Don't be surprised if we have a brief pullback at the 2.618 FIB Extension around $0.85 cents before continuing higher to at least $1.055 to $1.095 price range.UPDATE: Simply pointing out where $1.095 and $1.32 are located on my Diagonal Support/Resistance Line Chart for next ATH (All Time High). $1.095 at white dashed pitchfork basis and $1.32 at Purple Diagonal Line.
WyckoffMode
ADA: Has Transitioned from Phase D into Phase E
Hi Everyone! I'm anticipating the peak of this Sign of Strength event in Phase E to get us to at least $1.055 to $1.095 at a minimum. It's possible to continue higher but I want to see us make it to $1.055 to $1.095 price range first and then have a look at our White Energy in the 1-Week, 2-Week and 3-Week time frames to see how much upward pressure remains at that time; before pointing out whether or not upward pressure has exhausted or not. Which would let us know if we can or cannot go higher than $1.055 to $1.095 price range.Red Line in the 8-Week time frame is above Magenta Upper Level 60 at level 62. Since the Red Line is above Magenta Upper Level 60, I'm anticipating the price going up to at least around the Magenta Upper B-Band at $1.099. However, we could continue higher to the White Upper B-Band at $1.32. As mentioned previously, let's see what the white energy looks like in the 1-Week, 2-Week and 3-Week when we make it to $1.099 before determining if we can go up to $1.32. Here's the 8-Week:UPDATE:Don't be surprised if we have a brief pullback at the 2.618 FIB Extension around $0.85 cents before continuing higher to at least $1.055 to $1.095 price range.UPDATE:Simply pointing out where $1.095 and $1.32 are located on my Diagonal Support/Resistance Line Chart for next ATH (All Time High). $1.095 at white dashed pitchfork basis and $1.32 at Purple Diagonal Line.
WyckoffMode
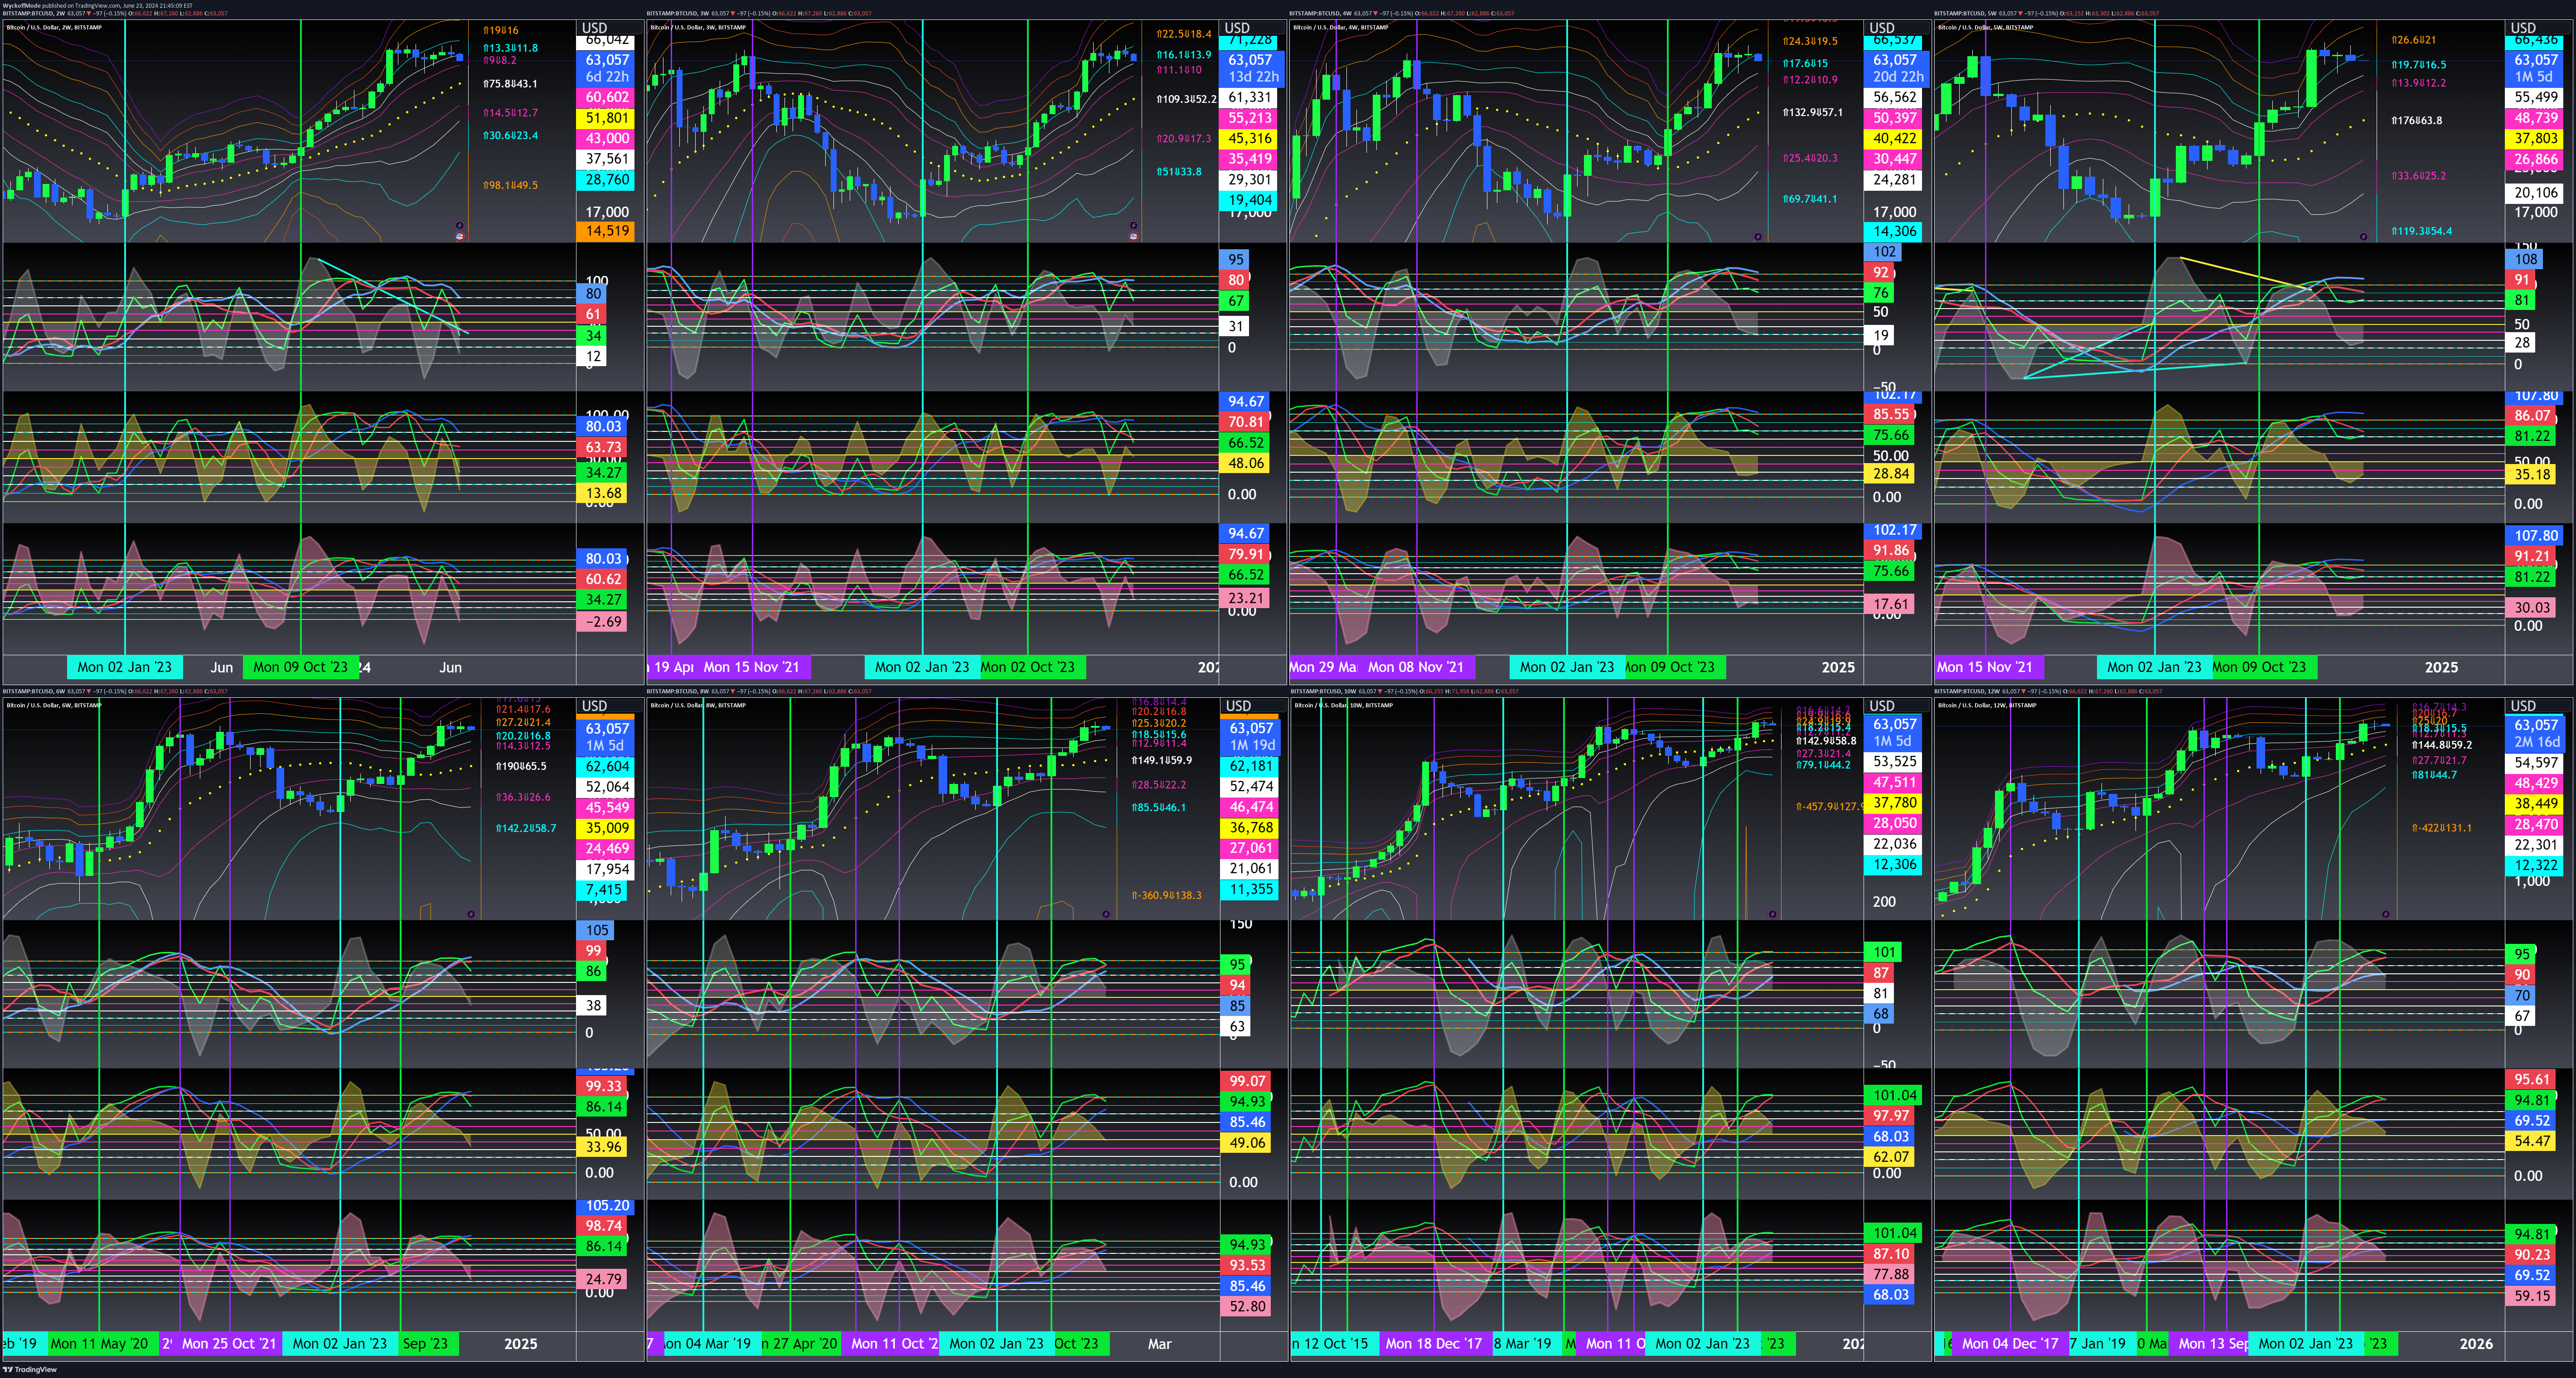
BTC: 10 Day TF Suggests Proximity of 95 to 100K Next 10 D Candle

Hi Everyone! Yes, you read the title correctly. The 10-Day time frame suggests upward pressure can continue the remaining 9-Days of the current 10-Day candle and upward pressure continue into the NEXT 10-Day candle. Which could take us up to within proximity of the Red Upper B-Band the NEXT 10-Day candle. I'm anticipating the Red Upper B-Band will be somewhere between $95,000 and $100,000 the NEXT 10-Day candle. Here is the 10-Day candle I covered in the video: We have a new 10-Week candle suggesting Orange Upper B-Band at a bare minimum at present. The current price point value of the Orange Upper B-Band in the 10-Week is $79,965. Current Price Point of the Red Upper B-Band in the 5-Week TF is $87,250. We still have a little over 1-Month remaining in the current 5-Week candle with White Energy well above Level 50; suggesting upward pressure continues. It's too early to say anything about upward pressure the NEXT 5-Week candle. We need to wait and see what level the White Energy will be the NEXT 5-Week candle. NOTE: The 1-Week time frame is in the top right corner of the chart below. See the current level of the White Energy in the 1-Week time frame approaching Yellow Level 50. We anticipate upward pressure to continue the remainder of the current 1-Week candle but we will have to see what level the White Energy will be the NEXT 1-Week candle. In my opinion, this suggests we could continue upward to proximity of $75,000 to $85,000 before seeing a pullback due to White Energy in the Weekly being on the verge of falling below Level 50 the NEXT 1-Week candle. 1-Week is in top right corner: You will also note the White Energy is still rising in the 2-Day time frame at present. The 2-Day is located bottom right of center of the chart above. CONCLUSION: I'm anticipating $75,000 to $85,000 at a minimum before a MAJOR pullback of 30 percent or more. However, if we see a pullback to around $65,000 and bounce back up once again, do not be surprised if we continue upward to $95,000 to $100,000 price range before finally getting that 30 percent or more pullback. Will that 30+ percent pullback imply the top is in and we begin a new period of Distribution? No... This Bull Market is far from being done yet. We've only begun in my opinion. Hope this was helpful. Happy Trading and Stay Awesome! DavidUPDATE: 2-Week time frame: RED TEXT BUBBLE: The White Energy is still RISING in this 2-Week time frame; suggesting we still have quite a bit more time of upward pressure. Keep in mind this is a NEW 2-Week candle with 13-Days and 5-hours remaining before we get another 2-Week candle. This means we could see upward pressure continue for potentially up to 4-Weeks from this writing.UPDATE: Thought I would share this chart from my video; in which I pointed out we could run up to the Red or Yellow ASCENDING Diagonal Trend Line Between $89,150 and $99,074. This "range" is identified with a YELLOW Ascending Diagonal Range on the chart.UPDATE: This was the chart I posted in other publications regarding us "closing" above $73,000 in the 3-Day before I begin using this chart for future "targets." I added the Aqua Ascending Diagonal Channel to this chart to point out we could be heading up toward the 1.236 FIB Extension. I must say I anticipate us heading up to my 1.142 FIB Extension at a bare minimum. My opinion of course...
WyckoffMode
BTC: Potential to See $71300 or Higher Before Block Halving
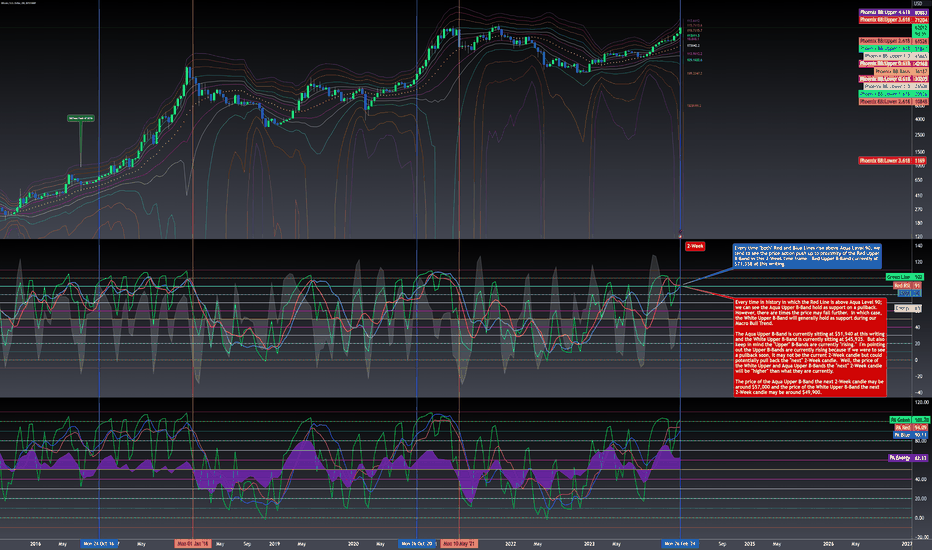
Hi Everyone! This analysis focuses only on the 2-Week time frame. In particular, we are focused on the Level of the Red and Blue Lines within Phoenix Ascending indicator (By: WyckoffMode) and Bad Ass B-Bands (By: WyckoffMode). Two Important Historical Facts about the indicators in the 2-Week time frame: Historical Fact #1: BLUE TEXT BUBBLE Every time "both" Red and Blue Lines rise above Aqua Level 90, we tend to see the price action push up to proximity of the Red Upper B-Band in this 2-Week time frame. Red Upper B-Band currently at $71,358 at this writing. Historical Fact #2: RED TEXT BUBBLE Every time in history in which the Red Line is above Aqua Level 90; we can see the Aqua Upper B-Band hold as support on a pullback. However, there are times the price may fall further. In which case, the White Upper B-Band will generally hold as support during our Macro Bull Trend. The Aqua Upper B-Band is currently sitting at $51,940 at this writing and the White Upper B-Band is currently sitting at $45,925. But also keep in mind the "Upper" B-Bands are currently "rising." I'm pointing out the Upper B-Bands are currently rising because if we were to see a pullback soon, it may not be the current 2-Week candle but could potentially pull back the "next" 2-Week candle. Well, the price of the White Upper and Aqua Upper B-Bands the "next" 2-Week candle will be "higher" than what they are currently. The price of the Aqua Upper B-Band the next 2-Week candle may be around $57,000 and the price of the White Upper B-Band the next 2-Week candle may be around $49,900. I hope this video publication on the 2-Week time frame has been helpful. Happy Trading and Stay Awesome! DavidUPDATE: If you're curious where we are on my Wyckoff Method 2.0 Macro Accumulation Schematic; we are currently working on Sign of Strength event #2 in Phase E. We can have many Sign of Strength events in Phase E of Accumulation. Just as we can have many Sign of Weakness events in Phase E of Distribution in Wyckoff Method 2.0. The next chart is the chart I will be using once we finally get a 3-Day "close" above $73,000. The Fibonacci Tool used in this chart is "Based on Log Scale." The Fibs in the previous chart were NOT based on log scale. But this one is...UPDATE: Just to clarify... When I said, High probability to go up to the Red Upper B-Band, I would prefer to imply within PROXIMITY of the Red Upper B-Band. Which is to say it "could" be close but not quite to the Red Upper B-Band. I identified a few places in which we were in PROXIMITY but did not HIT the Red Upper B-Band in the 2-Week chart below:UPDATE: We have a chance to continue upward toward the Aqua Ascending Diagonal Line in proximity to $74,265. Will discuss in more detail after we get a new Daily candle approximately 4 hours from this writing.
WyckoffMode
BTC: $57700 is Definitely on Table but Can go up to $68100
Hi Everyone! We have a new 4-Week candle. I simply need to point out $57,700 at the Orange Upper B-Band is our current new target. Don't be surprised if we blow past that up to the Red Upper B-Band near $68,100. We still have 27-Days remaining in the current 4-Week candle. The reason for mentioning this is due to us still having upward pressure remaining in the current 4-Week candle. We know this because the White Energy has not come down to level 50 yet. White Energy could possibly be at level 50 the next 4-Week candle. Which would indicate we may see a pullback at the end of this 4-Week candle or beginning of the next 4-Week candle. So, we may see a pullback shortly after potentially testing the All Time High (ATH) at the Red Upper B-Band. Which could be this 4-Week candle or the next 4-Week candle. I'll provide a more detailed update with a video soon. Stay Awesome! DavidUPDATE: Two Important Historical Facts about the indicators in the 2-Week time frame: Historical Fact #1: Every time "both" Red and Blue Lines rise above Aqua Level 90, we tend to see the price action push up to proximity of the Red Upper B-Band in this 2-Week time frame. Red Upper B-Band currently at $71,358 at this writing. Historical Fact #2: Every time in history in which the Red Line is above Aqua Level 90; we can see the Aqua Upper B-Band hold as support on a pullback. However, there are times the price may fall further. In which case, the White Upper B-Band will generally hold as support during our Macro Bull Trend. The Aqua Upper B-Band is currently sitting at $51,940 at this writing and the White Upper B-Band is currently sitting at $45,925. But also keep in mind the "Upper" B-Bands are currently "rising." I'm pointing out the Upper B-Bands are currently rising because if we were to see a pullback soon, it may not be the current 2-Week candle but could potentially pull back the "next" 2-Week candle. Well, the price of the White Upper and Aqua Upper B-Bands the "next" 2-Week candle will be "higher" than what they are currently. The price of the Aqua Upper B-Band the next 2-Week candle may be around $57,000 and the price of the White Upper B-Band the next 2-Week candle may be around $49,900.
WyckoffMode
BTC: Addressing Those Who Have a Short Position Open
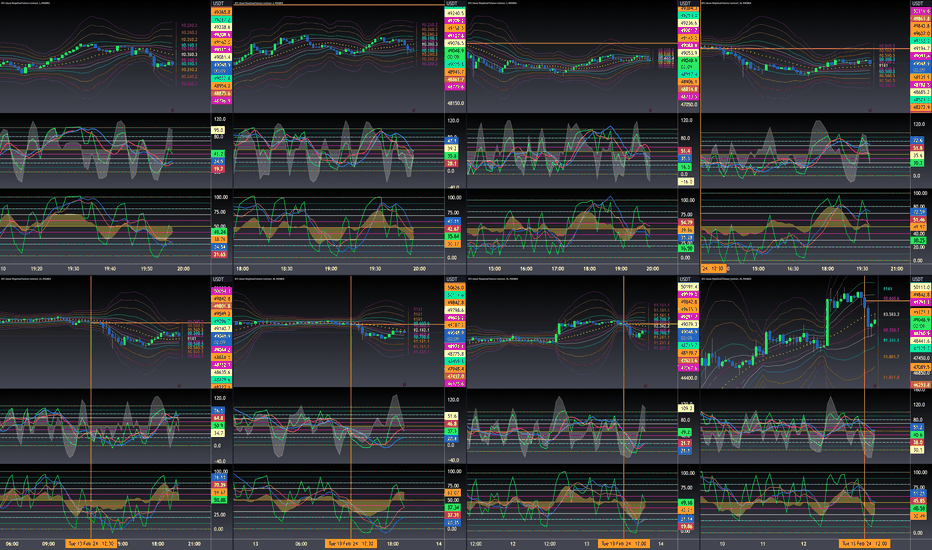
Hi Everyone! This video is addressing those who currently have a Short Position open. I explained to a certain degree how I personally would not have opened a short position until the price was about to fall down from $49,840 to $49,850; based on what I would have seen at the time in the 30m, 1h and 2h time frames. I also pointed out I would have broken up periods of taking profit into four (4) parts. The first part for taking profit would have been around the Magenta Lower B-Band in the 2-hour time frame. Mainly because the Red Line in the 2-hour was not ready to fall DOWN FROM the Magenta Lower Level 40 on a potential drop down. Which was the case... Also, once profit was taken at the Magenta Lower B-Band, you would consider moving your stop loss down just below your entry in order to lock in the profits you had just taken. That would be a choice for you to make at that time. I also mentioned you may have preferred to keep your stop loss above your short entry price and simply saw the profit already taken as insurance to not lose as much if the price were to come back up to trigger your stop loss. That choice would be entirely up to you. It's important to note the current level of the Red Line in the 4-hour time frame; which is top left of center on the chart below. The Red Line in the 4-hour is "NOT" ready to FALL DOWN FROM Yellow Level 50 in the 4-hour. Therefore, I current local floor of support in the short term would likely be the Yellow B-Band Basis in the 4-hour around $48,690. Why? Because the Red Line was not ready to fall down from Yellow Level 50 for a sustained period of time. 4-hour is top left of center in chart below: Another time frame to consider; in regard to "floor of support" would be the 24-hour time frame; which is bottom left of center in the chart below. NOTE: The Red Line is currently at level 100. Which is well above Aqua Upper Level 90. This implies we have a high probability for the Aqua Upper B-Band to maintain support for the entire 24-hours of the current 24-hour candle. Yes, the price might dip below the Aqua Upper B-Band but has a high probability of "closing" at or above the Aqua Upper B-Band due to the currently level of the Red Line in the 24-hour. 24-hour is bottom left of center below: So, $48,650 was likely our current local short term support based on what we were seeing in the 2h, 4h and 24h time frames. As for our Near Term Local Support; I used the 3-Day time frame. Which is the bottom right corner of the chart below. NOTE: The Red Line in the 3-Day is above White Upper Level 70 in Phoenix Ascending. Implying the Red Line is "NOT" ready to FALL DOWN FROM the White Upper Level 70 area. Therefore, the White Upper B-Band has a high probability of holding support if the price were to fall down significantly. The White Upper B-Band the "next" 3-Day candle will be at approximately $46,000. It's currently at around $45,600. CONCLUSION: The Red Line in the 24-hour is still VERY HIGH. Which implies we still have fairly strong support in the Aqua and White Upper B-Bands for quite a while longer. So, if you were to have a short position open at this time, the probability of the price falling and continuing to fall for a sustained period of time is actually a very low probability. Especially, if you are hoping for the price to fall down to the $30,000 to $32,000 price range. If you have a short position open with hope of it falling down to the price range, you would have to wait for a very long time in my opinion. Is it possible? Sure... But is it probable; at least based on what we see within the indicators at this particular time? No... We must conclude our current floor of support is the White Upper B-Band in the 3-Day and no lower than the Magenta Upper B-Band in the 3-Day. Which would be between $45,600 and $44,800. Even then, I would not count on the price action falling down to that price range. Yes, it's possible for it to fall down to that price range. I just want you to be prepared to have that short position open for quite a while if that is your final target to take profit if this is your determined floor of support for the near term I hope this information was helpful... My previous publications were not intended to discourage people from opening short positions. The purpose of the previous publications was to encourage everyone to be careful drawing a conclusion we are falling down to the $30,000 to $32,000 price range. The indicators simply do not support such a move AT THIS TIME. Could the indicators in multiple time frames support this in the future? Sure, it's possible... Just not at this time. So, if you have a short position open, you must be prepared to close that position once it is rather obvious the price will no longer continue falling below a particular price point and has resumed upward pressure for the Near Term. Yes, the White Energy may begin falling further below level 50 in the 24-hour time frame the next 24-hour candle; resulting in the price action continuing to stair step DOWN to around the $45,600 to $46,200 price range. That is possible... Just keep in mind the Red Line in the 24-hour time frame would likely have to fall below level 50 to increase the probability for the price to continue falling down to the $30,000 to $32,000 price range. We are a long way off from that potential; since the current level of the Red Line in the 24-hour is currently above level 100. Happy Trading and Stay Awesome! DavidUPDATE: 3-Day time frame: BLUE TEXT BUBBLE: If the Green Line and White Energy were to turn down the "next" 3-Day candle, I would anticipate the White or Magenta UPPER B-Band to be our current Floor of Support. The White and Magenta Upper B-Bands are currently "rising." Which means the price points of the White and Magenta UPPER B-Bands the "next" 3-Day candle will be "higher" than price points this current 3-Day candle. This is why I'm saying our current Near Term Floor of Support is between $45,000 and $46,000 due to the future price points of the White & Magenta UPPER B-Bands the "next" 3-Day candle.UPDATE: Does this previous post imply I'm saying the price action will continue falling down to the $43,000 to $46,000 price range? No... I'm simply pointing out that "if" the price action continues falling I would anticipate that price range being our Near Term Floor of Support. NOT $30,000 to $32,000. If we were to fall down to the $30,000 to $32,0000 price range, it would have to be a major event involving a considerable amount of slippage; with a huge wick underneather the body of the 3-Day candle. Why a huge wick? Because the price would be over-extended down if we had such a move down. Why would we say it would be "over-extended down?" Well, look at the level of the Red Line in the 3-Day time frame. It's currently at Level 81. The price action would pop back up to get in harmony with the Red Line very quick like if we saw a huge move down to $30,000 to $32,000. Meaning, the price action would pop back up to the White/Aqua Upper B-Bands rather quickly to get in harmoney with the Red Line in Phoenix which is at the White/Aqua Upper Levels. BOTTOM LINE: Probabilities of price falling down to $30,000 to $32,000 price range is VERY LOW. But if it were to fall down that low, it would pop back up VERY QUICKLY to the White/Aqua Upper B-Band area since the Red Line within Phoenix is at the White/Aqua Upper Levels currently.UPDATE: If you are a new follower and unaware the color coordinated price points in the price column to the right point out the current price of the upper and lower B-Bands, the following chart below points out that color coordination.
WyckoffMode
BTC: Does Your Wyckoff Hypothesis Have Support by the Indicators
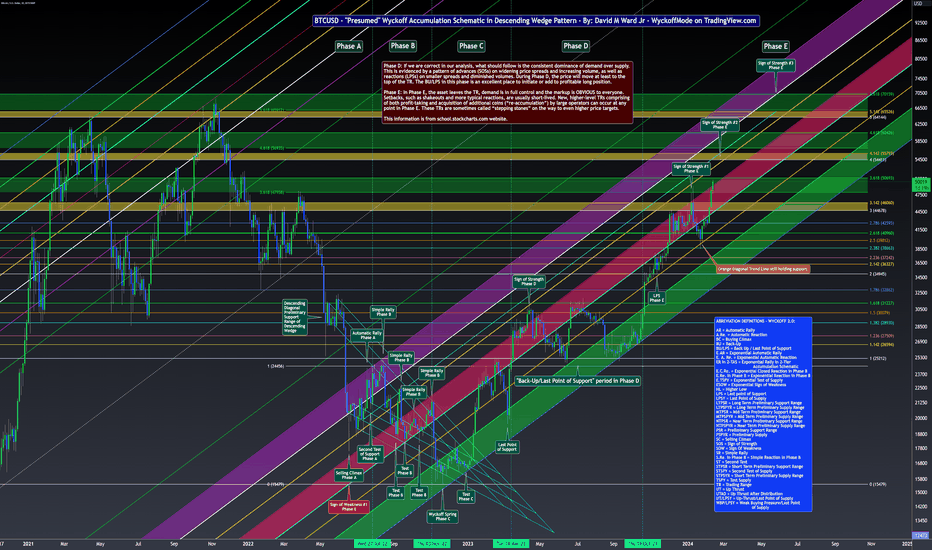
Hi Everyone! In the event you see a "pattern" which appears to be a particular kind of Wyckoff Schematic (Whether it be an Accumulation Schematic or Distribution Schematic), we should ALWAYS have a look at our indicators to see if those indicators support our "hypothesis." If our indicators do NOT support our "hypothesis" at that particular time, then we should NOT conclude our hypothesis has a high probability of playing out UNTIL our indicators begin to show a higher probability of actually playing out that hypothesis. In my opinion, we have just begun ANOTHER Sign of Strength in Phase E of a MACRO Accumulation Schematic. Yes, I believe we are in Phase E of MACRO Accumulation. You can have multiple Sign of Strength events in Phase E of MACRO Accumulation. Such as the many Sign of Strength events we had in Phase E of 2016 and 2017 MACRO Accumulation. Those multiple Sign of Strength events are often referred to as ""Stepping Stones" to higher highs; one after another until we finally reach a Buying Climax in Phase A of MAJOR Distribution. Is it possible we could be in Phase C of RE-Distribution? Sure, it's possible. However, what are the "probabilities" of us actually being in a period of RE-Distribution based on the indicators? Well, at this present time, the indicators show no support at all of us being in a period of RE-Distribution; resulting in a pullback to the $30K to 31K price range. I just don't see that at present. In fact, I see more support in the indicators that we are currently working on Sign of Strength event #2 (Stepping Stone #2) in Phase E of MACRO Accumulation. AND this Sign of Strength #2 is NOT done yet. This is my opinion of course. We would have to see some major changes begin in the short term group of time frames (1h, 2h, 3h, 4h, 6h and 8h) with major turn to downward pressure before I would even consider this. What would constitute the beginning of DOWNWARD PRESSURE? We would require the Red Line falling below Yellow Level 50 in Phoenix Ascending indicator before downward pressure is actually "triggered." Has the Red Line falling below Level 50 in the 1h, 2h, 3h, 4h, 6h and 8h time frames? No... Therefore, I would only say there is a CHANCE of a period of RE-Distribution "IF" we begin to see the Red Line in the 1h, 2h, 3h, 4h, 6h and 8h time frames fall below Yellow Level 50. If this does not happen, I must conclude we are in a Sign of Strength event that has not completed yet. I hope this opinion was helpful. Happy Trading and Stay Awesome, Everyone! DavidUPDATE: NOTE the level of the Red Line in the 3-hour, 4-hour, 6-hour and 8-hour time frames in the chart below. We do not see the Red Line beginning to turn down and fall DOWN FROM White Level 70 to provide support for the price to fall DOWN FROM the White Upper B-Band. Since we do not see this, we cannot say WITH CONFIDENCE that $50K has lost support and the price action is about to turn down; resulting in a period of RE-Distribution. We simply should not suggest that at this juncture. We COULD "suggest" this COULD occur; PROVIDING the Red Line falls DOWN FROM the White Level 70 in the 3-hour, 4-hour, 6-hour and 8-hour time frame for sstarters. BUT, it would have to continue into the 12-hour, 24-hour, 2-Day and 3-Day time frames as well. So, if we are to see a period of RE-Distribution, the Red Line in the 3-hour, 4-hour, 6-hour and 8-hour need to get a move on going DOWN FROM White Level 70. Especially, if the price is anticipated to fall down to the $30K to 31K price range.UPDATE: What was I about to add at the end of this video before my 20-minute limit was reached? I was about to say, "Once we reach the PEAK of Sign of Strength event #2 and get a pullback, I would be surprised if that pullback results in a pullback so deep we fall down to the $30K to 31K price range. Could we maybe pullback to $40K? Maybe... It depends on how high we go with the current Sign of Strength event #2.UPDATE: Here is the 6-Week time frame below. Odds are very low for nearly a 39 percent move to the downside from current price. Especially, with the Red and Blue Lines both currently above White Level 70. If price action did fall dramatically, I would expect the Magenta Upper B-Band at $37,000 to be the lowest. Reminder: The Red Line in the 3h, 4h, 6h, 8h and 12h is still above White Level 70. So, I don't believe we are falling dramatically anytime soon. I believe we are still working on our current Sign of Strength event that has NOT seen its "peak" yet. Here is the 6-Week:
WyckoffMode
ADA: Additional Discurssion on Current Price Action
Hi Everyone! Simply provided a little more insight of what we currently see with the indicators in the 15-Day, 16-Day,, 17-Day, 18-Day, 19-Day, 20-Day and 3-Week time frames. I hope this additional information was helpful. Thank you for your valuable time and hope you have happy trading! Stay Awesome! David
Disclaimer
Any content and materials included in Sahmeto's website and official communication channels are a compilation of personal opinions and analyses and are not binding. They do not constitute any recommendation for buying, selling, entering or exiting the stock market and cryptocurrency market. Also, all news and analyses included in the website and channels are merely republished information from official and unofficial domestic and foreign sources, and it is obvious that users of the said content are responsible for following up and ensuring the authenticity and accuracy of the materials. Therefore, while disclaiming responsibility, it is declared that the responsibility for any decision-making, action, and potential profit and loss in the capital market and cryptocurrency market lies with the trader.