Technical analysis by WyckoffMode about Symbol BTC: Buy recommendation (3/1/2024)

WyckoffMode
BTC: Potential to See $71300 or Higher Before Block Halving
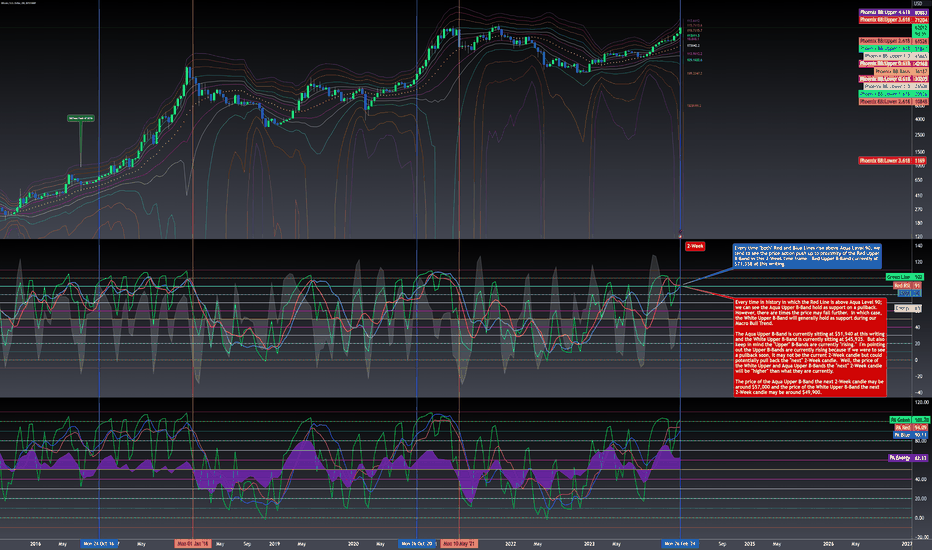
Hi Everyone! This analysis focuses only on the 2-Week time frame. In particular, we are focused on the Level of the Red and Blue Lines within Phoenix Ascending indicator (By: WyckoffMode) and Bad Ass B-Bands (By: WyckoffMode). Two Important Historical Facts about the indicators in the 2-Week time frame: Historical Fact #1: BLUE TEXT BUBBLE Every time "both" Red and Blue Lines rise above Aqua Level 90, we tend to see the price action push up to proximity of the Red Upper B-Band in this 2-Week time frame. Red Upper B-Band currently at $71,358 at this writing. Historical Fact #2: RED TEXT BUBBLE Every time in history in which the Red Line is above Aqua Level 90; we can see the Aqua Upper B-Band hold as support on a pullback. However, there are times the price may fall further. In which case, the White Upper B-Band will generally hold as support during our Macro Bull Trend. The Aqua Upper B-Band is currently sitting at $51,940 at this writing and the White Upper B-Band is currently sitting at $45,925. But also keep in mind the "Upper" B-Bands are currently "rising." I'm pointing out the Upper B-Bands are currently rising because if we were to see a pullback soon, it may not be the current 2-Week candle but could potentially pull back the "next" 2-Week candle. Well, the price of the White Upper and Aqua Upper B-Bands the "next" 2-Week candle will be "higher" than what they are currently. The price of the Aqua Upper B-Band the next 2-Week candle may be around $57,000 and the price of the White Upper B-Band the next 2-Week candle may be around $49,900. I hope this video publication on the 2-Week time frame has been helpful. Happy Trading and Stay Awesome! DavidUPDATE: If you're curious where we are on my Wyckoff Method 2.0 Macro Accumulation Schematic; we are currently working on Sign of Strength event #2 in Phase E. We can have many Sign of Strength events in Phase E of Accumulation. Just as we can have many Sign of Weakness events in Phase E of Distribution in Wyckoff Method 2.0. The next chart is the chart I will be using once we finally get a 3-Day "close" above $73,000. The Fibonacci Tool used in this chart is "Based on Log Scale." The Fibs in the previous chart were NOT based on log scale. But this one is...UPDATE: Just to clarify... When I said, High probability to go up to the Red Upper B-Band, I would prefer to imply within PROXIMITY of the Red Upper B-Band. Which is to say it "could" be close but not quite to the Red Upper B-Band. I identified a few places in which we were in PROXIMITY but did not HIT the Red Upper B-Band in the 2-Week chart below:UPDATE: We have a chance to continue upward toward the Aqua Ascending Diagonal Line in proximity to $74,265. Will discuss in more detail after we get a new Daily candle approximately 4 hours from this writing.