
Worth_The_Ri5k
@t_Worth_The_Ri5k

What symbols does the trader recommend buying?
Purchase History
پیام های تریدر
Filter
Signal Type
Worth_The_Ri5k

#Wyckoff Analysis for #DENT #DENTUSDT 3% risk 10-15% account gain Entry 0.001195 SL 0.000999 Target 0.0018-0.002 Perfect Wyckoff Based Chart If we see a SOS back above the range here it should do well. The price needs to get back above the Resistance defined by the "AR" Automatic Rally that followed the SC (Selling Climax), Once price has confirmed back above this area at 0.001235 we are very likely to start the next growth (Phase E) confirmed by another SOS (Sign of Strength) with high buying volume signature. See my related idea for a further understanding of the #Wyckoff method of analysis.
Worth_The_Ri5k

So far #Bitcoin has failed to hold its bearish breakout underneath TR3 (Trading Range 3) - once price re-entered the trading range it quickly moved to the other side performing a breakout, a sign sellers are trapped. If the price continues to hold above the TR3 breakout successfully then it has a likelihood of visiting the previous breakdown area at TR2 (Trading Range 2) marked by red. Potentially even further depending on market conditions.I am bullish on #BTC while price stays above the $21000 area, if price closes underneath there on the weekly or daily timeframe I will consider myself incorrect, meanwhile if it holds above then I will be targeting 26500-32000 as a take profit area (the previous "Bearish Breakdown" areas.
Worth_The_Ri5k

#LINK #Chainlink has been dormant and bearish for quite some time. There are a few key things to note:1. Whales are increasing buying of the tokenYou can visit whalestats.com/analysis-of-the-top-100-eth-wallets to see the top ETHEREUM wallets and what they are purchasing/holding, many are starting to acquire LINK----------------------------------------------------------------------------------------------2. Selling volume decreasing on the chart with trapped sellersThis trading range has been going for quite some time yet the sellers were not able to secure a successful downwards breakout----------------------------------------------------------------------------------------------3. Fitting Wyckoff Schematic quite nicelyThe Wyckoff Schematics help us identify the different between Accumulation and Distribution Trading Ranges - In a Trading Range the price Zig Zags up and down until eventually a breakout occurs, using the Wyckoff Accumulation Schematic we can see there are some clues in the similarities of the chart and the schematic that tell us LINK may be ready for a test of the upper bounds of the Trading Range.
Worth_The_Ri5k

#ETH showing potential signs of Institutional Absorption here.By using Wyckoff Method of Analysis we can try and predict the direction of sideways movements by using identification characteristics on the Wyckoff Schematics.They are to be used as a general guide and paired with volume for a sound analysis of a probable direction.Read below for some intro education to Wyckoff. There is none to little information on Redistribution on the internet so I have created a small introduction below and on the chart.------------------------------------------------------------------------------First, a quick introduction, Who is Richard D Wyckoff?wyckoffanalytics.com/wyckoff-method/"Richard Demille Wyckoff (1873–1934) was an early 20th-century pioneer in the technical approach to studying the stock market. At age 15, he took a job as a stock runner for a New York brokerage. While still in his 20s, he became the head of his own firm. He also founded and, for nearly two decades, wrote and edited “The Magazine of Wall Street,” which at one point, had more than 200,000 subscribers. Wyckoff was an avid student of the markets, as well as an active tape reader and trader. He observed the market activities and campaigns of the legendary stock operators of his time, including JP Morgan and Jesse Livermore. From his observations and interviews with those big-time traders, Wyckoff developed the Wyckoff Method that codified these traders’ best practices into laws, principles and techniques of trading methodology, money management and mental discipline."------------------------------------------------------------------------------What is the Wyckoff Method?The Wyckoff Method is a methodology and set of principles which helps anticipate potential future directional moves of the market, by using these principles the Wyckoff Method can help a trader time when to be in the market and when to sit it out. It also allows us to see which financial assets are weaker/stronger by a comparative analysis of different assets in the same sideways trading ranges. By studying volume we can also gain potential insights of what the "Composite Man" is up to behind the scenes of the market. "…all the fluctuations in the market and in all the various stocks should be studied as if they were the result of one man’s operations. Let us call him the Composite Man, who, in theory, sits behind the scenes and manipulates the stocks to your disadvantage if you do not understand the game as he plays it; and to your great profit if you do understand it."(The Richard D. Wyckoff Course in Stock Market Science and Technique, section 9, p. 1-2)------------------------------------------------------------------------------What are the 4 types of Trading Range structures?Accumulation - GreenHeavy buying phase before uptrend beginsReaccumulation - BlueRebuying to continue the uptrendDistribution - RedAll buying is absorbed by larger interests, end of uptrendRedistribution - OrangeFurther demand is absorbed by institutional interests, continuation of downtrend------------------------------------------------------------------------------Identifying Redistribution:There is hardly any information on the internet regarding Redistribution, and the general consensus amongst traders is that redistribution is the hardest to spot out of the different types of market structures.Institutional interests are usually waiting on both sides of these stops, taking profits at the bottom of the range and quickly shutting down any breakout attempts above the range.The key characteristics of Redistribution: From my experience, Redistribution ranges are the most volatile out of all Trading Ranges, and swing wildly stopping out traders in both directions. The SoW Sign Of Weakness is shown early in the range and potentially towards the middle and end this is a high volume signature move down. There should be a creation and a defined Resistance area above which you can see price consectutively fall underneath struggling to get above, this eventually leads to the final downward breakdown which is confirmed by the LPSY (Last Point of Supply) falling underneath support. There are MANY different Wyckoff Schematics, that work in different ways, this particular schematic I have created an example of represents closely #Bitcoins top earlier in the year for comparison. Check below.BTC Top:BTC Redistribution (This is the LPSY of above image as it fell under)-Distribution can appear inside a Redistribution TR (Trading Range) as Accumulation can appear inside of a Reaccumulation TR-Richard D Wyckoff------------------------------------------------------------------------------So using the above ideas, if ETH fails to get back above the $4000 region soon it could be in trouble here at least in the short term, if we get a strong volume bounce above $4500 I will consider myself fully wrong for now.I hope you enjoyed the analysis, feel free to share your thoughts and critiques in the comments and thank you for reading.
Worth_The_Ri5k

ENJUSDT (Enjin) showing a picture perfect wyckoff structure, see image attached.Volume has increased steadily to the buy side since breakout.Panic sell into previous resistance and failure to fall under is a sign of strength for a possible BU (Back Up) Action.------------------------------------------------------------------What is Wyckoff Method?------------------------------------------------------------------"One objective of the Wyckoff method is to improve market timing when establishing a position in anticipation of a coming move where a favorable reward/risk ratio exists.In accumulation, the shares purchased outnumber those sold while, in distribution, the opposite is true. The extent of accumulation or distribution determines the cause that unfolds in the subsequent move out of the TR (Trading Range) ."Wyckoff Theory & Schematics give us clues to which probable direction the price may head out of the horizontal moving price structure.In a Accumulation Trading Range the key characteristics are the ST or Spring below the Trading Range, and the SoS's Signs Of Strength with strong breakout volume at the upper end of the range.Just a quick update, Going to call this one off until BTC Stabilizes, and we see confirmation of a small bounce off the upper range at least, until then waiting it out.
Worth_The_Ri5k

Head & Shoulders ExplainedThe Head & Shoulders Pattern & Inverse Head & Shoulders Patterns are quite common on Bitcoin and have had great results on the higher timeframe charts.Here are the main characteristics:• VOLUME MIMICS PATTERN• 3 PEAKS, LEFT & RIGHT SIMILAR HEIGHT• TRIANGULAR IN APPEARANCE• FOUND AFTER UPTREND• HIGH SUCCESS RATE• CAN BE SLANTEDPrice forms 3 distinct peaks after a strong uptrend, the left and right peak should have a similar height (shoulders), the middle peak (head) has to be the highest or this can not be a HS pattern . They should seem triangular in appearance but as long as it fits the main characteristics can still be a valid pattern.The right shoulder should form a lower high which is a early sign of trend change, this is entry A, with entry B being the bearish retest of of the “neckline” (marked on chart #2). The idea is to gain an early entry on the pattern at point A to maximise profits and reduce risk. Once price moves above the middle "peak" it is likely that the pattern is not valid anymore so this allows us to get a tight stop loss upon entry. We measure the height of the pattern and add it to the breakout level for a maximum possible price target.Volume should also paint the same pattern with the 3 peaks, strong volume on breakout increases success rate.-----------------------------------------------------------------What is General Pattern Failure?General Pattern Failure occurs when a chart pattern breaks out, fails to hit target, quickly reverses then rejects off that same breakout level back inside the pattern continuing in the opposite direction of the breakout.Pictured above in the original post on the left (its quite small but zoomed out to get the bigger picture) is a normal breakout on a Head And Shoulders Pattern. Note how it matches the first example (top left, "Normal Breakout").General pattern failure can also be considered a Liquidity Grab or can be referred to as a “Fake Out” also when it happens more rapidly after the original pattern breakout.In this example (top right as the example, pointing to the live chart at bottom right) it has come back up to the Head & Shoulders pattern after a long extended period of time, this doesn't mean the failure still cannot occur.Once price gets back inside the pattern chances of higher prices are more probable.-----------------------------------------------------------------Learning to trade patterns such as these can provide great opportunities if you understand price action and how to identify the key areas of the pattern that other traders and investors may be focusing on too, these areas become important psychological levels on the chart.If you found the idea insightful please share, like or comment, Thank you!
Worth_The_Ri5k

Really simple concept here on ETH/USDT Chart with a classic Support & Resistance Flip.Below I will briefly explain these concepts and what this potentially means for Ethereum.----------------Orderblocks:----------------Orderblocks are small (usually square shaped) candlesticks that precede major market moves, market analysists mark these Orderblocks (OB'S) on their Technical Analysis charts in hopes that when price revisits these levels in the future a strong reaction will occur.A Orderblock is a form of Support or Resistance. (Either or both depending on where it is located)----------------What is Support & Resistance ?----------------When price revisits the same area in succession and increases in value with each consecutive touch a "Support Area" can be formed, other analysts and traders may be looking to purchase at these areas in anticipation of higher prices.When price revisits the same area in succession and decreases in value with each consecutive touch a "Resistance Area" can be formed, other analysts and traders may be looking to sell assets at these areas in anticipation of lower prices.----------------Support & Resistance Flips----------------Notice on the ETH/USDT chart we were previously above the Daily Orderblock for a Extended period of time (marked with White Tick) now we are back underneath this area (marked with White X), that means that in this example the previous area of Support created by the Orderblock has now flipped into the current area of Resistance.These "flips" can also occur in the opposite direction with price pushing up against a defined Resistance Area, which then flips to Support.The more touches over time on the same area, the weaker it becomes.----------------Conclusion----------------By using this simple method we can clearly see ETH/USDT is showing weakness here and lower prices are possible (although not 100% guaranteed). The invalidation (an opposing scenario which would completely negate this idea) would be as follows:You can see how the price clearly has a strong reaction BACK ABOVE the previous support area.----------------If you found the idea informative & insightful then share the love with a like & comment, thank you!
Worth_The_Ri5k

Quick #BTC Update:1. We are clearly uptrending with a strong break of diagonal resistance2. We are approaching the rejection level of the large Head & Shoulders pattern and if price stays above 49500 we could see a strong push to 55-57k which signifies failure of the previous pattern3. We are moving upwards in a slanted trading range, while in this structure and not below we can expect an upwards breakout (following the previous trend leads to success usually)4. Jack Dorsey (CEO of twitter) may be adding BITCOIN payments to the platform, extremely bullish news in my opinion.coindesk.com/markets/2021/06/11/jack-dorsey-suggests-twitter-likely-to-integrate-lightning-network/Where is invalidation? I will cut my trade probably if we lose $48,000 region.Playing out perfect so far, 49500 is important to hold above!
Worth_The_Ri5k

Looking for a bounce at $1.13 to start the push for the reclamation of trading range, if it fails will look for next signs of absorption for re entry at 0.84-0.90 cents.
Worth_The_Ri5k
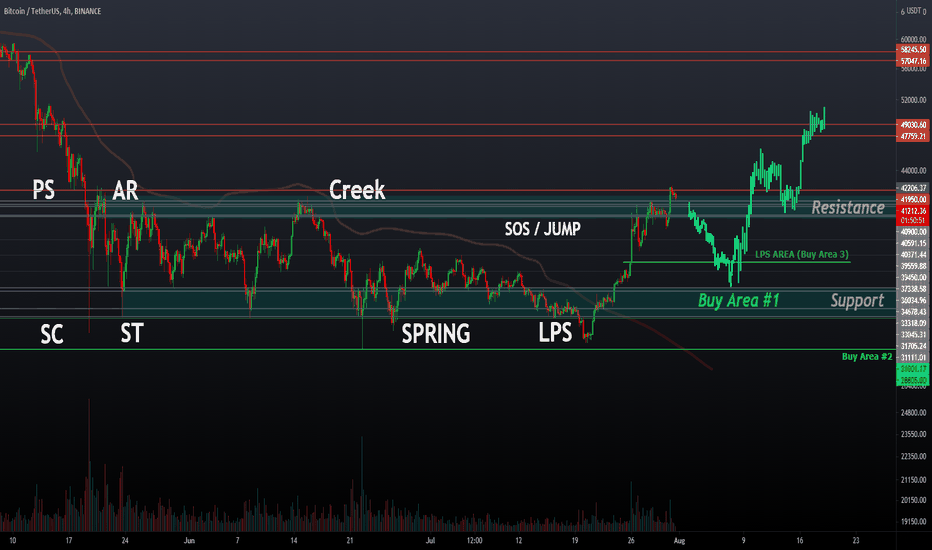
Basic Introduction to the Wyckoff Method:school.stockcharts.com/doku.php?id=market_analysis:the_wyckoff_methodCurrent Schematic:ibb.co/m4F5g9jOld Ideas:---------------------------------------------Trading ranges ( TRs ) are places where the previous trend (up or down) has been halted and there is relative equilibrium between supply and demand . Institutions and other large professional interests prepare for their next bull (or bear) campaign as they accumulate (or distribute) shares within the TR .In both accumulation and distribution TRs , the Composite Man is actively buying and selling - the difference being that, in accumulation, the shares purchased outnumber those sold while, in distribution, the opposite is true. The extent of accumulation or distribution determines the cause that unfolds in the subsequent move out of the TR ."--------------------------------------------------In this Wyckoff idea we can see we have clearly reclaimed and broken out of the trading range, if you observe the below schematic I believe we are currently looking to put in #14 LPS at this stage, I would hope for an LPS around 35-36k but that is not a guarantee and if the Fear Of Missing Out is strong in this market then an LPS bounce at 38-39k would make more sense. -------------------------------------------------To put it simply, I am expecting a retracement on Bitcoin and this to be the last great buying opportunity we have before pushing towards the earlier highs at $60,000 region again.See the above Wyckoff Schematic and look at #14 LPS For cross referencing, this is the next stage we are looking for.My personal buy in levels recently are in green, my target areas are in red.If we break above $42,000 then we are probably not going to come down. Below are my different scenarios im looking for here.Great result on this idea hoping for BTC to continue this Bull Market with the confirmation of Head & Shoulders failure like so :Example:
Disclaimer
Any content and materials included in Sahmeto's website and official communication channels are a compilation of personal opinions and analyses and are not binding. They do not constitute any recommendation for buying, selling, entering or exiting the stock market and cryptocurrency market. Also, all news and analyses included in the website and channels are merely republished information from official and unofficial domestic and foreign sources, and it is obvious that users of the said content are responsible for following up and ensuring the authenticity and accuracy of the materials. Therefore, while disclaiming responsibility, it is declared that the responsibility for any decision-making, action, and potential profit and loss in the capital market and cryptocurrency market lies with the trader.