
WiseAnalyze
@t_WiseAnalyze

What symbols does the trader recommend buying?
Purchase History
پیام های تریدر
Filter
WiseAnalyze
BTC at the bottom of GTF range
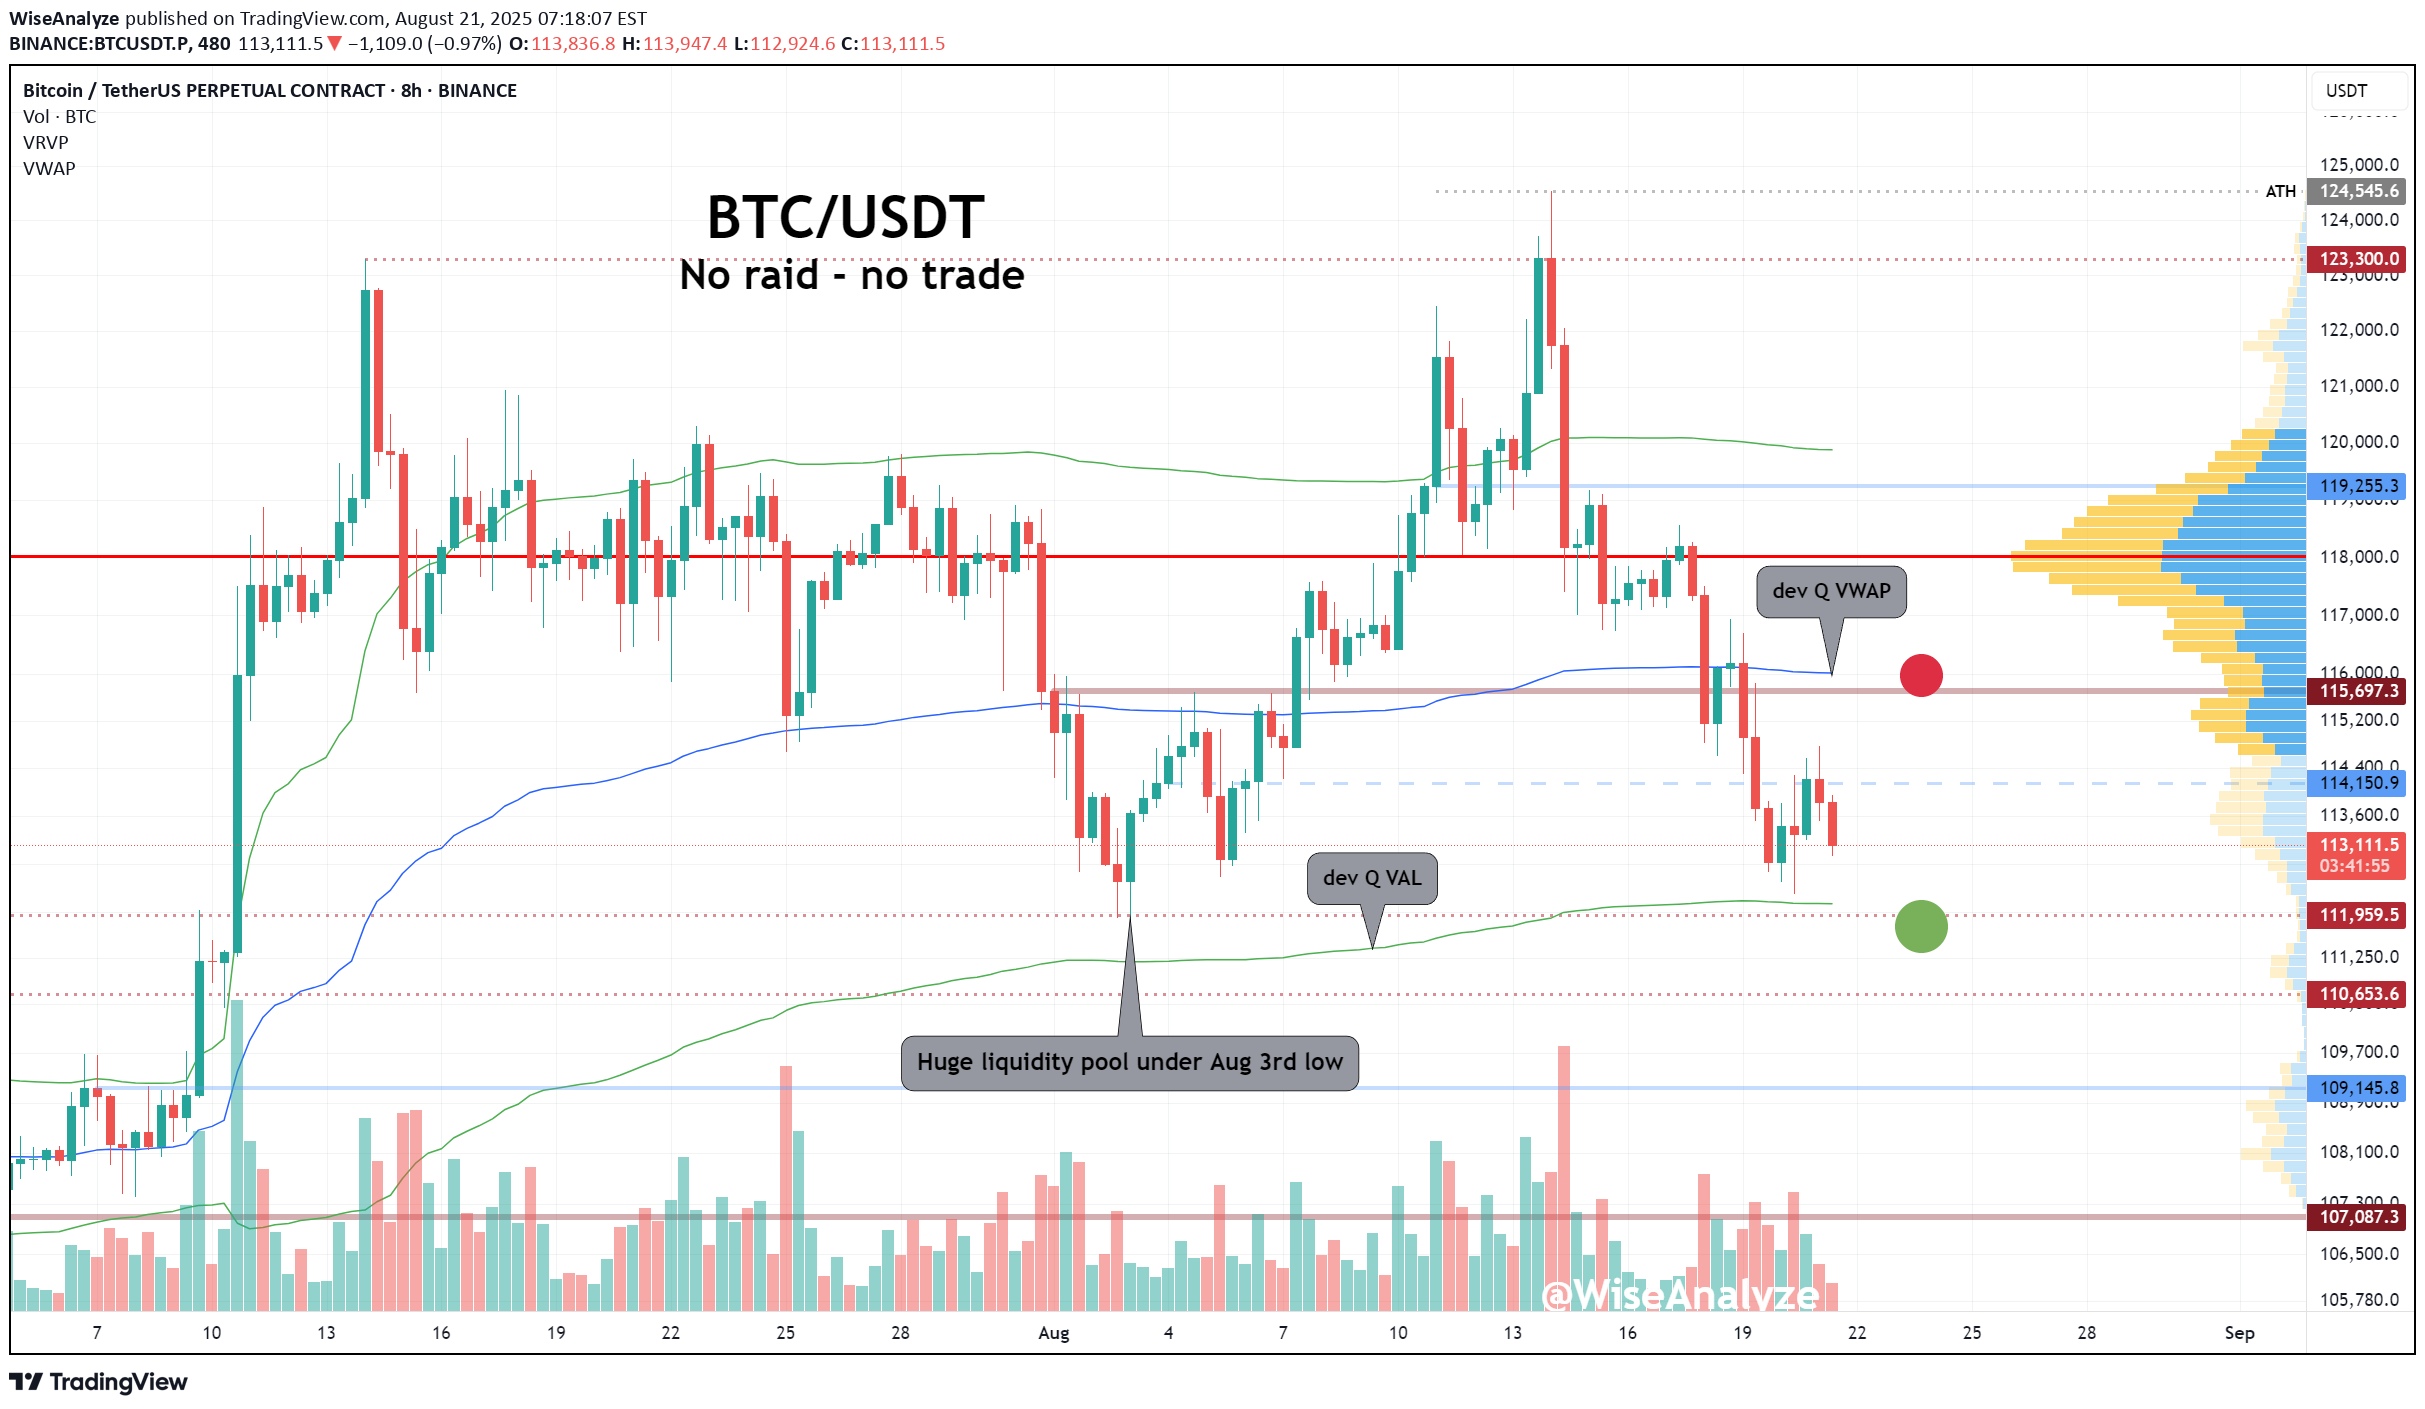
🎯 Key Levels to Watch: • Above: 114150 / 115700 / 116455 • Below: 112300 / 111850 / 110653 🔥 BTC Liquidation Heatmap: • Above: 114957 / 116098 / 116953 • Below: 112866 / 112201 / 110061 Liquidity pool under 111850 remains major magnet for the price. Will it be wiped out or not, no one knows for sure, but chances are very high. Especially since stocks took a hit yesterday. So either BTC dips and pumps back up fast, or that can turn into full scale correction down to 109k at least. Developing quarter VWAP and Daily 20sma now form the strongest resistance on the way from 116010 to 116455 (values are approximate). ⏰ TG alarms set for: 111850, 110432, dev Quarter VWAP/VAH & Day 20-sma
WiseAnalyze
Important level here for ETH
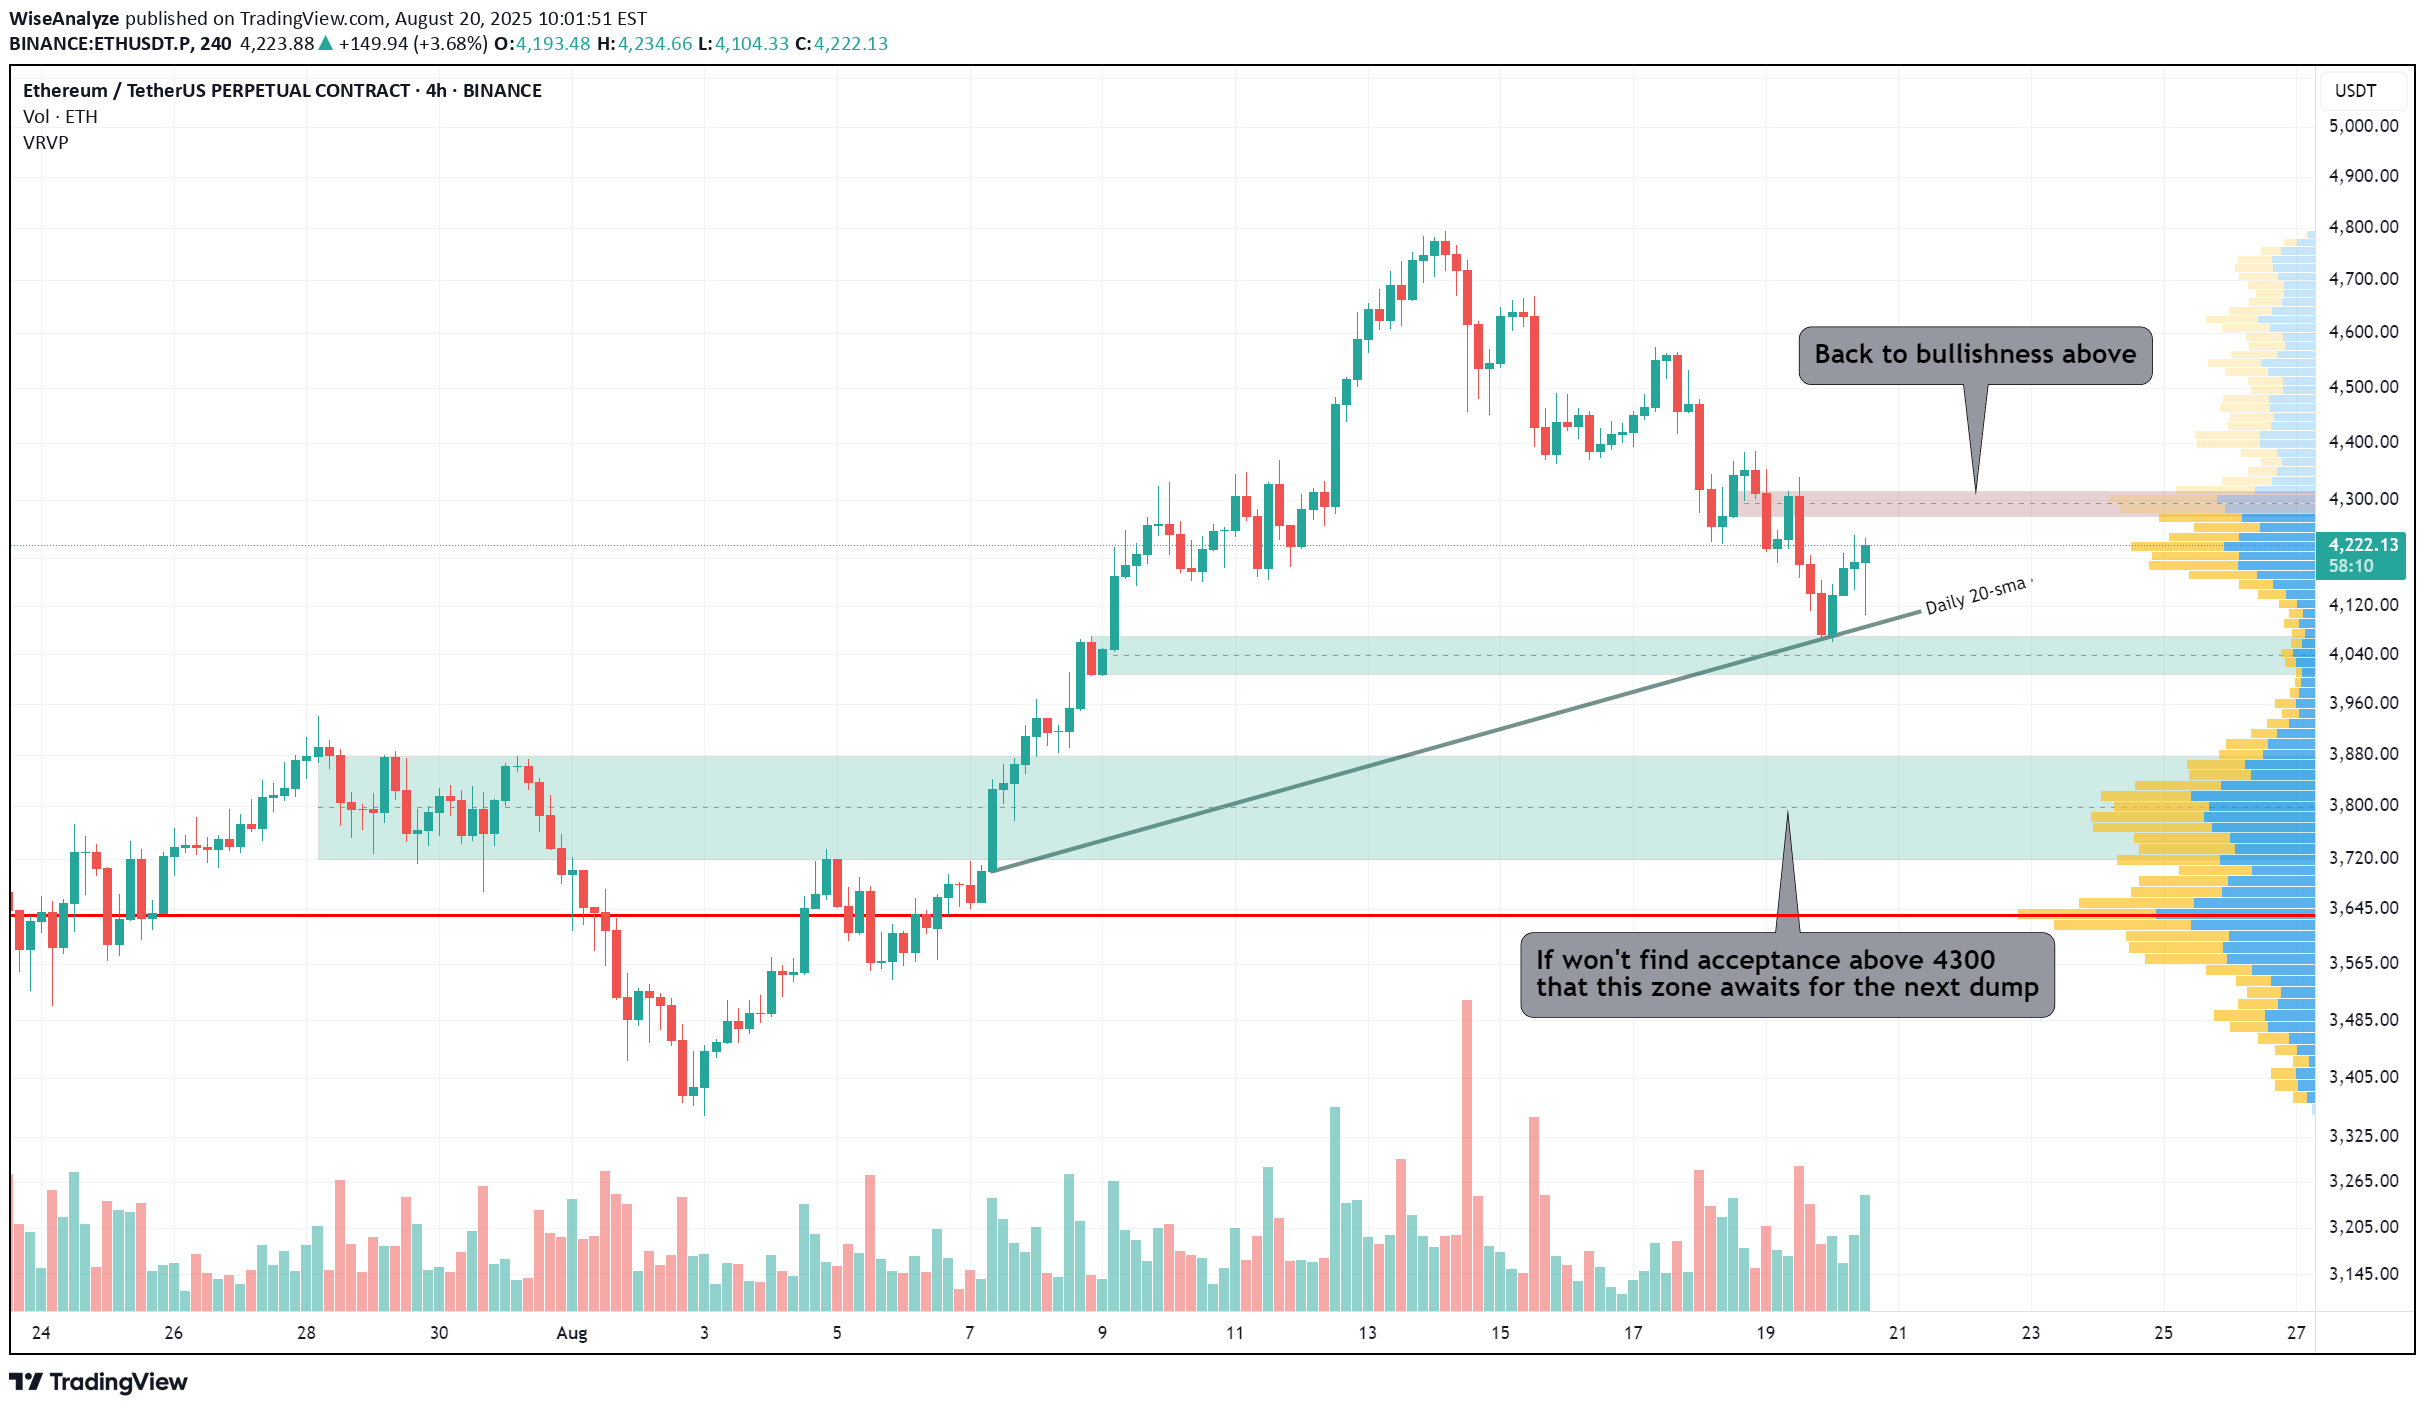
🎯 Key Levels to Watch: • Above: 4240 / 4340 / 4470 • Below: 4090 / 4010 / 3940 🔥 ETH Liquidation Heatmap: • Above: 4229 / 4275 / 4316 • Below: 4082 / 4040 / 3972 Ethereum just touched Daily 20sma at price ~4066 I bought some there, but frankly, I expected it to fall lower and most of my orders are still there. Unless ETH grows above 4300 and start trading there, chances for another dip to 3940-4010 stay valid.🎯 Key Levels to Watch: • Above: 4386 / 4470 / 4631 • Below: 4240 / 4140 / 4010 🔥 ETH Liquidation Heatmap: • Above: 4356 / 4390 / 4576 • Below: 4224 / 4182 / 4042 Ethereum now outperforms BTC. Grown back above developing quarter VAH and last week open. Bullihs engulfing on Daily. That gives be bullish vibes and a hope that ETH can actually save the market and start growing towards 4470 and maybe 4600. On the other hand the rest of the market looks like shit, so its a big question, if ETH alone can change the picture. But if stock market won't fall lower, ETH will certainly take advantage. Since ETH started reversal move, if it eventually lose last swing low, can dump even lower than I wrote before, as 4k is just the top of that potential zone where 3700 can be the bottom.
WiseAnalyze
CRV still bullish on HTF, but dips are possible
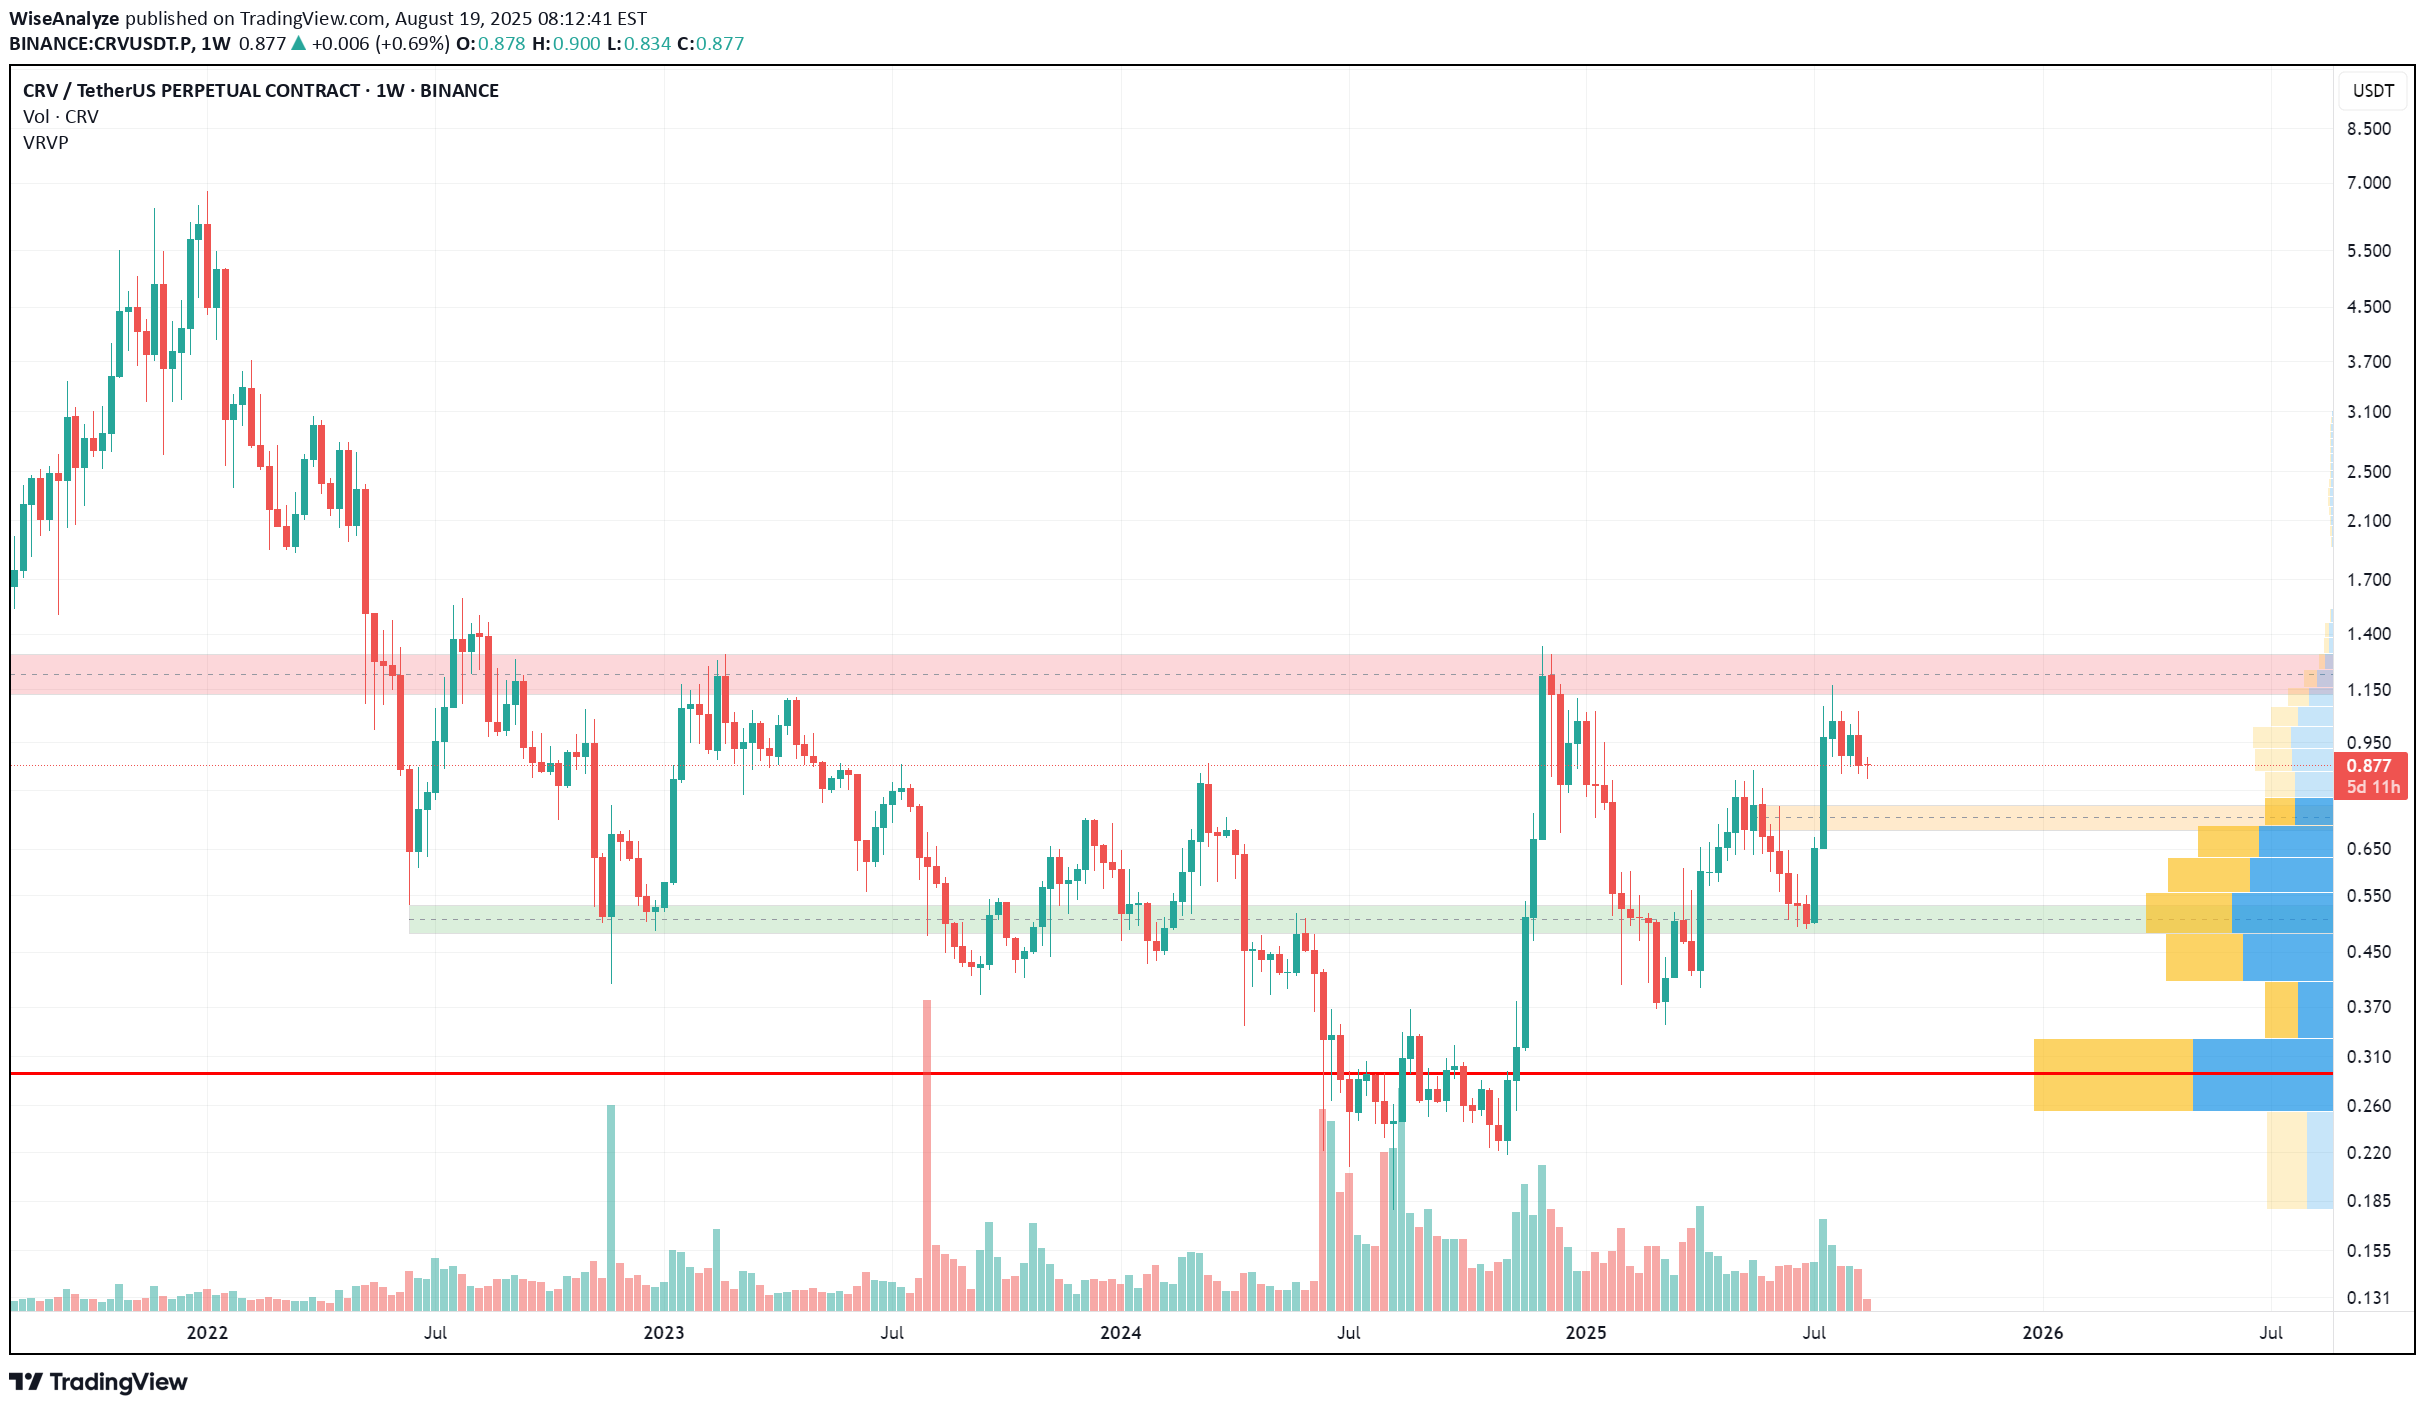
On higher timeframes CRV still look awesome, although last week's dump increased chances for lower correction. But that still can change if price returns back above 2024 close - in this case only 0.99 will be on the way to breakout. I don't have any CRV on spot. Not that I don't like it - just not ready to load a bag above 0.75 (might miss it completely, but I don't care)
WiseAnalyze
ADA bullish reversal possibility
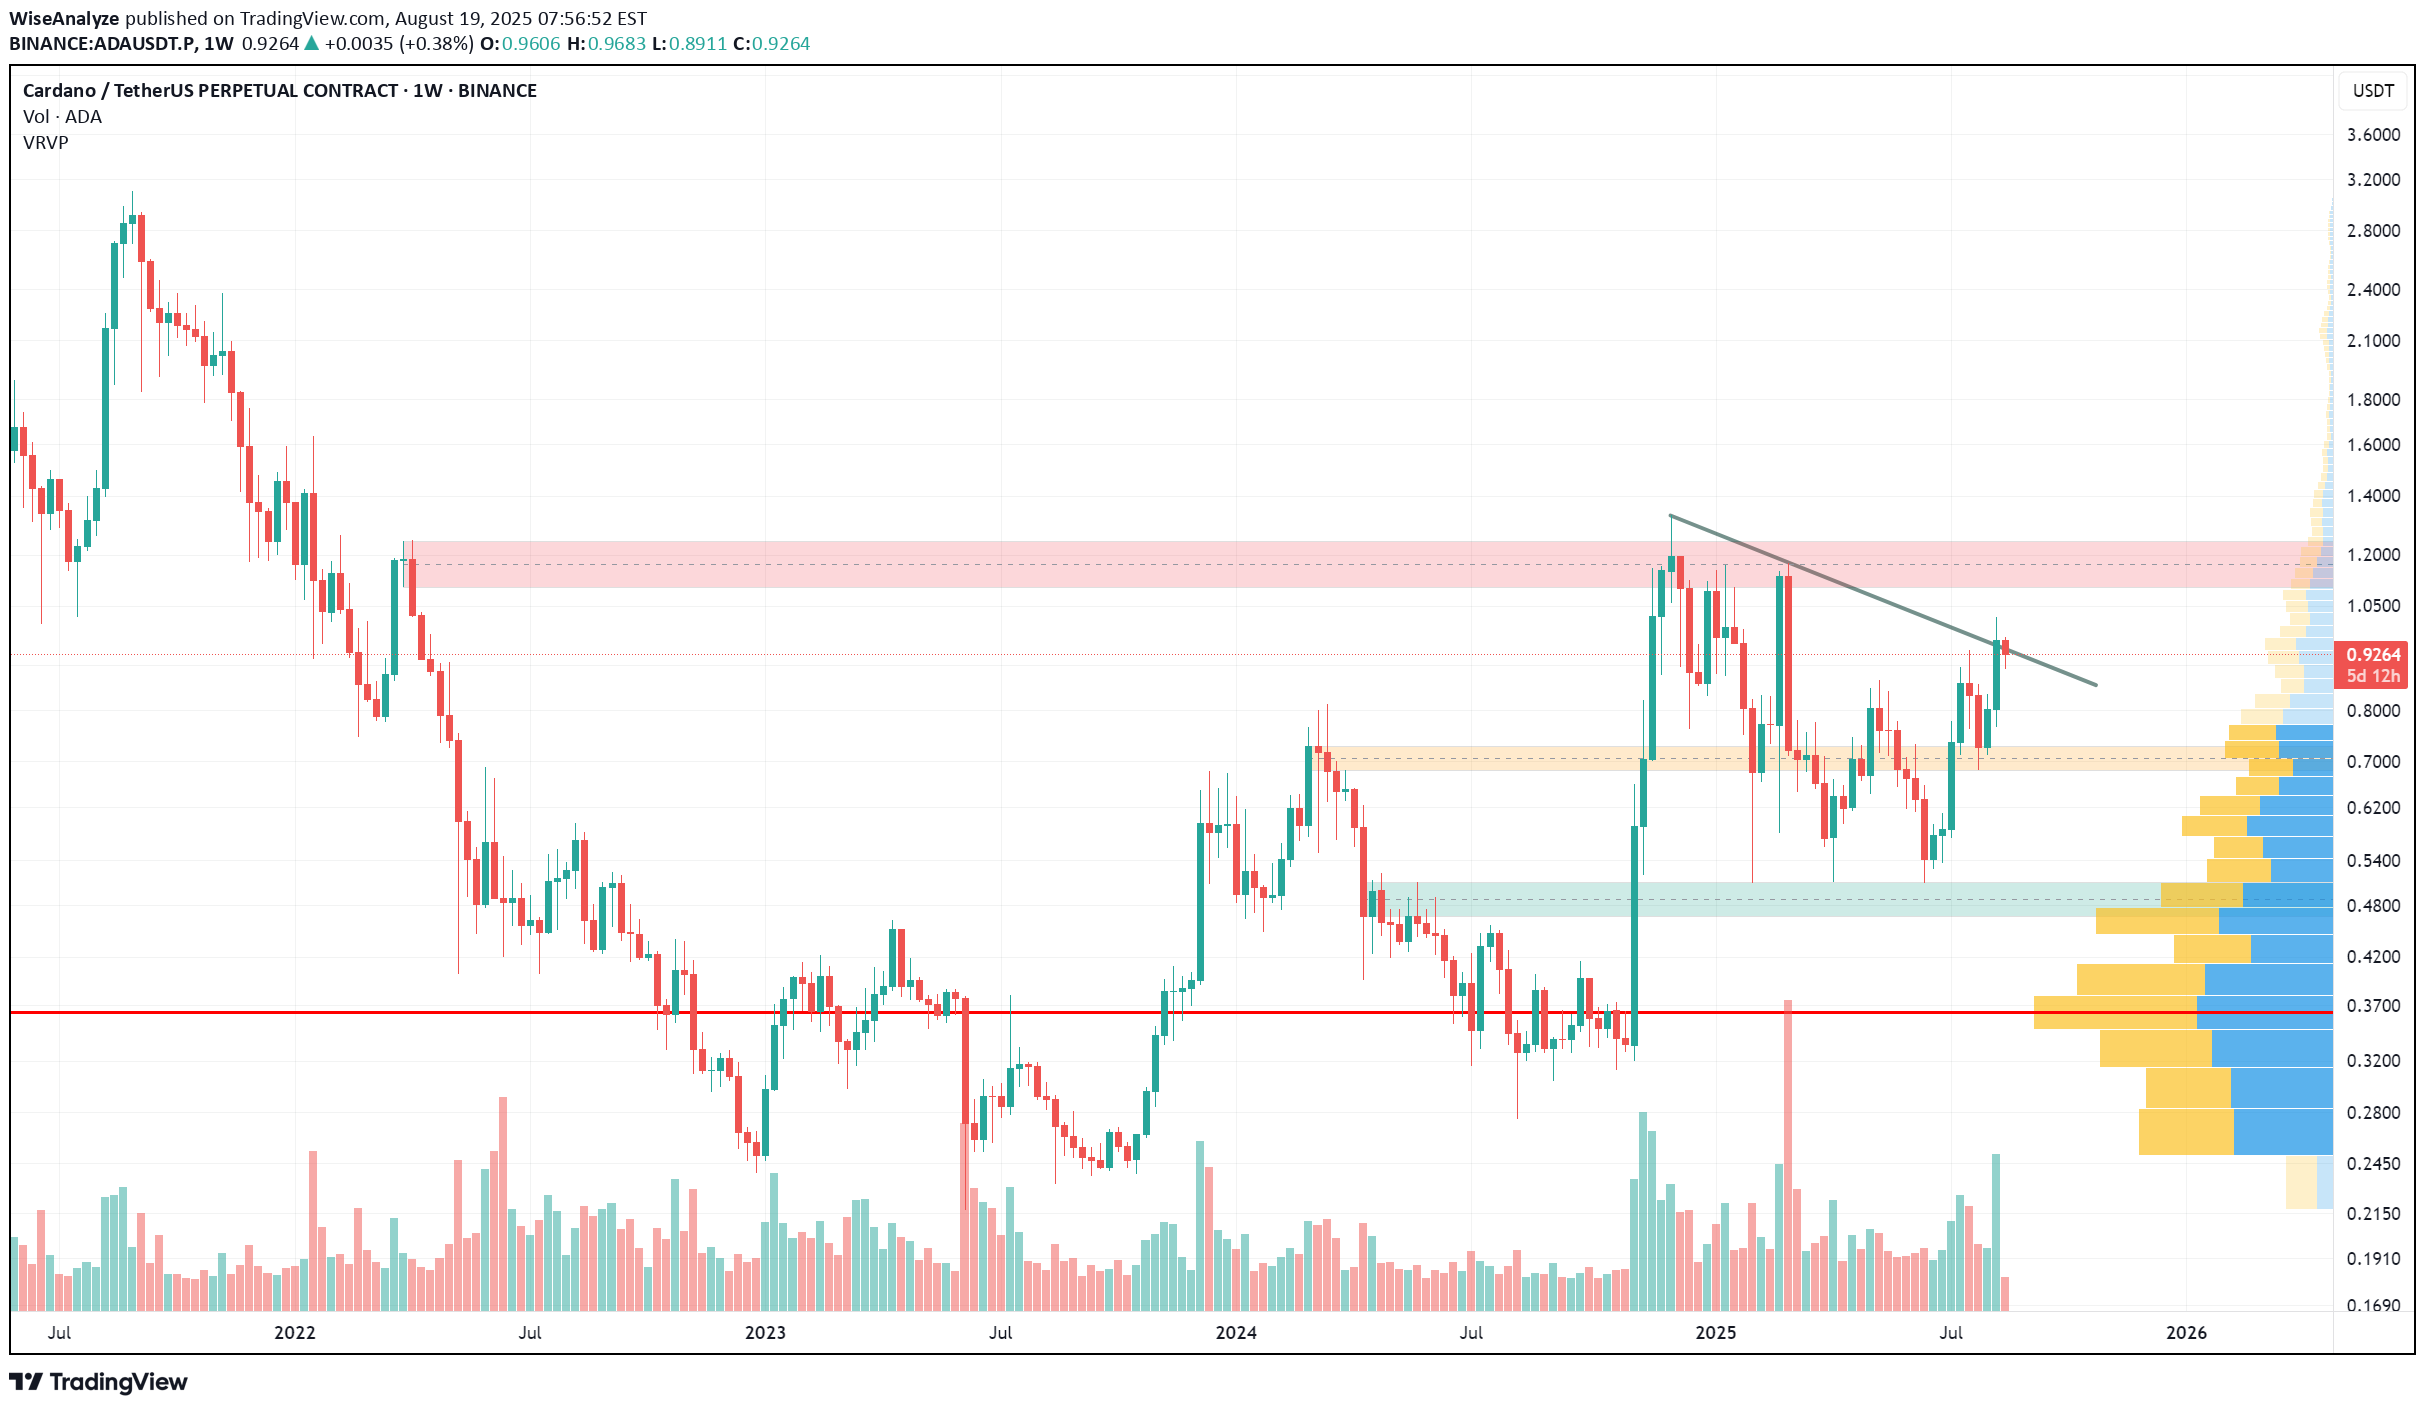
ADA seem to be returning back to uptrend. At least it should grow to the top of that consolidation range around 1.1-1.2 Dips to 2024 close at 0.845 may be expected. Wicks can go below that level (down to 0..8), but for bullish bias to stay strong price shouldn't lose that level.
WiseAnalyze
Another attempt to reverse from the downtrend
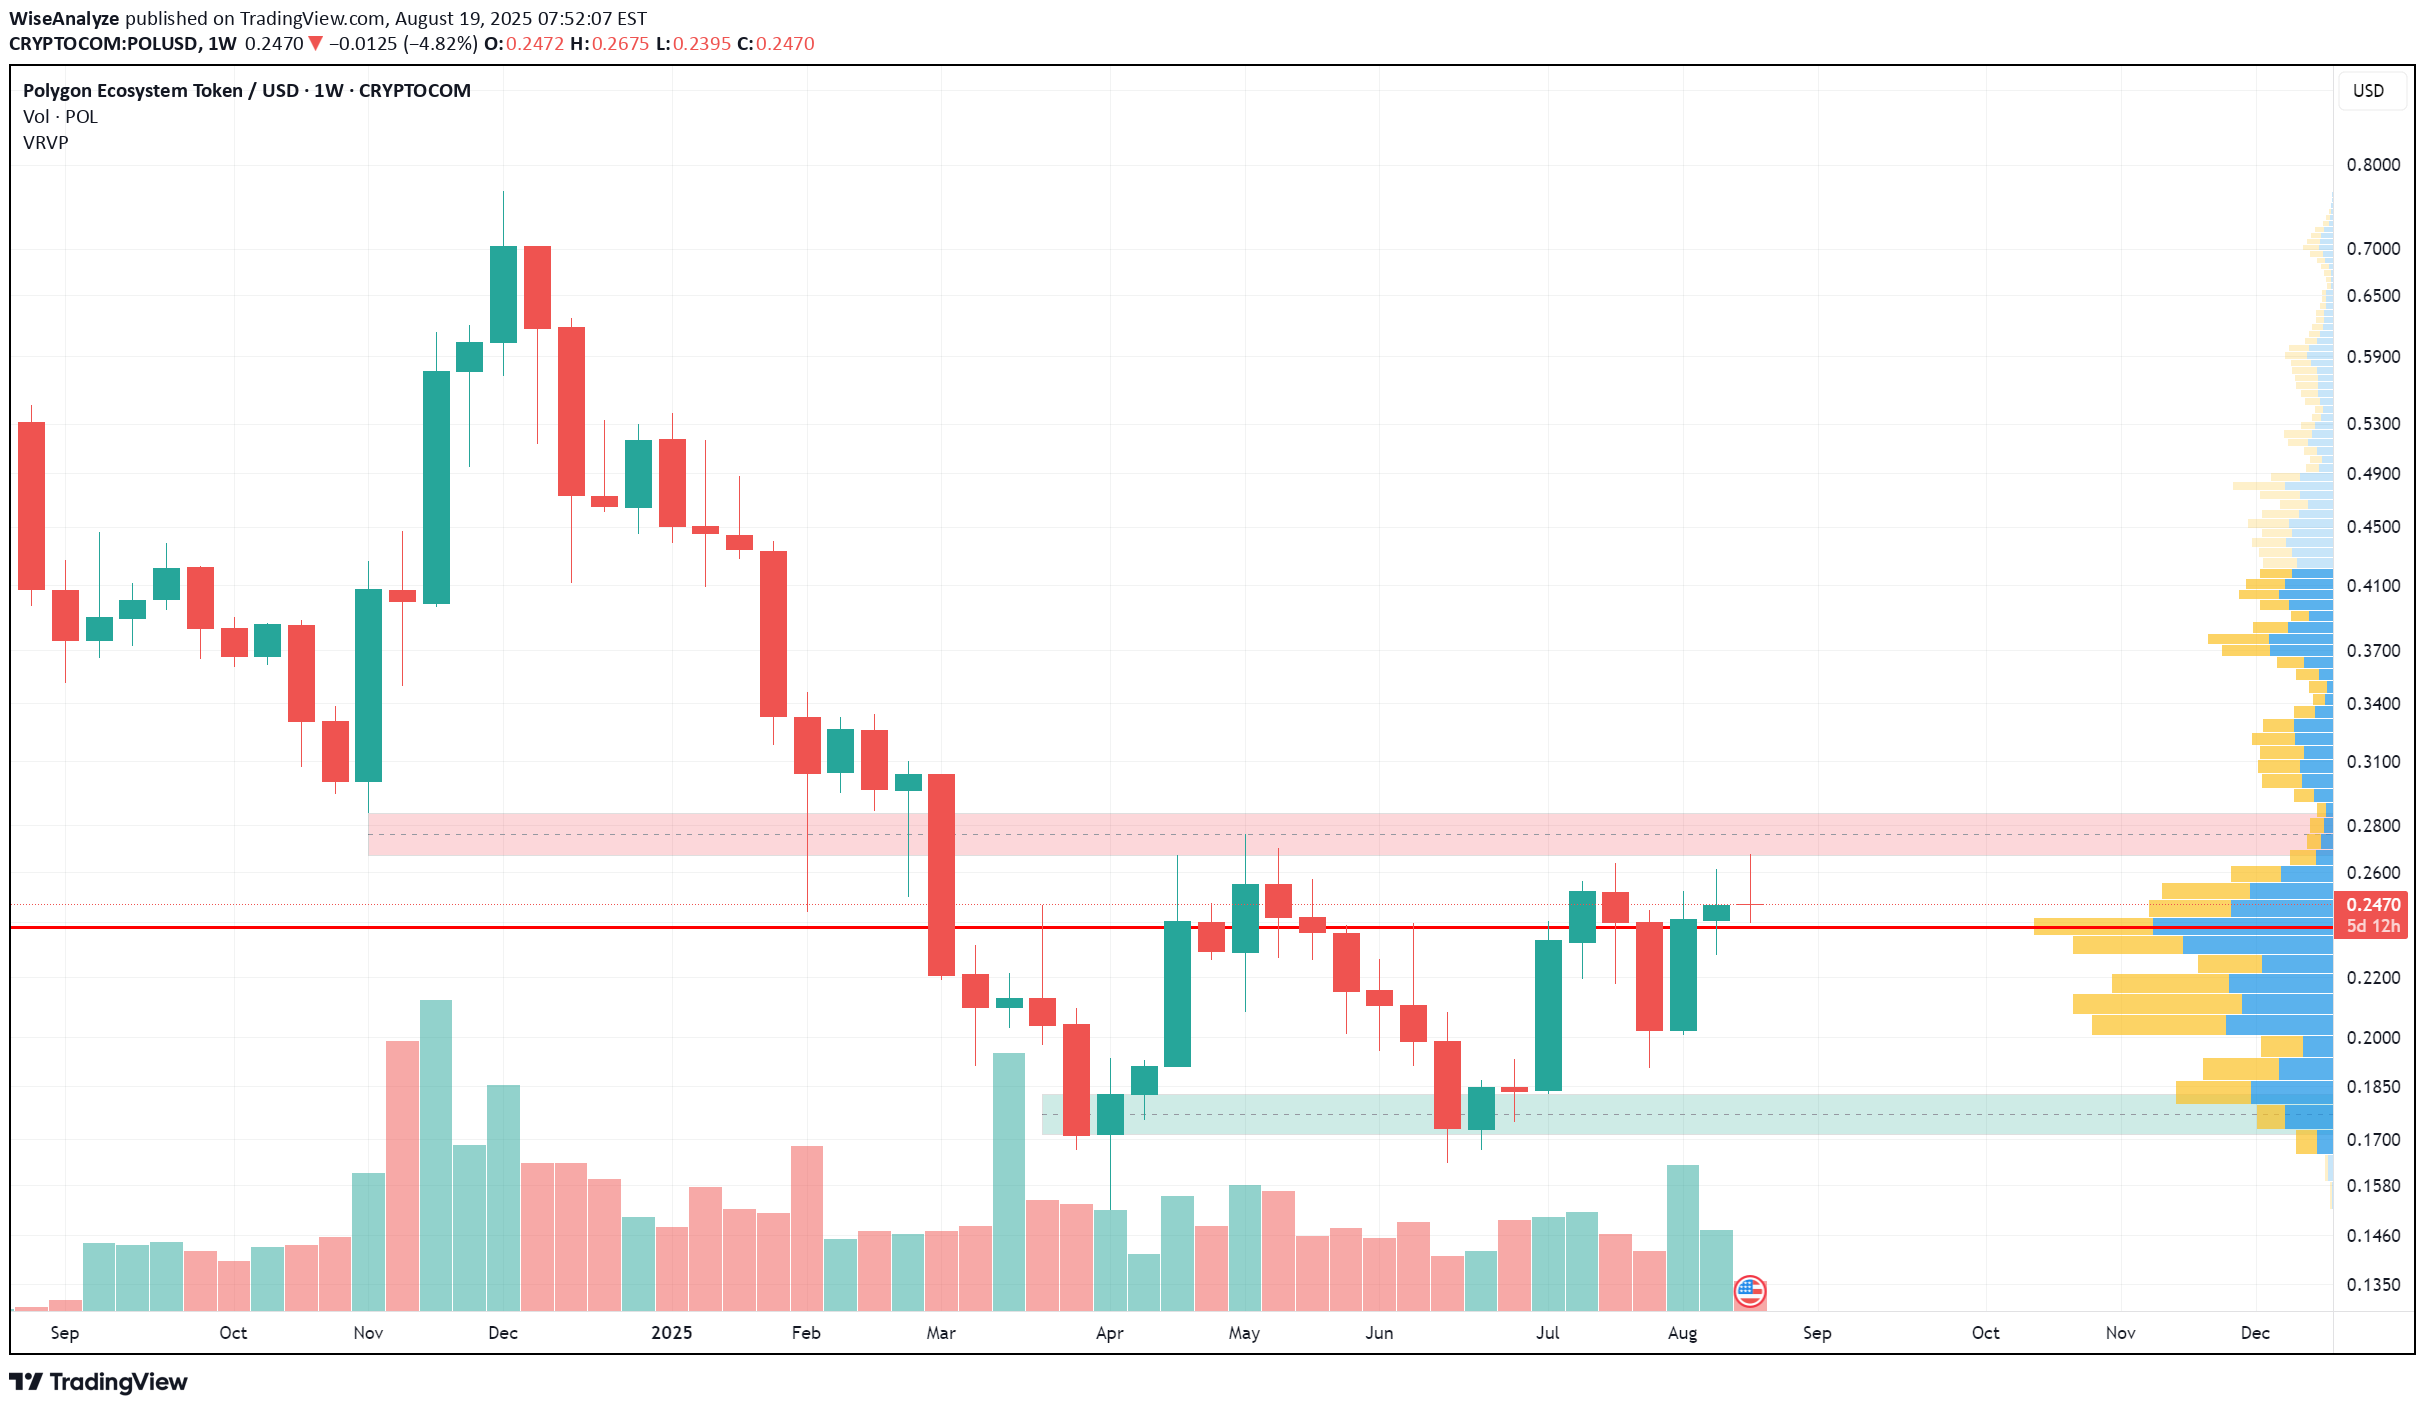
POL (MATIC) remain within downtrend on higher timeframes, but on daily shows intentions to grow higher. Red zone is old range bottom formed since token listing in 2021 and tested 4 times before break down. July 8th scam pump wick re-tested that level from below for the first time. So if manage to get there again, that will be the second time. Monthly 20-sma moves in a downtrend - now around 0.468 and next month might be around 0.43 - that major dynamic SR is a magnet for price. At least when divergence becomes too large. So it can be taken as a target for future PA. Smaller TF consolidation range is within 0.227 and 0.265 - will move within it till break in one of the directions.
WiseAnalyze
Correction or just a bullish dip?
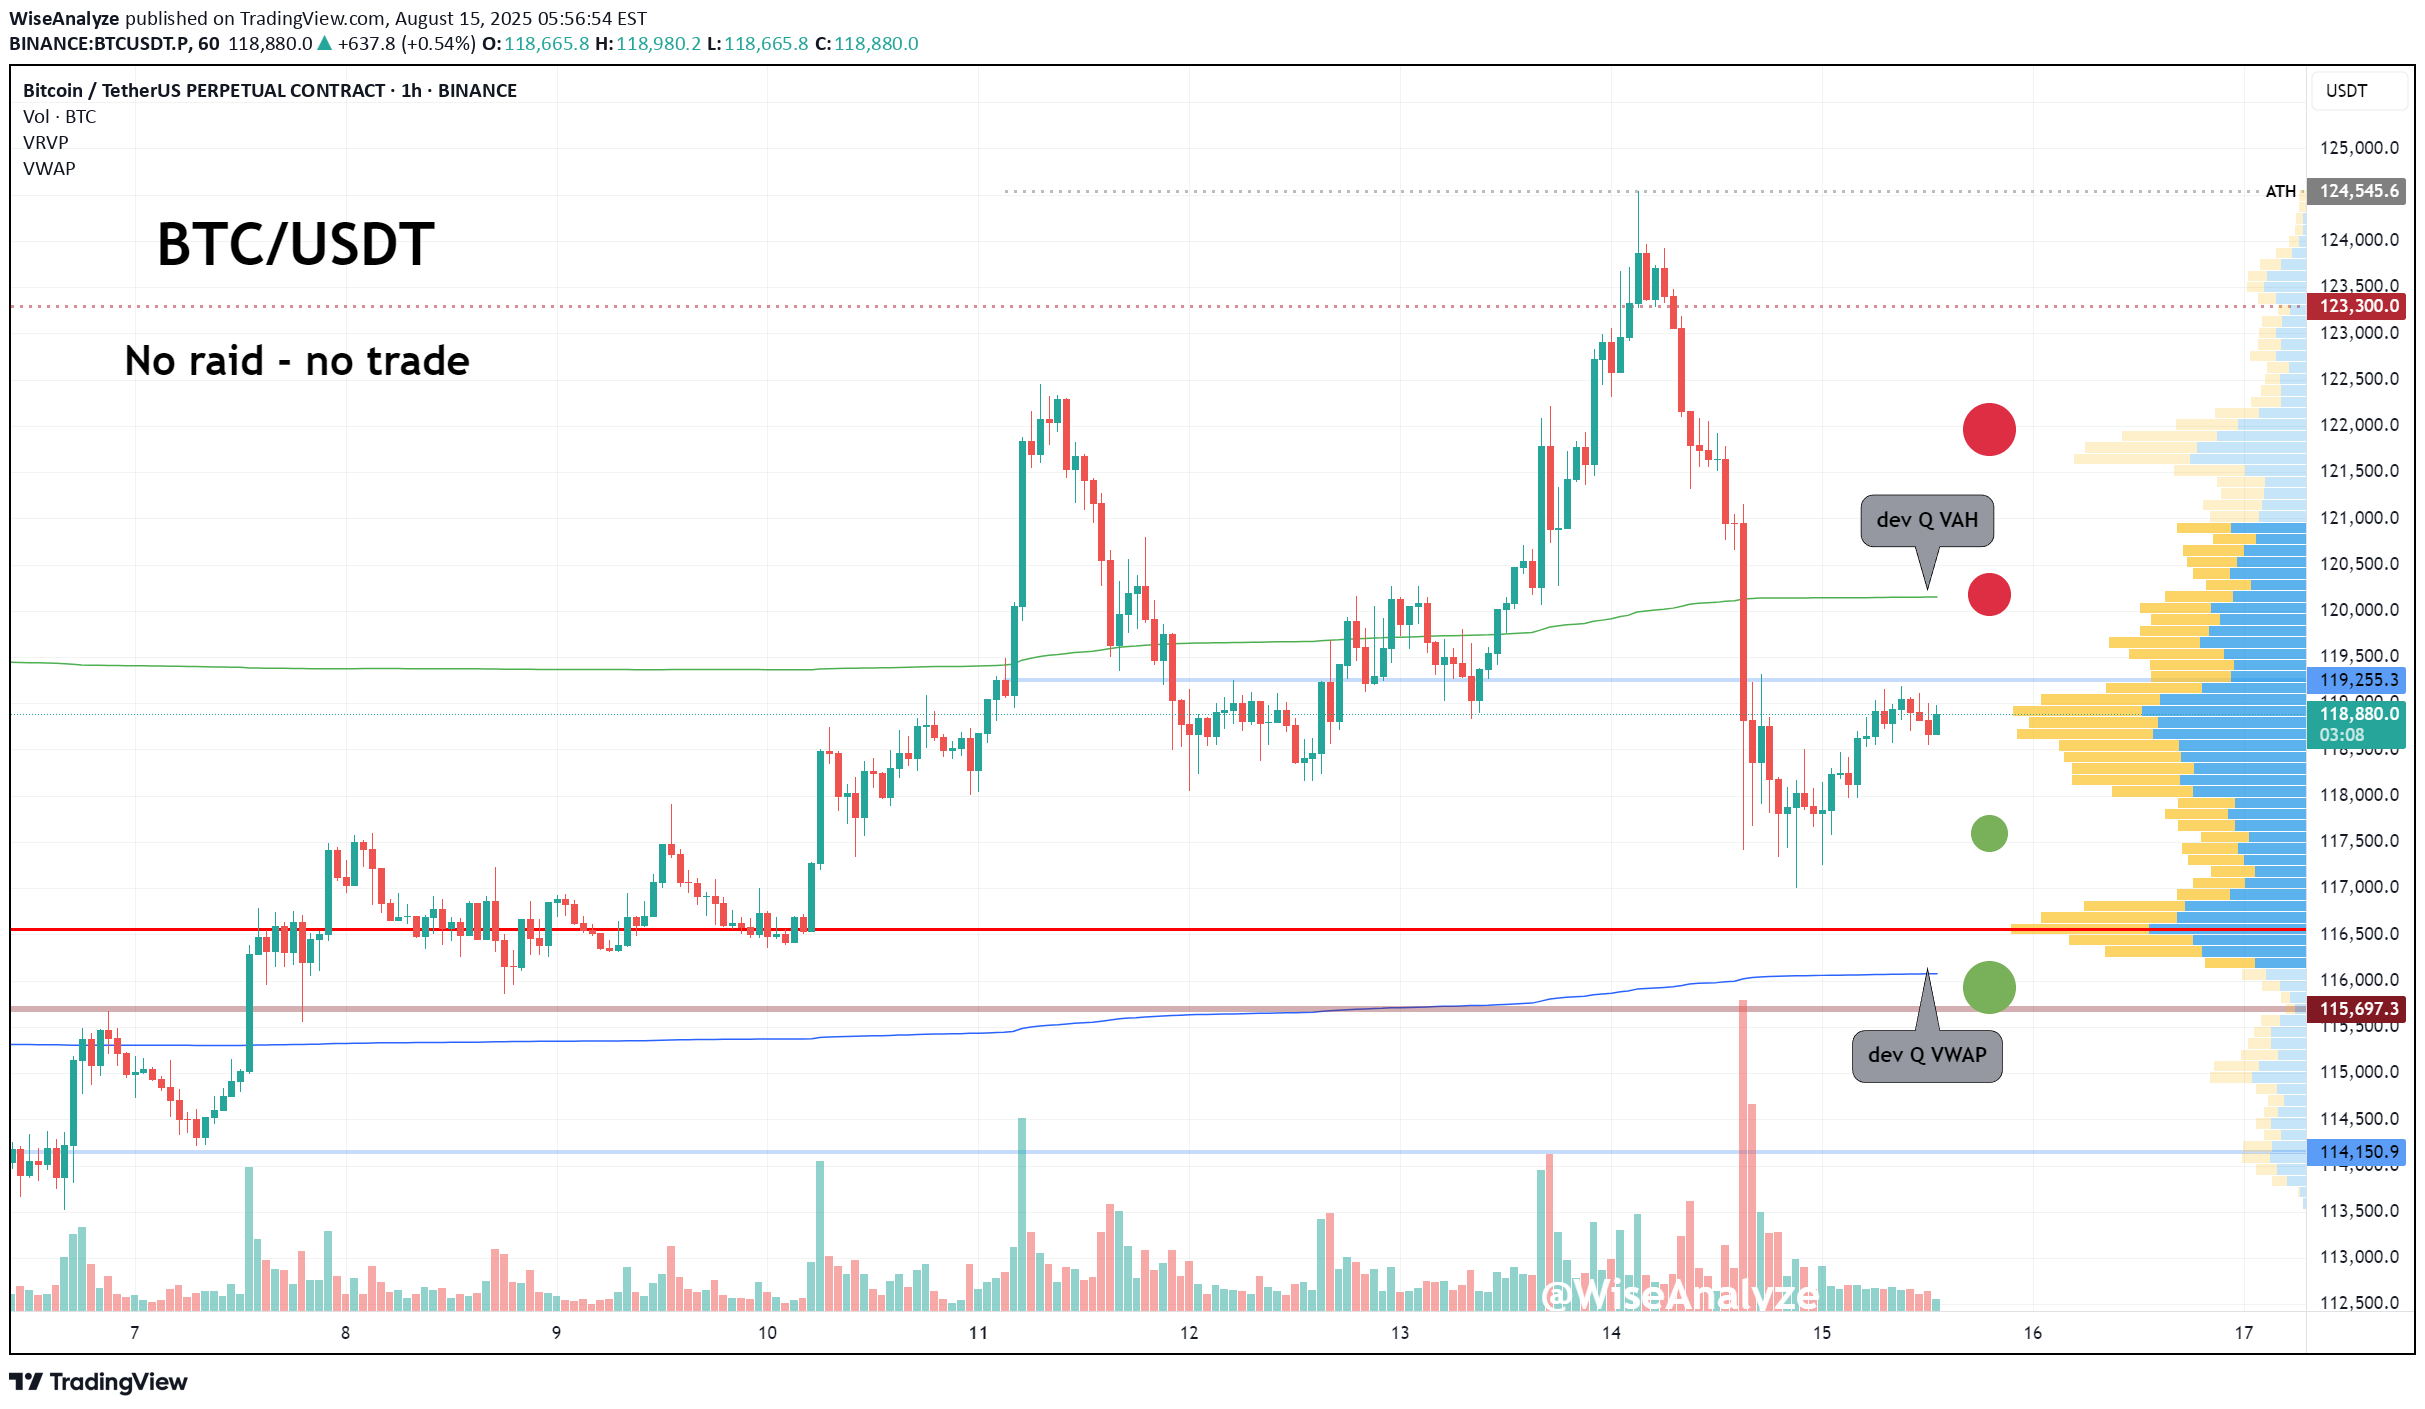
Bitcoin dumped all the way to Daily 20-sma and found temporary support there. Day candle formed bearish engulfing. Strong downside move often cause a dead cat bounce first, but dump momentum may take price lower on the following swing. 🎯 Key Levels to Watch: • Above: 120066 / 120900 / 122092 • Below: 117940 / 117400 / 116630 🔥 BTC Liquidation Heatmap: • Above: 119400 / 120090 / 122174 • Below: 117095 / 116060 / 115484 Short term range ~117400-119255. Price will swing in between till break one way or another. Most probable bounce target is re-test of zone above 120k which correlates with Wednesday NY low and developing quarter VAH. If there will be another dip, nearest liquidity pool is within 115485-116060 zone. ⏰ TG alarms set for: 122092 (Tokyo low), 120066 (week open), 117400 (LTF range low), dev Quarter VWAP & VAH & Day 20-sma
WiseAnalyze
Sell in May and go away, but when?

🧭 Current Situation: 📈 Market remains bullish, but I anticipate possibility for S&P500 to drop on US open. If that happens, BTC can also make a dip, but since it looks much stronger than stocks, that drop might not be a big one. Nevertheless area around 95k looks very attractive. ⚠️ Price will need to show stronger bearish pressure to trigger any real panic or sell-off. Until then, this looks more like healthy volatility within trend continuation. 🧱 The breakout level at 95770 was already re-tested, so it’s now off my watchlist. The next meaningful support is around 95K flat. --- 🔥 CME Gap Update: 4H CME gap has expanded — now stretching from 95280 to 96560 This zone will act as a magnet in the coming sessions until it gets filled. Just a quick reminder — 4H CME gaps are not as strong or reliable as Daily gaps. They don’t carry the same close rate or magnetism. However, they can still offer directional hints and serve as target zones, especially in short- to mid-term setups. Use them as guidance — but don’t treat them like guaranteed gravity wells. 🎯 Key Levels to Watch • Bullish Targets: 97666 / 98500 / 99431 • Bearish Targets: 94971 / 94125 / 93550 --- 🔥 BTC Liquidation Heatmap Above: 97530 / 98191 / 98998 / 100100 Below: 96063 / 95623 / 94670 / 93715
WiseAnalyze
Bitcoin consolidation range

Unfortunately so far it looks like BTC is forming a bullish consolidation range (bull flag/pennant) on month timeframe. I don't like that scenario as it leads to very choppy and bloody spring and summer, all the way till quarter 4 when BTC finally breakout. But I still have full confidence in my cycles chart. Forth quarter will be epically bullish .
WiseAnalyze
Two Daily Gaps attract market for pullback
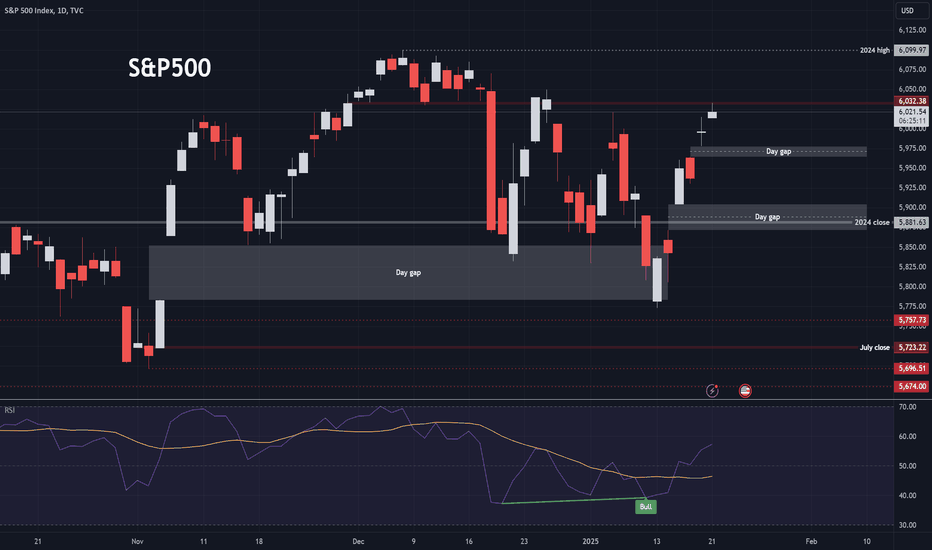
Although S&P500 is within uptrend, recent days has left two clearly visible gaps behind. That means that it is highly possible that SPX will come back to cover those gaps in the near future, before it continue uptrend (if it will). Same picture at NDX chart with two 4H gaps. I take this idea to apply to all markets including crypto. While chances to resume higher timeframe uptrend are valid for Bitcoin, Stock Indices will most probably influence it's short term price action.One gap closed, another appeared. Now in the progress of being closed. I think eventually wee will see lower gap closed as well before SPX will be free from those magnetic fields.
WiseAnalyze
GOLD on an edge of breakout

Gold already made 3 attempts to breakout and now in a process of forth attempt. The more times resistance is tested the weaker it becomes - that is a golden rule. And therefore now chances for breakout are at their maximum. Nearest target levels are 2743 / 2762 / 2790 - after that open targets within ATH
Disclaimer
Any content and materials included in Sahmeto's website and official communication channels are a compilation of personal opinions and analyses and are not binding. They do not constitute any recommendation for buying, selling, entering or exiting the stock market and cryptocurrency market. Also, all news and analyses included in the website and channels are merely republished information from official and unofficial domestic and foreign sources, and it is obvious that users of the said content are responsible for following up and ensuring the authenticity and accuracy of the materials. Therefore, while disclaiming responsibility, it is declared that the responsibility for any decision-making, action, and potential profit and loss in the capital market and cryptocurrency market lies with the trader.