
Wick-Sniper
@t_Wick-Sniper

What symbols does the trader recommend buying?
Purchase History
پیام های تریدر
Filter
Wick-Sniper
طلا آماده انفجار است؟ راز حرکت بزرگ بعدی در بازار XAUUSD فاش شد!
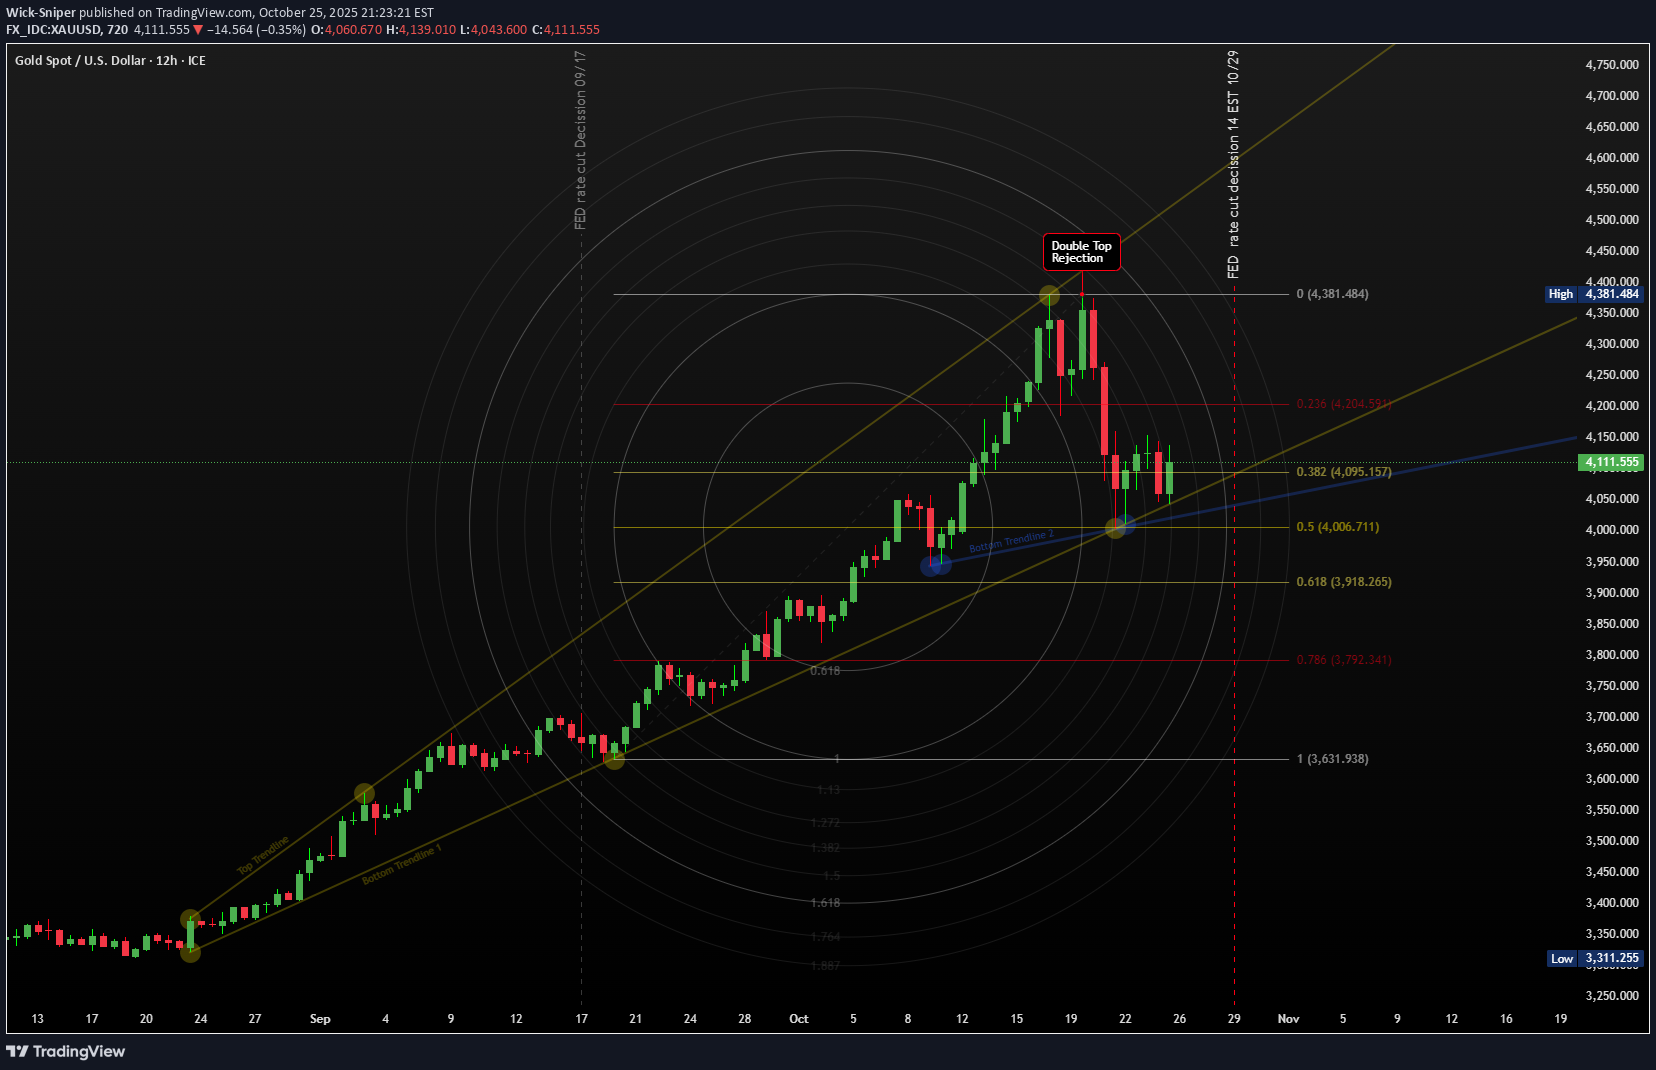
Hold onto your hats, traders! It's been a very wild ride in the XAUUSD market, proving that what goes up (to a Double Top 🏔️🏔️) must come down (with a vengeance!). After a decisive rejection at the $4381 peak, Gold took a spectacular 8.64% dive last Tuesday, landing sharply at the $4002 low 📉. Talk about a waterfall! 🌊 But don't count the bulls out yet! Gold showed some backbone, bouncing 3.97% back up to $4161 before settling into a cage match. It's now consolidating in a classic Triangle pattern (a.k.a. Compression) 📐, ranging from the $4002 floor up to the stronger resistance near $4135. The Great Consolidation: Triangle Tension 😮💨 The key takeaway? That $4000 psychological support is a BEAST. 💪 It survived test after test during the Asia, EU, and US sessions last Tuesday and Wednesday! This resilience allowed Gold to build support: first at the $4065 level (the Fib 0.382) and then down to the $4043 low, followed by rock-solid support near the $4000 zone. As Friday closed out the week, Gold was still testing the lower $4100 area, pulling back to $4096. So, what’s next for the shiny metal? That $33 candle Friday, was a direct reaction to the release of the slightly softer-than-expected US September Consumer Price Index (CPI) inflation data. My Outlook: Patience is Gold, But the FED is Key 🔑 While some market watchers are singing a bearish tune 🐻, I see this as a healthy consolidation phase. Gold has already corrected 50% from its massive move (from $3631 low to the $4381 high). While a deeper correction to the 0.618 Fib at $3918 is possible, I don't see the catalyst right now to push it that far. My bet? Gold will continue to consolidate in $4050 - $4150 range until the major announcement from the FED 🏦. The sharp reversal from the Double Top might just be the clean-out needed to launch prices higher once the rate cut announcement (or even just the dovish talk of future cuts) takes place! The last inflation data was a mixed bag, which gives the FED room to sound reassuringly dovish. The FED Announcement is the main event this week. Mark your calendars! 🗓️ 🔥 Key Economic Events: Central Bank Super Week! 🔥 This week is absolutely jammed with market-moving events across the globe. Get ready for volatility! 🌪️ Monday, October 27, 2025 8:30 AM ET: USD 🇺🇸 Durable Goods Orders (MoM) (Sep) 10:00 AM ET: USD 🇺🇸 New Home Sales (Sep) Tuesday, October 28, 2025 10:00 AM ET: USD CB Consumer Confidence (Oct) Wednesday, October 29, 2025 (The Fed Day) 🏦 All Day: HKD Holiday - Chung Yeung Day 9:45 AM ET: CAD BoC Interest Rate Decision 10:30 AM ET: USD Crude Oil Inventories 2:00 PM ET: USD Fed Interest Rate Decision 2:30 PM ET: USD FOMC Press Conference 10:00 PM ET (Approx.): JPY BoJ Interest Rate Decision Thursday, October 30, 2025 (ECB and GDP Day) 2:00 AM ET: EUR German GDP (QoQ) (Q3) 4:00 AM ET: EUR German CPI (MoM) (Oct) 8:15 AM ET: EUR Deposit Facility Rate (Oct) 8:15 AM ET: EUR ECB Interest Rate Decision (Oct) 8:30 AM ET: USD GDP (QoQ) (Q3) 8:45 AM ET: EUR ECB Press Conference 9:30 PM ET: CNY Manufacturing PMI (Oct) Friday, October 31, 2025 (Inflation and Month End) 6:00 AM ET: EUR CPI (YoY) (Oct) 8:30 AM ET: USD Core PCE Price Index (MoM) (Sep) 8:30 AM ET: USD Core PCE Price Index (YoY) (Sep) 9:45 AM ET: USD Chicago PMI (Oct) ------------------------------------------------------------------------- This is just my personal market idea and not financial advice! 📢 Trading gold and other financial instruments carries risks – only invest what you can afford to lose. Always do your own analysis, use solid risk management, and trade responsibly. Good luck and safe trading! 🚀📊
Wick-Sniper
Gold Week Sep 22 - Sep 26 - Fibonacci Circles Breakout?
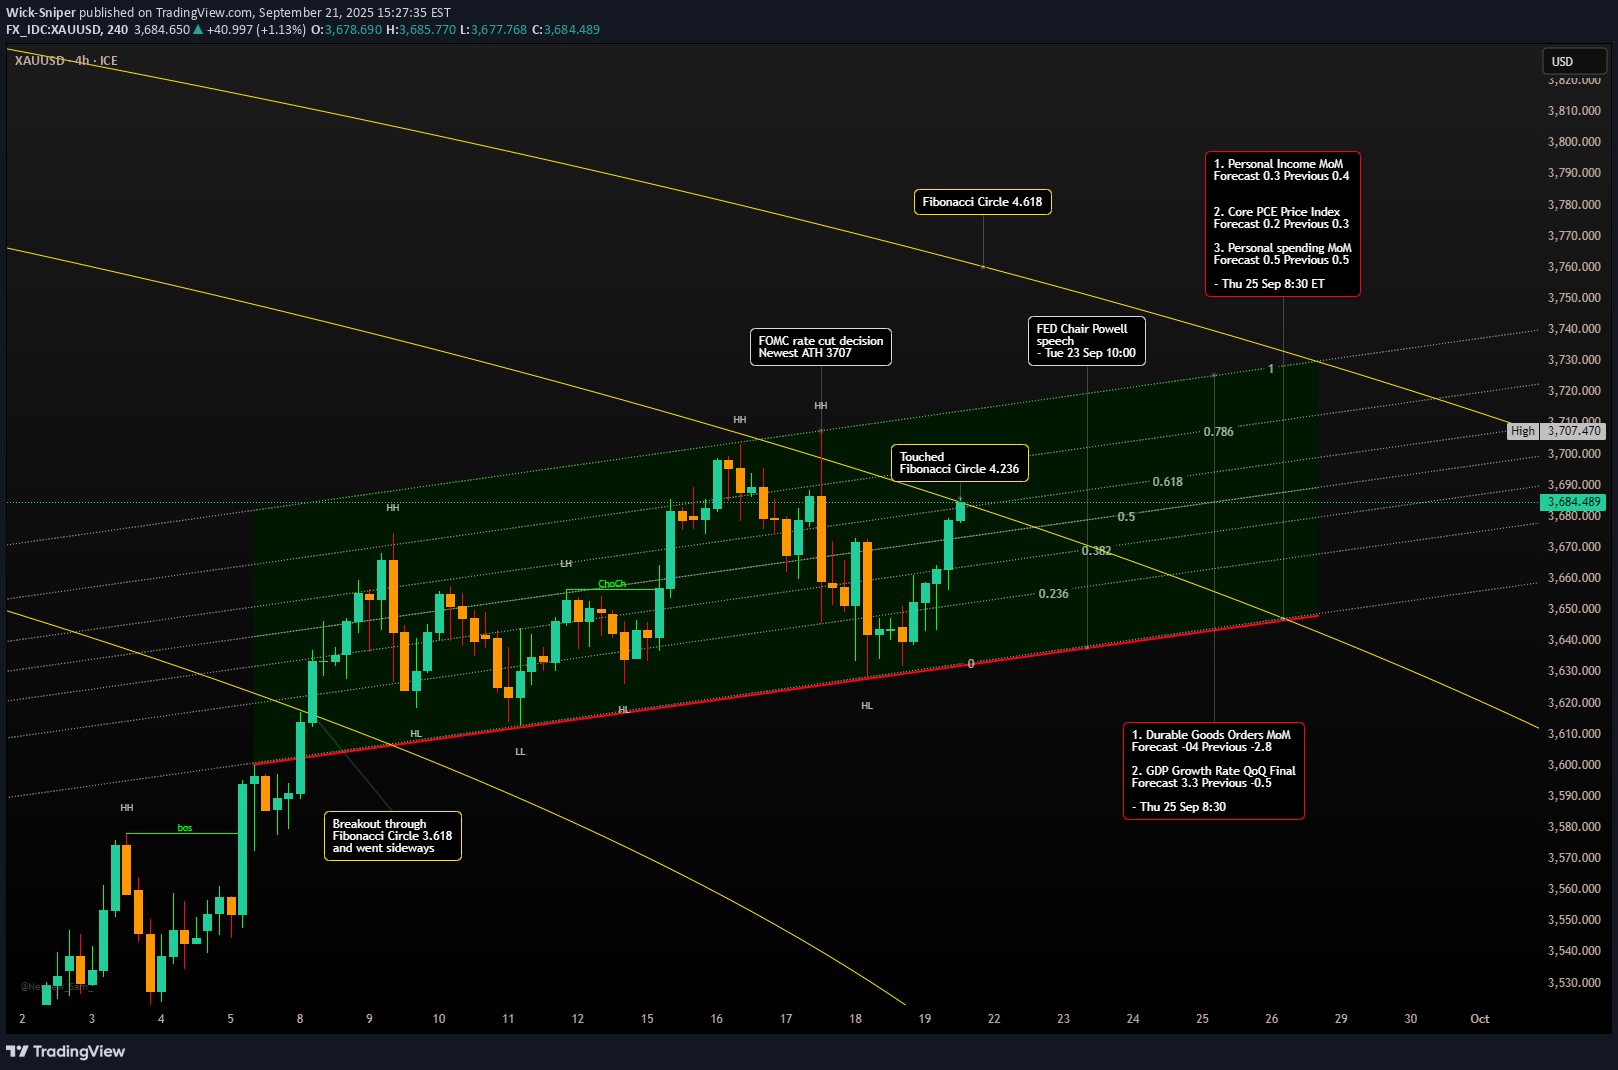
🎢 Last Friday was a rollercoaster, and not the fun kind for me. 😅 My trading plan went completely haywire, and I'm pretty sure everyone reading was like, "What is this noob doing? 😂" But hey, we learn from our mistakes, right? So let's break down what happened. XAUUSD Crazy Friday 💥 I usually trade during the European session, and everything was going smoothly. Gold was behaving just as I expected, dropping to $3643. Then, chaos! 😱 First, it shot up to $3659, and just when I thought it was done, it decided to fall back down to $3643. But wait, there's more! At the start of the US session 🇺🇸, it went on a bullish rampage, soaring to $3685, the high of the day. 🚀 I was totally caught off guard! My bias was short because of the recent highs after the FOMC and rate cut news. That was a big lesson learned. 😩 What's Up Next? A Big Week Ahead! 🔮 Get ready, because this week is going to be HUGE! 🎉 My analysis shows that Gold is in a **super important spot** right now. It's in the perfect position to try and make a big move higher! 📈 You might not believe me, but my Fibonacci circle analysis is screaming "breakout!" 📢 If you draw a Fibonacci circle on the daily chart from **$3500.200 (April 21, 2025)** to **$3246.550 (June 29, 2025)**, you'll see a pattern of breakouts. And guess what? We're on one of those circles right now! It's no joke, you should totally try it yourself. 🤯 As long as Gold holds this level, it's primed for a surge. 🌊 I even drew an image showing that Gold is sitting right on the 4.236 Fibonacci circle level from Friday's close. This is serious stuff! 🧐 I'm expecting a sideways "ping pong" 🏓 kind of week until Thursday, bouncing around the 0.382 and 1 Fibonacci levels. The ascending parallel channel gives us a clue on where it might go in the short term. Heads Up: This Week's Economic Events 📅 Keep an eye on these key events, as they can really shake things up! 🔔 Thursday, September 25th, 8:30 AM EST - Durable Goods Orders MoM: Forecast -0.4% (Previous -2.8%) - GDP Growth Rate QoQ Final: Forecast 3.3% (Previous -0.5%) Friday, September 26th, 8:30 AM EST - Personal Income MoM - Forecast 0.3 Previous 0.4 - Core PCE Price Index - Forecast 0.2 Previous 0.3 - Personal spending MoM - Forecast 0.5 Previous 0.5 My Two Cents: A Word of Caution 🙏 Things can change in the blink of an eye, so be careful! I don't know what the next Asian and EU session will bring, but I have a feeling the US session is gearing up to buy Gold again. 💰 Remember, different trading sessions (Asia 🌏, Europe, and the US) have different biases. Don't make the same mistake I did last Friday! 😔 Stay sharp and happy trading! 🚀 ------------------------------------------------------------------------- This is just my personal market idea and not financial advice! 📢 Trading gold and other financial instruments carries risks – only invest what you can afford to lose. Always do your own analysis, use solid risk management, and trade responsibly. Good luck and safe trading! 🚀📊What a Monday! 🤩 Gold is on fire! 🔥 It's been a wild ride for gold, breaking out above the **Fibonacci Circle** at $3685 and making a beeline for the next one at $3745. 🚀 Will the Asia session push it past $3755? 🤔 If it does, the next US session could be epic, sending gold soaring to $3800! 📈 Let's hope the momentum holds! ✨On Tuesday, it was like a rocket was strapped to its back during the late Asia session, shooting it up from around $3,736 to a high of $3,791 in the US session! 📈 After that epic climb, gold took a little breather, dipping down to $3,751 during FED Chair Powell speech as some traders likely cashed in their profits. 💰 It almost made it all the way back above the 0.236 fibonacci level (left side) before finishing the day strong at $3,762. 😅 So, what's next? 🤔 The upcoming Asia session might give it another little boost to $3,769 ? before the European crew gets in on the action and potentially takes some profits too? 📉 I wouldn't be surprised to see gold pulling back to $3,734 (0.382 left side) before the main engine fires up again and the right sided fibonacci takes place! 🔥 The ultimate goal? To break past $3,791 and set its sights on that big $3,800+ target! 🎯 Let's see if it can make it! 🤞Gosh, what a waterfall in the gold market today! First, a Head & Shoulders pattern appeared, and gold took a nosedive! 📉 During the U.S. session opening, it was a total waterfall from $3779 all the way down to $3717 —that's a crazy **$62 drop**! 🤯 The price plunged **88%** from the neckline, reaching a whopping -$40. At first, I was a bit skeptical about the pattern, but the more it fell, the more I believed it! 😅 But wait, there's more! 🤩 After that huge flush, gold shot straight back up to $3735, gaining **$18**! 🚀 Now, if the Asian and European sessions behave, we might just see it hit **$3780** during the next U.S. session as long the economic data announcment allow. 🤞 Fingers crossed for another exciting day! 🤞✨💥 Thursday: Data Drops, Prices POP! 🚀 tradingview.com What a day for the markets! We got a dose of strong US economic data today, and boy, did it shake things up! 🤯 Check out these numbers: 1. Durable Goods Orders (Month-over-Month): Actual: 2.9% 📈 Forecast: -0.5% 😵💫 2. GDP Growth Rate (Quarter-over-Quarter, Final): Actual: 3.8% 💰 Forecast: 3.3% ✨ With the US economy showing that much muscle, Gold 👑 of course took a nosedive right after the announcements! 📉 It was primed and ready, dropping a stunning - $ 34 🤕 But that's a decent pullback. But hold! ✋ Gold is in bullish mood, and it wasn't having it! It roared back, reclaiming a massive + $ 37 and ending the session strong at $ 3750 ($ 5 higher than yesterday's close! 💪 What a comeback! 🤩). 🔮 Friday Forecast: Buckle Up! 🎢 Get ready for an absolutely wild Friday! The stage is set for a massive move: Scenario 1: The Great Sell-Off! 📉 If the market sentiment flips dramatically, we could see a full-blown sell-off, pushing Gold below $ 3700. I'm talking about a potential $ 100 flush! 🌊 Get your raincoats! Scenario 2: The Rocket Launch! 🚀 Or, the expected surge comes through, smashing the ceiling and breaking above $ 3800 ! See you on the moon! 🌕 🚨 Trader Alert: Stay Sharp! ⚔️ Traders are going to be lightning-fast, hitting those buy and sell buttons instantly! If you want to be on the winning side, you need to be prepared and have your plan locked and loaded. 🎯 Personally, I love to stay on top of this stuff with Financial Juice 🍹 at: financialjuice.com/home on point with the data, and I especially dig their voice news 🗣️ while waiting for those big economic announcements. (Just a friendly tip, not an ad! 😉) Be careful with your capital! Which way do you think Gold is heading tomorrow? 🤔That's a wild ride! 🎢 Let's turn that market analysis into a fun read! 🥳✨ --- ## 🤯 **Gold's Golden Shenanigans!** 💰 Talk about **Gold** 🥇 doing its own thing! 🤪 If you thought today's economic data from the US 🇺🇸 would send the price tumbling... well, you thought wrong! 🤣 It did the **exact opposite**! ⬆️📈 Gold hit a **high of the day** ☀️ at **$ 3,783.85**! But before the market zipped into weekend mode 🏖️, there was some serious selling pressure near the peak. 📉 The price then pulled back to **$ 3,758**, still closing **$ 10 higher** than the previous day! 👏 Hilarious, right?! 😂 --- ## 🧐 **Where to Next for the Shiny Stuff?** 🔮 Okay, so the **Gold market is bullish** right now, that's clear! 🐂 But after all the recent economic reports 📊, where does the price *really* want to go? 🤔 As we all know, Gold often moves on the **latest news** 📰, and right now, it feels like it's holding its breath 😮 waiting for some juicy **bad news** to drop! ⬇️ Maybe it's moving for reasons we can't even see 👀, driven by big **institutional needs** 🏦—and let's be real, those moves can sometimes feel a little... *manipulated*. 😈 When I think about manipulation, I think about today's **unexpected price action**! 🤷♀️ It's a well-known secret that the **US Dollar** 💵 is often managed to keep it relatively low, which makes **Gold** a super appealing asset to buy! 🎁 If the Dollar were to climb back up above the **100 mark** 💯, Gold might not feel that same pressure or excitement it's feeling today! 😴 --- ## **My Week: From Hero to Zero (Almost!)** 🦸♂️📉 Phew! The week ended with a **big profit** for me 🎉 thanks to that massive surge on **Monday**! 🚀 The rest of the week, though? Let's just say it was... complete garbage. 🗑️💩 But hey, a profit is a profit! 🙏🤑 --- **What's your prediction for Gold next week? Another rollercoaster?** 🎢❓
Wick-Sniper
Gold - Everything is Possible, as Always
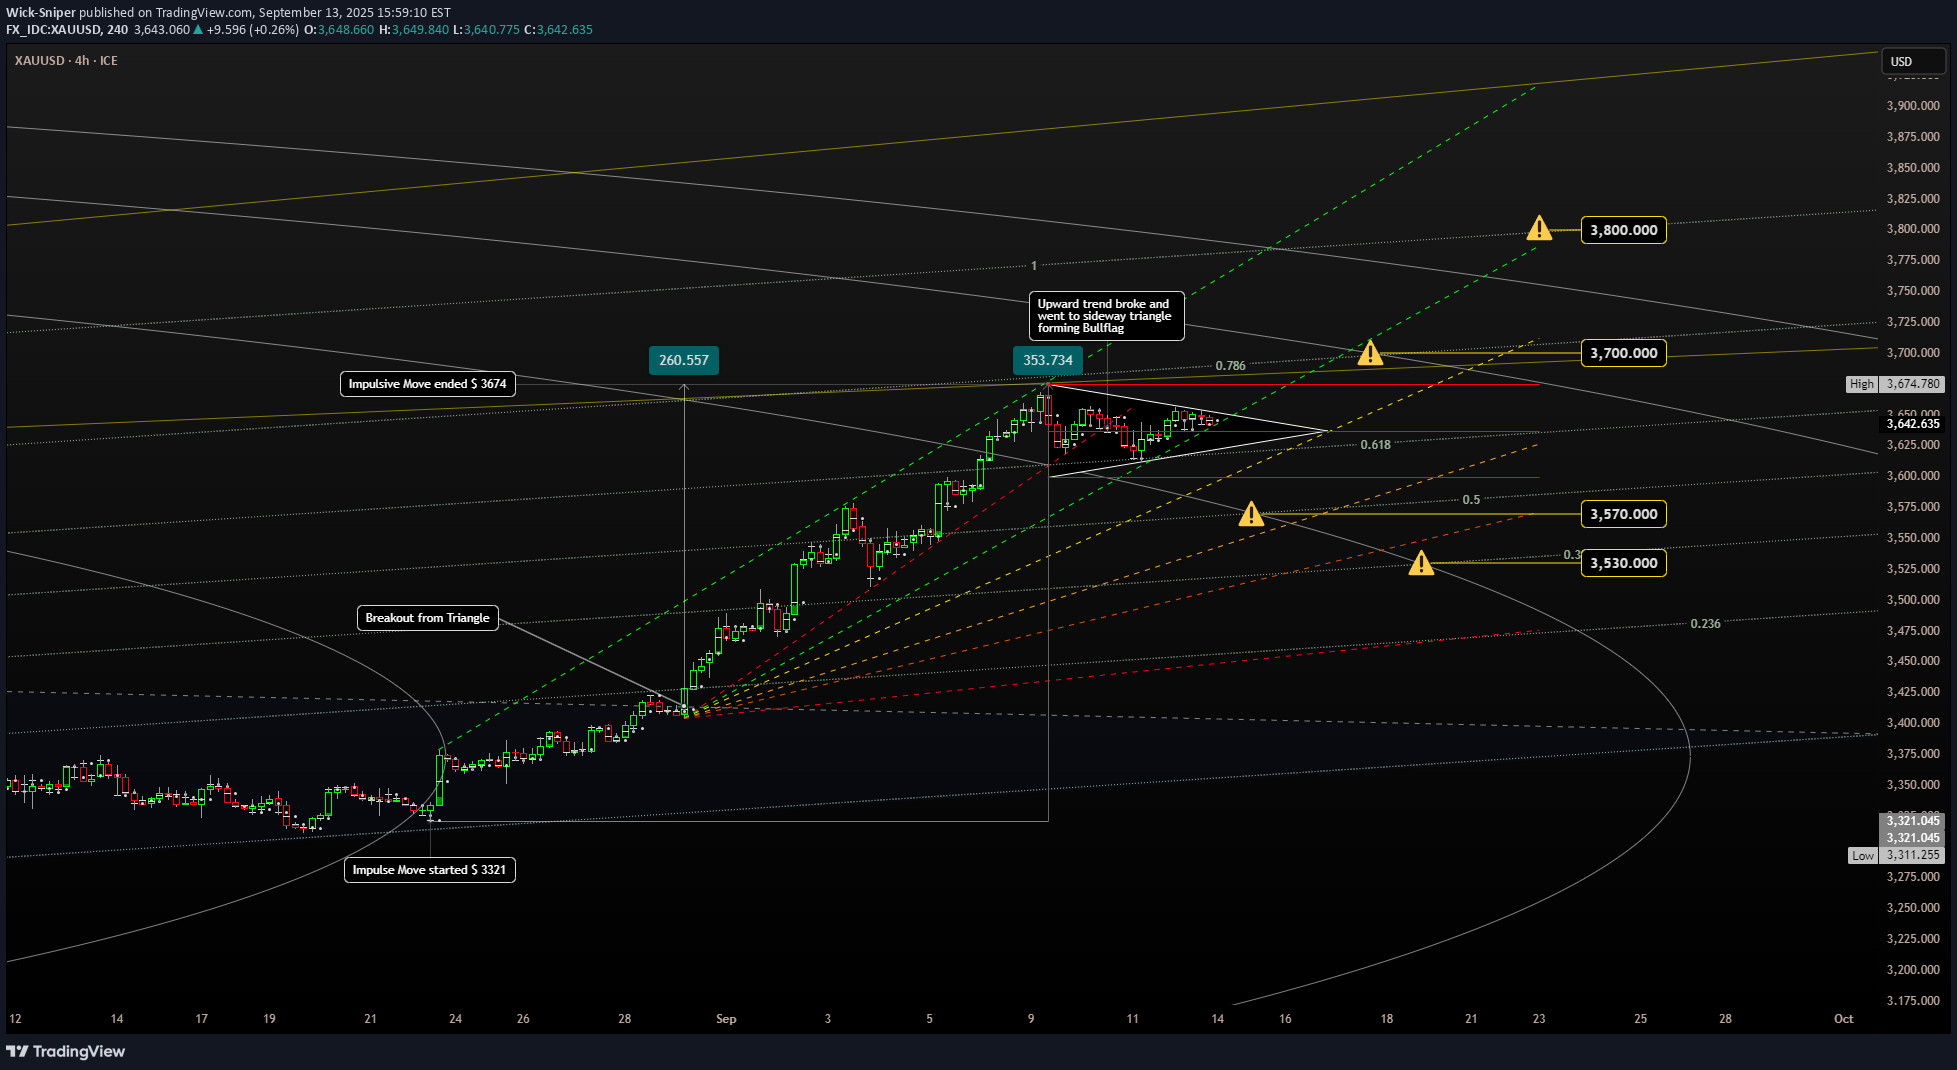
🚀 XAUUSD Gold's Wild Ride: What's Brewing After the $3674 High? 🤯 Hey Goldbugs! 🤩 Our shiny friend, XAUUSD, has been on an absolute tear lately. Market makers did their magic, nudging Gold to a comfy spot around $3640, just shy of its ALL-TIME HIGH of $3674! 🚀 But now... crickets. What's next for our "always up" precious metal? Let's decode this mystery in a flash! 👇 The Lowdown: Why Gold's Taking a Breather 😴 1. The "Less Bad" News Effect: Recent U.S. data has been... well, "less bad". Inflation/deflation drama is cooling off, and markets are starting to think things aren't as grim as they were. This makes some traders less keen on Gold, but don't forget the big players (institutions!) still need their fix. So, a tug-of-war begins! ⚔️ 2. Overheated Engine Syndrome! 🌡️ Gold's run from $3321 to $3674 was a whopping +10.5% ($353!) at an almost 45-degree angle! That's impressive, but even the best engines need to cool down. Our daily RSI values have been chilling above 75% – that's "overheated" territory! 🔥 A correction is basically Gold taking a well-deserved nap. The "C" Word: What Correction Looks Like 📉 Forget complicated math! A correction is usually a 10-20% price dip. Given Gold's recent sprint, we could be looking at a 20-30% pullback from that $353 gain, meaning a possible $70-$105 drop. 📉 Target Zones? Many eyes are on $3580. But hey, Gold likes surprises! It could go lower, perhaps even test $3550 or more! Your Trader's Toolkit: Don't Get Caught Napping! 🛠️ Want to predict Gold's next move? Here's your cheat sheet: Candlestick Clues: Watch for Shooting Stars 🌠, Hanging Men 🕯️, Spinning Tops, and Dojis. These are like little whispers telling you the trend might be tired. EMA Lines: These are your trend compasses! Fibonacci, Baby! 💫 Seriously, if you haven't, dive into Fibonacci Channels and Circles. They're like a crystal ball for price moves! Economic Calendar: 🗓️ CPI, PPI, NFP, and U.S. Inflation Data are Gold's daily bread and butter. Know them! 🧠 ICT Insights: What the Pros Are Seeing 📊 Market Structure Shift (MSS): After hitting $3674, Gold's current wiggles (Lower Highs & Lower Lows) within this consolidation hint at a short-term shift in order flow. It's not a full reversal, but a pause for thought. If you look closely, you can see a Bull Flag Pole exists and the Flag is forming, currently a triangle, a good sign before the liquidity needs to get taken out from the bottom. Liquidity Magnets: Buy-Side Liquidity (BSL): Loads of orders (and stop losses!) waiting above $3674. That's a juicy target if Gold decides to moon again! Sell-Side Liquidity (SSL): Plenty below the recent low around $3590-$3600. A dip here could be a "stop hunt" before bouncing. Fair Value Gaps (FVG) & Order Blocks (OB): Those rapid green candles left "gaps" and "blocks" during the ascent. Gold loves to retrace and "fill" these gaps or retest these blocks ($3590-$3600 is a key OB zone!) before its next big move. The Verdict? Gold's Not Done Yet! ✨ Is Gold heading for $3700+? YES! But probably not right now. A little cooldown, a bit of retracement to those key support levels and ICT zones, seems inevitable. So, what to do? Be patient, be responsible with your capital, and keep your eyes peeled for those technical clues. Gold's next big move could be around the corner! Next Week's Radar (ignoring the news for a sec): Bullish Target: $3800 🚀 Bearish Target: $3550 🐻 Significant large orders are on Sell Stop: 3611 Sell Limit_ 3657, 3659 Buy Limit: 3600, 3580, 3500 Buy Stop: 4497 ------------------------------------------------------------------------- This is just my personal market idea and not financial advice! 📢 Trading gold and other financial instruments carries risks – only invest what you can afford to lose. Always do your own analysis, use solid risk management, and trade responsibly. Good luck and safe trading! 🚀📊Today went very good for Bulls, but the machine is overheated more than last Friday, I have no worries, this will cool down soon.RSI @ 16 EST 2025/09/15 1d - 79 4h - 68 1h - 71 New ATH made $ 3685, what next, maybe $ 3655 would be a good spot?Over night Asia TZ made a new ATH at $3689, in the early EU Session the next push came up with $ 3694 indicating the unbroken bullish pressure on Gold. Price Action is compressed to a tight range and could lead to a breakout shortly. Be aware about the possibillity of a pullback and set your SL very short.Over the day Gold made another ATH at $ 3703 tumbled down to $ 3678 after announcement of US Retail Sales who were better than expected and was compressed in the range of $ 3686 to $ 3691 for the rest of the session. Now we look for the day before the fed announcement and see gold is stuck for the moment. No big pullback till now before FED is lowering the rates, all buy gold, will it sustain?I expected gold to make a corrective move, and it was not as low as I thought it would be, but it was close. 📉 So, I closed my short position on the down move today at **$3662**. 💰 Profits taken! 🤑 I also opened a small long position that delivered as well. 📈 Now I'm waiting for the FOMC announcement in about 30 minutes. 🕰️ Do not gamble! The expectations are huge and very different. 🤯 Some people are talking about **$3750** today, while others are saying **$3500** in the next few days. 📉 My honest expectation is that a rate cut is about 90% priced in, so I'm staying out of this. 🙅♂️ I'll see what the initial market reactions are tomorrow. 👀
Wick-Sniper
The day after a new higher high
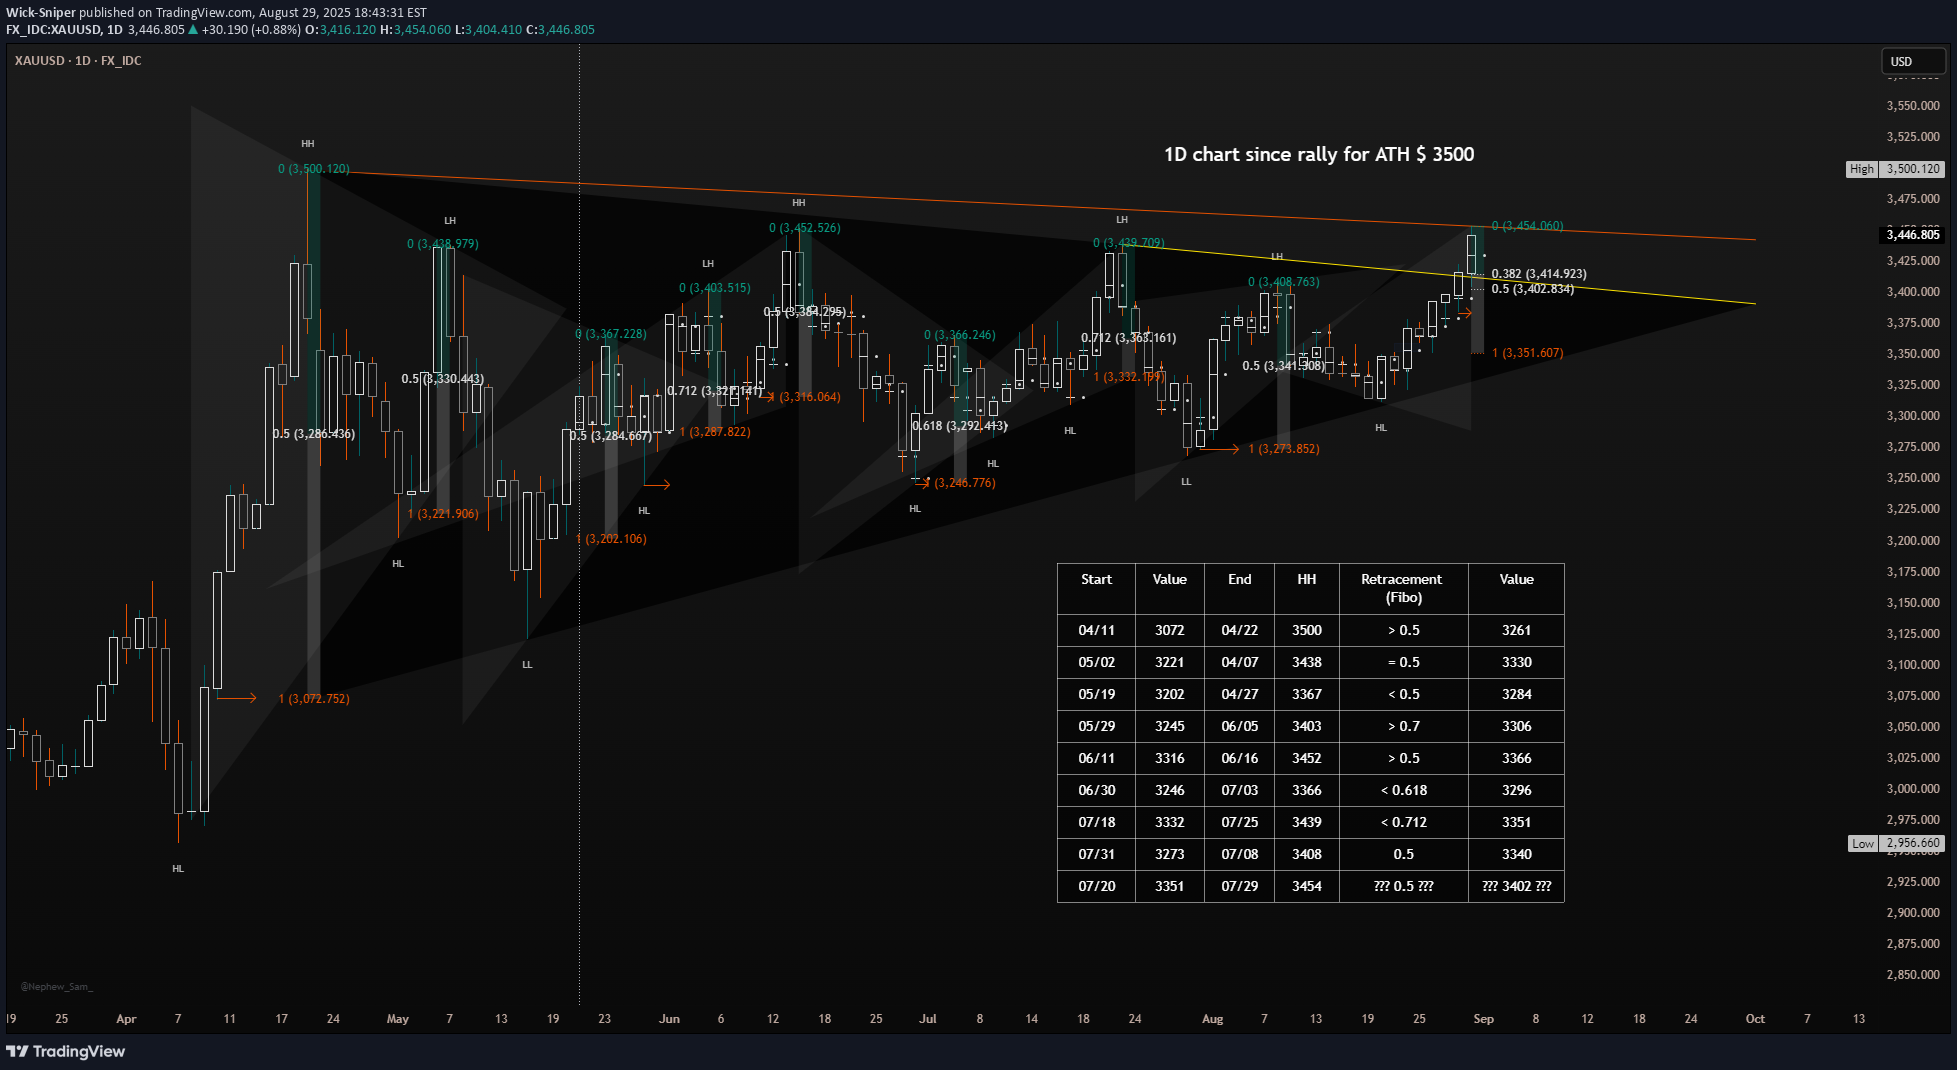
Hello fellow traders! 👋 It seems like so many times again, the market went in a different direction than you may have expected. 🤷♀️ After multiple positive words from members of the Fed, a rate cut is likely to happen and is getting priced in. 📉 On Friday, July 29, we got some good economic data from the U.S., but the market acted differently. 🤔 Why is this? The data wasn't worse than expected; it was as expected. The market is taking this as a sign—a sign for higher prices. But, and this is a fact, many retail traders aren't. 😥 It's not about confusion; it's about the market (and us as traders) not having priced in all the possibilities. 🤯 The truth is, they are lying to you. They (the government) are telling people and the news that things are about to get fixed and will be good, but they aren't. 🤥 If you think the data we got on Friday is true, think again. Look at the data; you'll see the forecast was as expected, but in reality, the numbers are better than before. Do you get it? The obvious conclusion isn't always the real one. 💡 In my opinion, the U.S. economic data everyone is talking about is much better than many people think because the news is written to make it seem bad. 😒 You can think whatever you want, of course! Price went up, not down, and a rally was chased. Many stop-loss orders were hit and turned into a cascade of higher prices. 📈 Institutions are buying gold, yes, because the dollar is cheap (?), and a rate cut is coming with a very high probability. 💰 So they buy gold, which results in many people's (and that's a good thing) stop-loss orders being executed. 👏 (sorry) I've seen it in the past, and you can see it too if you look at my data table. Whenever a very high gold price was reached, a correction followed. 📉 I expect a correction on Monday or Tuesday, and this correction will lead to at least $3418, which is the 0.382 Fibonacci level. In my view, $3403 is the 0.5 level and more realistic. If you look at the table I put in the image, you can see that the day after a high price like we had today, the correction was always at the 0.5 Fibonacci level or more! 📊 Don't think it won't happen; they will trap you in any way they can, such as with fakeouts... 😈 Believe in the market and its structure because, until now, there has never been a day without a correction after a rally like this! 💪Because the image i shared in this idea had some wrong parts in it, i rebuild a new correct version of it. By the way, monday USA and Canada have Holiday!
Wick-Sniper
Looking for catalysts - Gold Outlook July 7 - July 11, 2025
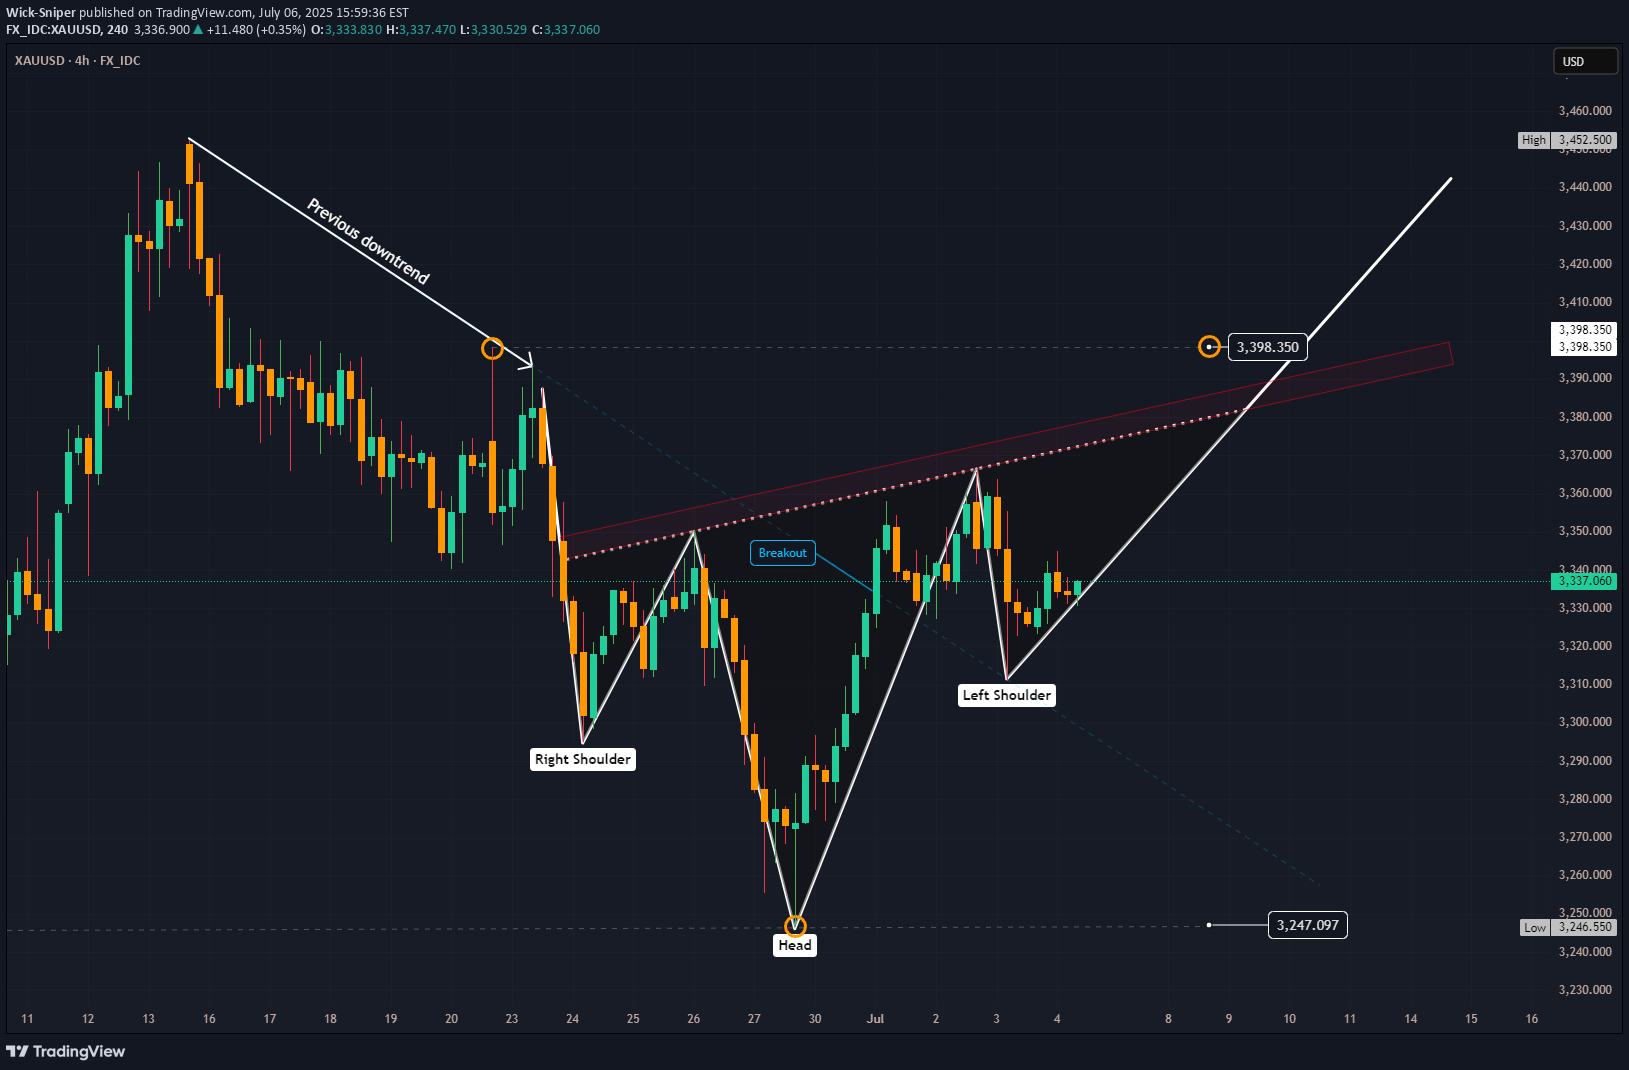
All about last week you can find here: XAUUSD Gold is currently seeking fresh catalysts this week. 🧐 While the economic calendar appears light for this time of year, a lack of economic data doesn't mean nothing is happening. Geopolitical events, especially tariff wars or other flashpoints, remain significant. Are there increasing signs for peace in the Middle East between Israel and Hamas? 🕊️ This week Gold could take advantage from an exisiting reversal head and shoulders pattern and painting pitchfork in the chart shows possibillities for Upside targeting $3400. ## Geopolitical News Landscape 🌍📰 Israel / Iran ⚔️🛑☢️ After fierce clashes in June, a **ceasefire** began June 24. 🇮🇷 Iran's Supreme Leader reappeared July 6, claiming victory 🎤. Tehran has now **banned IAEA inspectors** ❌🔍. Over 900 Iranians reportedly killed ⚰️. 🔮 Outlook: ⚠️ Nuclear tensions growing, diplomacy frozen 🧊. Regional powers remain on high alert 🚨. India / Pakistan 🗻🔫🕌 Tense calm in Kashmir 😐. India launched its sacred **Amarnath Yatra** 🕉️ under heavy security 🛡️. Pakistan killed 30 militants near the Afghan border ⚔️, while China 🐉 admitted sharing intel 📡. 🔮 Outlook: Diplomatic track stays open 🕊️, but **border flare-ups** and water disputes 💧 remain volatile 🔥. Gaza Conflict 💣🏘️🕊️ Israel launched deadly airstrikes ✈️, including one on a beach café ☕🏖️ killing 22. Dozens more died 💔. IDF admitted accidental strikes on aid sites 🚚❌. U.S.-led talks seek a **60-day truce** 🤝. 🔮 Outlook: Ceasefire possible 🛑, but **humanitarian crisis** worsening 🚨🩺. Trust remains fragile 💔. Russia / Ukraine ⚔️ Zelenskyy 🇺🇦 and Trump 📞 discussed new air defense aid 🎯. Russia answered with **massive drone strikes** on Kyiv 🚁🔥. NATO boosts arms shipments 🔫 and backs Ukraine’s domestic weapons production 🏭. 🔮 Outlook: War grinds on ⚙️. No peace in sight, with **global stakes** rising 📈. U.S. / China Trade War 💼📦🔥 With new tariffs looming 📆💣, Treasury said “multiple deals” are near 🤝. Trump claimed a **partial deal with China** 🐉, though tariffs remain high 📊. 🔮 Outlook: More piecemeal deals 🍰, but a **full-scale trade reset** looks unlikely before elections 🗳️. 🌍 Global Trade War 📉🚢💸 Trump’s shifting tariffs 🎯 hurt global growth 🌐. Markets hit record highs 📈 but investment chills ❄️. The 💵 dollar had its sharpest 6-month drop 📉 in decades. 🔮 Outlook: Businesses remain cautious ⚠️. **Supply chains** reroute 🔄. No global rebound without clarity 🔍. Trump vs. Powell 💥🏛️📉 Trump demanded Powell’s resignation ❌📉, accusing him of weak rate policy 📊. Powell held firm 🧊, citing inflation risks 📈. Trump eyes replacements 👀🪑. 🔮 Outlook: Fed independence 🏛️ under fire 🔥. **Rate policy** may get politicized ahead of 2025 elections 🗳️. 📈 U.S. Inflation 🛒💰🧾 Inflation slowed to 0.1% 🐢, but tariffs raised prices on appliances 🔌 (+4.3%) and toys 🧸. Fed projects 3% inflation by year-end 📊. 🔮 Outlook: As **tariffs bite** 🦷, inflation likely to climb 📈. Fed stays cautious 🧐 on cuts. Technical View 📐📈 Analysis Period: May 25 - June 6, 2025 | Forecast: June 7-11, 2025 1. ICT (Inner Circle Trader) Methodology Analysis 🧠 Market Structure Higher Timeframe Bias: The chart shows a clear bullish market structure with higher highs and higher lows from the major low around 3,250. 🐂 Current Structure: Price is in a consolidation phase after reaching highs near 3,370, showing potential distribution. ⚖️ Key ICT Concepts Identified: Fair Value Gap (FVG): Multiple gaps visible during the strong rally from 3,250 to 3,370. 💨 Order Blocks: Significant demand zone around 3,250-3,260 level (major accumulation area). 📦 Liquidity Zones: Buy-side liquidity above 3,370 (recent highs). 💸 Sell-side liquidity below 3,320 (recent consolidation lows). 📉 Market Maker Models: Classic accumulation-manipulation-distribution pattern visible. 🔄 Session Analysis: London Session: Shows strong directional moves. 🇬🇧 New York Session: Continuation of trends with increased volatility. 🗽 Asian Session: Consolidation and range-bound behavior. 🌏 2. Gann Analysis 🧙♂️ Gann Angles & Time Cycles: Primary Trend: 1x1 angle supporting the bullish move from 3,250. ↗️ Resistance Angles: 2x1 and 3x1 angles providing resistance around current levels. 🚧 Time Cycles: 7-day cycle showing completion around June 2-3. 🗓️ 14-day cycle suggesting potential reversal window June 7-9. ⏳ Gann Price Levels: Major Support: 3,250 (1/8 level). 🛡️ Current Resistance: 3,370 (7/8 level). 🛑 Next Target: 3,400 (full octave completion). 🎯 Geometric Relationships: Price squared relationship suggests 3,380-3,400 as natural resistance. 📐 Time-price balance indicates consolidation period before next major move. 🕰️⚖️ 3. Fibonacci Analysis ✨ Retracement Levels (from 3,250 low to 3,370 high): 23.6%: 3,341.6 38.2%: 3,324.2 50.0%: 3,310.0 61.8%: 3,295.8 78.6%: 3,265.6 Extension Levels: 127.2%: 3,402.6 161.8%: 3,444.2 200.0%: 3,490.0 Current Analysis: Price has respected the 23.6% retracement level multiple times. ✅ Strong support confluence at 38.2% level (3,324). 💪 Extension targets suggest potential move to 3,402-3,444 range. 🚀 4. Institutional Levels Analysis 🏦 Psychological Levels: 3,300: Major round number providing support. 💯 3,350: Mid-level resistance. 📊 3,400: Next major psychological target. 🎯 Institutional Order Flow: Accumulation Zone: 3,250-3,280 (heavy institutional buying). 💰 Distribution Zone: 3,350-3,370 (profit-taking area). 💸 Breakout Target: 3,400+ (next institutional objective). ⬆️ Volume Analysis: High volume on the initial move up from 3,250. 📈 Decreasing volume during consolidation (typical distribution pattern). 📉 Volume expansion needed for breakout confirmation. 💥 5. Cycle Timing Analysis ⏰ Short-Term Cycles: 3-day cycle: Currently in compression phase. 🤏 7-day cycle: Completed around June 2-3. ✅ 14-day cycle: Due for completion June 7-9. ⏳ Medium-Term Cycles: Monthly cycle: Bullish momentum phase. ⬆️ Quarterly cycle: In expansion phase. 🌟 Cycle Projection: Next major cycle turn expected June 7-9. 🔄 Potential for either breakout or correction during this window. 🤞 6. FORECAST: June 7-11, 2025 🔮 Primary Scenario (60% probability): Bullish Breakout 🚀 Target 1: 3,400-3,410 Target 2: 3,440-3,450 Catalyst: Break above 3,370 with volume. 💥 Timeline: June 7-9 initial move, June 10-11 extension. Secondary Scenario (35% probability): Corrective Pullback ⬇️ Target 1: 3,320-3,325 (38.2% Fibonacci) Target 2: 3,300-3,310 (psychological support) Catalyst: Failure to break 3,370 resistance. 🚫 Timeline: June 7-8 decline, June 9-11 consolidation. Low Probability Scenario (5% probability): Deep Correction 📉 Target: 3,280-3,290 (61.8% Fibonacci) Catalyst: Major risk-off sentiment. 😱 Timeline: Extended throughout the week. 7. Key Assumptions & Risk Factors 🤔 Bullish Assumptions: Continued institutional accumulation at current levels. 🏦 Breakout above 3,370 with confirming volume. ⬆️ Favorable macroeconomic backdrop for gold. 🌍 Weakness in USD supporting gold prices. 💵 Geopolitical tensions maintaining safe-haven demand. 🕊️ Bearish Risk Factors: Profit-taking at psychological 3,400 level. 🤝 Stronger USD due to economic data. 💹 Reduced safe-haven demand. 📉 Technical failure at key resistance levels. 🚧 Central bank policy shifts. 🏛️ 8. Trading Recommendations 💡 Entry Strategies: Bullish Setup: Buy on pullback to 3,340-3,345 with stop below 3,320. 🎯 Breakout Play: Buy break above 3,372 with stop below 3,350. 🚀 Conservative: Wait for retest of 3,324 support area. patiently 🧘 Risk Management: Position Size: Limit to 2-3% of portfolio per trade. 📏 Stop Loss: Always use stops below key support levels. ⛔ Take Profit: Scale out at Fibonacci extension levels. 💰 Key Levels to Watch: Immediate Resistance: 3,365-3,370 🛑 Support: 3,340-3,345 🛡️ Breakout Level: 3,372 🚀 Major Support: 3,320-3,325 💪 9. Conclusion ✅ The XAUUSD chart presents a constructive bullish setup with multiple confluences supporting higher prices. The completion of various cycles around June 7-9 suggests a potential catalyst for the next major move. While the primary bias remains bullish targeting 3,400+, traders should remain alert to the possibility of a corrective pullback to test lower support levels. 🧐 The institutional accumulation pattern, combined with favorable Gann angles and Fibonacci projections, supports the bullish thesis. However, proper risk management is essential given the potential for volatility around key psychological levels. ⚠️ Please take the time to let me know what you think about this. 💬 ------------------------------------------------------------------------- This is just my personal market idea and not financial advice! 📢 Trading gold and other financial instruments carries risks – only invest what you can afford to lose. Always do your own analysis, use solid risk management, and trade responsibly. Good luck and safe trading! 🚀📊Like many times before, gold is acting differently, but today it made some moves that could be good for the target of $3400 I have in mind. 🎯 During the Asian session, gold was distributed and sold down to a price of $3305. The European session then saw accumulation, testing down to $3296, as the US session redistributed back up to $3340. Price at the end of Friday's session was $3337, and today it closed at $3336. However, the important part here is the market structure that did not break through the bottom. It made a retest of the $3300 area with today's low at $3296. On June 24th, the right shoulder of this reverse head and shoulders pattern was at $3295, implying stability at this level. Also, the "Head" of the structure, at $3246, was a retest of the low from May 28th, which was at $3245. U.S. President Trump announced tariff changes against different countries today, and the stock market saw higher prices decline. This is good for gold! 📈 * Trump to Japan: From August 1st, the US will charge a 25% tariff on all Japanese products. 🇯🇵➡️🇺🇸 * Malaysia, South Africa, and others are also getting tariffs as Trump rolls out the trade letters. 🇲🇾🇿🇦 * Treasury Secretary Scott Bessent: "We are going to have several trade announcements in the next 48 hours." ⏳ Let's see what Tuesday offers. I still see the upside, even if the structure changed, but we have seen it in the past: these announcements are catalysts for higher gold prices! 🚀✨Tuesday saw the Asian session sell gold down to $3323 from a high of $3345 📉💰. The European session brought the price back up to $3330 📈✨ before the US session sold it down to $3286 💥📉. If the next Asian session sells gold down further and the trendline is broken downwards, I will lose hope for higher prices 📉🙏.Market Update 📈📉📊 On Wednesday, the Asia session started with a bang at a high of $3308 🚀, but quickly sold off to a low of $3284 💨. What a rollercoaster! 🎢 During the European session, prices dipped even further to a new low of $3282 🌊 before comeback, climbing to $3316 in the late US session 🆙. Go bulls! 🐂 Overall, volume is low 😴, likely due to that sleepy seasonal lull 🍂. The market ultimately closed at $3313 🎯 and could see more upside potential if the Asia session decides to pay up 💰 – they certainly weren't in a buying mood yesterday! 🤷♀️ Technical Analysis 📉🤔🤞 My initial thought about a reversal Head and Shoulders pattern? 🤯 Well, it's looking less and less valid now thanks to that whisper-quiet volume 🤫 and prices constantly knocking on lower doors 🚪⬇️. But hey, a trader can always dream, right? ✨ There's always hope for a comeback! 🙏💖Thursday was again kind of boring because gold was going sideways. 😴 The Asia Session bought gold up from $3312 to $3328, followed by the European Session selling from $3330 down to $3317. 📉 The combined European and US Session then sold gold from $3329 down again to $3309 before the price came back to $3326, and the market closed at $3323. 📊 That said, the range was between $3309 and $3330 ($21). Within this range, I was able to make some sweet wins 🤑, but overall, it's summer and it's quiet on the gold market. ☀️ For the upcoming Asia Session, I don't expect much, but here are some interesting possibilities: 🤔 1. If the Asia Session brings the price above $3330, it's possible we could see up to $3366 on Friday, but I'd say the chance is maybe 20%. 🚀 2. If the Asia Session sells gold down to below $3311, it's more likely that we could see further down to $3282 again, and I see the chance of that at about 30%. 📉 3. Just sideways in the current range, and I think this is about 50% likely. ↔️Market Reacts to Tariff Talks & Gold Trends 📉📈 Friday saw a strong **rally**! 🚀 Since President Trump announced new **tariff changes** 💸, the market had a clear reason to react. Looking at this TradingView Chart 📊, we can see the **Delta**, which clearly indicates that **Asia** 🌏 and **Europe** are actively buying **Gold** 💰. The U.S. session, however, wasn't willing to drive the price higher. I anticipate that after the announcement of the **30% tariff for Europe**, the upcoming EU session could push the price even **higher** again ⬆️, but I'm not expecting the U.S. session to follow suit. In the upcoming week, the U.S. market is likely waiting to react to key **inflation data** 📈 on **Tuesday** (CPI on July 15) and **PPI** on **Wednesday** (July 16). Keep your eyes peeled! 👀 It's going to be an interesting week! 🗓️
Wick-Sniper
Down the road - Gold Outlook June 30 - July 24, 2025
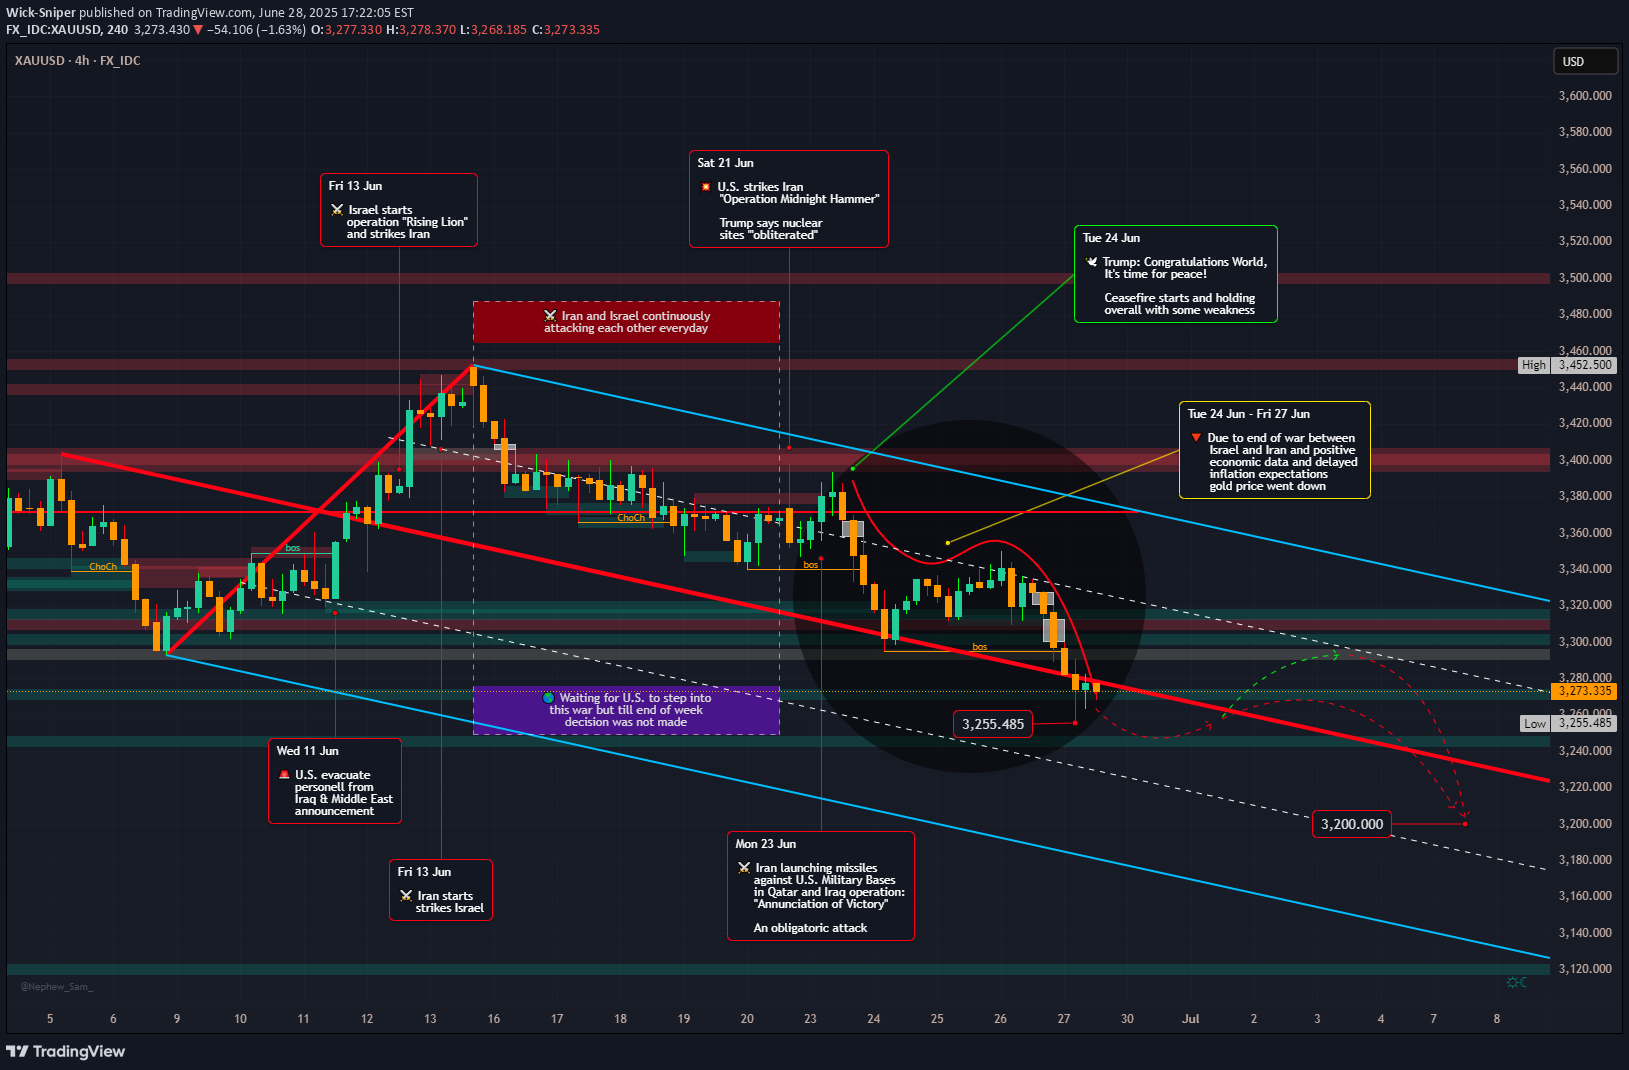
XAUUSD 📰 The past weeks has been a wild ride for gold prices, caught between the fiery conflict in the Middle East and a deluge of crucial economic data from the U.S. 📈 Adding to this, a detailed technical analysis provides a deeper look into gold's immediate future.**Geopolitical Drama Unfolds & Peace Prevails!** 🕊️ ceasefire negotiations.Initially, gold was shrouded in uncertainty 🌫️ due to the Iran-Israel war, with markets bracing for potential U.S. involvement and a full-blown escalation. Daily tit-for-tat attacks between Iran and Israel kept everyone on edge, and the question of U.S. intervention remained a nail-biter 😬, though President Trump did announce a 14-day "timeout".Then came the dramatic twist on June 21st: "Operation Midnighthammer" saw the U.S. unleash bunker-buster bombs on Iranian uranium enrichment facilities. 💥 Short time later, the U.S. declared mission accomplished, stating their goal of destroying these sites was achieved, and no further attacks would follow.Iran's response, "Operation Annunciation of Victory," on the following Monday, involved missile strikes on U.S. military bases in Qatar and Iraq. 🚀 Interestingly, these attacks were pre-announced, allowing for safe evacuations and thankfully, no casualties. 🙏The biggest surprise came from President Trump as he declared, "Congratulations world, it's time for peace!" 🎉 He then brokered a ceasefire between Israel and Iran, which, despite being fragile, largely held, leading to the war's end.🤝 Both nations, as expected, officially claimed victory – a common move to satisfy their citizens. 🏅Personally, I was genuinely surprised that the U.S.President mediated ceasefire, actually brought the conflict to a close – but it's a welcome outcome! 🙏**Economic Data & Fed's Steady Hand** 💹🏛️The cessation of hostilities triggered a steady downward slide in gold prices from June 24th to 27th. ⬇️ This dip initially met some market resistance but it ultimately prevailed, especially with the release of mixed U.S. economic data, which, despite being varied, was generally interpreted positively by the market.The spotlight also shone on the Federal Reserve, with several representatives speaking and Fed Chair Jerome Powell undergoing a two-day Senate hearing. 🎤👨⚖️ Powell meticulously explained the Fed's rationale for holding interest rates steady, despite market pressures. 🤷 However, recent whispers suggest the Federal Reserve might actually cut rates in September! 😮 ## Geopolitical News Landscape 🌍📰India / PakistanPakistan rejected claims that it supported militant groups active in Indian Kashmir. India issued a formal protest but reported no fresh border clashes during the week.Outlook 🔮: De-escalation is possible in the short term. However, unresolved disputes over water rights (Indus Treaty) could reignite tensions.Gaza ConflictHeavy Israeli airstrikes killed dozens in Gaza, including civilians near aid centers. The UN warned that U.S.-backed aid systems are failing. Humanitarian corridors remain blocked.Outlook 🔮: Ceasefire talks may resume in July, but success depends on international pressure and safe humanitarian access.Russia / UkraineRussia advanced 36 sq mi in eastern Ukraine, deploying outdated T-62 tanks. Ukraine reinforced defensive lines, aided by Western military packages.Outlook 🔮: The front remains volatile. Sustained Western support will be key to halting further Russian gains.U.S. – China Trade WarA breakthrough deal was signed for China to fast-track rare-earth exports to the U.S. Talks on tech transfer and tariffs continue behind closed doors.Outlook 🔮: A phased de-escalation is possible, but deep trust issues linger, especially over semiconductors and AI.🌐 Global Trade WarSeveral countries, including Brazil and Thailand, imposed fresh restrictions on Chinese imports, echoing the U.S. stance. Global supply chains remain fragmented.Outlook 🔮: Trade blocs like the EU and Mercosur may take on greater importance as countries hedge against rising protectionism.Trump vs. PowellFed Chair Powell resisted political pressure, stating rate cuts are unlikely before September. Trump called him “stubborn” and demanded immediate easing.Outlook 🔮: The Fed’s independence is under strain. If Trump wins re-election, major policy shifts could follow.📈 U.S. InflationDespite tariffs, core inflation remains elevated. Powell warned of persistent price pressures. Trump insists the Fed should cut rates to boost growth.Outlook 🔮: A rate cut later in 2025 is possible—if labor market data weakens. Until then, inflation will remain politically explosive.## Technical View 📐📈**Current Market Context:** Gold plummeted to $3,273.67 USD/t.oz on June 27, 2025, marking a 1.65% drop from the previous day, which confirms the strong bearish momentum. The price action shows a significant retreat from recent highs around $3,400.**ICT (Inner Circle Trader) Methodology Analysis:*** **Market Structure:**The trend is clearly bearish, with a definitive break of structure (BOS) to the downside.* **Order Blocks:**Several bearish order blocks have been identified at prior resistance levels, specifically in the $3,380-$3,400 range.* **Fair Value Gaps (FVG):**The aggressive sell-off has created multiple imbalances, particularly in the $3,350-$3,320 range.* **Liquidity Pools:**Buy-side liquidity above $3,400 has been swept. Sell-side liquidity is now accumulating below the $3,270 lows, which is the current target zone.* **Session Analysis:**The London session showed aggressive selling, followed by a continuation of bearish momentum in the New York session. The Asia session could see consolidation or further declines.* **Smart Money Concepts:**Heavy selling pressure suggests "smart money" distribution. There's been strong bearish displacement from $3,380 down to $3,270, indicating the market is currently in a "sell program" phase.**Gann Analysis:*** **Gann Angles & Time Cycles:**The primary 1x1 Gann angle has been broken, pointing to continued weakness. Key price squares indicate resistance at $3,375 (25²) and support at $3,249 (57²). Daily cycles suggest a potential turning point around June 30-July 1, while weekly cycles indicate continued pressure through early July.* **Gann Levels:** * Resistance: $3,375, $3,400, $3,481 (59²) * Support: $3,249, $3,136, $3,025**Fibonacci Analysis:*** **Key Retracement Levels (from recent swing high to low):** * 78.6%: $3,378 (Strong resistance) * 61.8%: $3,348 (Key resistance zone) * 50.0%: $3,325 (Psychological level) * 38.2%: $3,302 (Minor resistance) * 23.6%: $3,285 (Current area of interest)* **Fibonacci Extensions (Downside Targets):** * 127.2%: $3,245 * 161.8%: $3,195 * 261.8%: $3,095* **Time-Based Fibonacci:** The next significant time cluster is July 2-3, 2025, with a major cycle completion expected around July 15-17, 2025.**Institutional Levels & Volume Analysis:*** **Key Institutional Levels:** * Major Resistance: $3,400 (psychological + institutional) * Secondary Resistance: $3,350-$3,375 (order block cluster) * Primary Support: $3,250-$3,270 (institutional accumulation zone) * Major Support: $3,200 (monthly pivot area)* **Volume Profile Analysis:** * High Volume Node (HVN): $3,320-$3,340 (fair value area) * Low Volume Node (LVN): $3,280-$3,300 (potential acceleration zone) * Point of Control (POC): Currently around $3,330**Central Bank & Hedge Fund Levels:**Based on recent COT data and institutional positioning, heavy resistance is seen at $3,400-$3,430, where institutions likely distributed. An accumulation zone for "smart money" re-entry is anticipated at $3,200-$3,250.**Cycle Timing Analysis:*** **Short-Term Cycles (Intraday):**Bearish momentum is expected to continue for another 12-18 hours. A daily cycle low is likely between June 29-30, with a potential reversal zone on July 1-2 for the 3-day cycle.* **Medium-Term Cycles:**The current weekly cycle is in week 3 of a 4-week decline. The monthly cycle indicates a mid-cycle correction within a larger uptrend. For the quarterly cycle, Q3 2025 could see a major low formation.* **Seasonal Patterns:**July-August is typically a weaker period for gold ("Summer Doldrums"). September has historically been strong for precious metals ("September Effect"), setting up for a potential major move higher in Q4 2025 ("Year-End Rally").**Trading Strategy & Levels:*** **Bearish Scenario (Primary):** * Entry: Sell rallies into the $3,320-$3,350 resistance zone. * Targets: $3,250, $3,200, $3,150. * Stop Loss: Above $3,380.* **Bullish Scenario (Secondary):** * Entry: Buy support at $3,250-$3,270 with confirmation. * Targets: $3,320, $3,375, $3,400. * Stop Loss: Below $3,230.**Key Events to Watch:*** **US PCE Data:**Fresh downside risks could emerge ahead of the US Personal Consumption Expenditures (PCE) Price Index data release.* **Fed Communications:** Any hawkish rhetoric from the Federal Reserve could further pressure gold.* **Geopolitical Developments:**Ongoing global events could trigger safe-haven demand.**Conclusion:**The technical picture for gold suggests continued short-term weakness, with the metal testing its 2025 trend line at $3,290 following last week's rejection at the $3,430 resistance. However, the longer-term outlook remains constructive, given gold's robust performance year-to-date. Key support at $3,250-$3,270 will be crucial in determining the next significant price movement.**Upcoming Week's Economic Calendar (June 29 - July 4, 2025):** 🗓️🌍🗓️ Get ready for these important economic events (EDT)* **Sunday, June 29, 2025** * 21:30 CNY: Manufacturing PMI (Jun) - Forecast: 49.6, Previous: 49.5* **Monday, June 30, 2025** * 09:45 USD: Chicago PMI (Jun) - Forecast: 42.7, Previous: 40.5* **Tuesday, July 1, 2025** * 05:00 EUR: CPI (YoY) (Jun) - Forecast: 2.0%, Previous: 1.9% * 09:30 USD: Fed Chair Powell Speaks * 09:45 USD: S&P Global Manufacturing PMI (Jun) - Forecast: 52.0, Previous: 52.0 * 10:00 USD: ISM Manufacturing PMI (Jun) - Forecast: 48.8, Previous: 48.5 * 10:00 USD: ISM Manufacturing Prices (Jun) - Forecast: 70.2, Previous: 69.4 * 10:00 USD: JOLTS Job Openings (May) - Forecast: 7.450M, Previous: 7.391M * **Wednesday, July 2, 2025** * 08:15 USD: ADP Nonfarm Employment Change (Jun) - Forecast: 80K, Previous: 37K * 10:30 USD: Crude Oil Inventories - Forecast: -5.836M* **Thursday, July 3, 2025** * Holiday: United States - Independence Day (Early close at 13:00) 🇺🇸⏰ * 08:30 USD: Average Hourly Earnings (MoM) (Jun) - Forecast: 0.3%, Previous: 0.4% * 08:30 USD: Initial Jobless Claims - Forecast: 239K, Previous: 236K * 08:30 USD: Nonfarm Payrolls (Jun) - Forecast: 129K, Previous: 139K * 08:30 USD: Unemployment Rate (Jun) - Forecast: 4.2%, Previous: 4.2% * 09:45 USD: S&P Global Services PMI (Jun) - Forecast: 53.1, Previous: 53.1 * 10:00 USD: ISM Non-Manufacturing PMI (Jun) - Forecast: 50.3, Previous: 49.9 * 10:00 USD: ISM Non-Manufacturing Prices (Jun) - Forecast: 68.7* **Friday, July 4, 2025** * All Day: Holiday - United States - Independence Day 🎆**Gold Price Forecast for the Coming Week** 🔮💰Given last week's market movements, there's a strong likelihood that the downward trend in gold prices will continue.🔽 However, fresh news can always flip the script! 🔄 As of now, I expect gold to dip further to $3255 by mid-next week. Yet, a brief rebound towards $3300 isn't out of the question before a potential drop to $3200 by week's end or early the following week. 🤞Please take the time to let me know what you think about this. 💬-------------------------------------------------------------------------This is just my personal market idea and not financial advice! 📢 Trading gold and other financial instruments carries risks – only invest what you can afford to lose. Always do your own analysis, use solid risk management, and trade responsibly.Good luck and safe trading! 🚀📊**Gold is on the Move! 🚀**I were anticipating a retest of $3300 later this week, but right at the beginning of the Asia Session, gold made a significant move. It dropped from $3281 directly down to $3246 in a swift $35 candle on the 1H chart, with the Asia Session ultimately closing at $3296. 📉The early EU Session saw the price dip further to $3274. However, as the US Session became active, there was a solid surge, pushing the price up to $3309. 💪 Session ending with $3302 right on a support.If the upcoming Asia Session takes the invitation, there's a strong possibility the gold price could break through the resistance area. Should a clear breakout above $3313 occur, the path to $3350 looks highly likely! 📈Be prepared for Tuesday and the upcoming market catalysts! The rollercoaster is about to roll at 09:30 EDT when Fed Chair Powell speaks, followed by multiple economic data announcements that could bring surprises. 🎢📊Nice to see gold rising! After breaking $3324, it's certainly on its way to $3352! 🚀 With the Dollar still weakening after passing below 96 points, gold definitely has more room to grow. 💰But i can imagine that after $3352 we could see some correction, and after a 3.28% surge, it's very likely. 📈 Also, it's time for consolidation, isn't it? 🤔 There is some time till Powell speaks and data announcements, so maybe this is what will happen until then. 📉📊Tuesday's economic data mirrored a good economic habit, and of course, Fed Chair Powell didn't talk dovish about a rate cut, as expected. 👍* S&P Global Manufacturing PMI (Jun): Actual 52.9, Forecast 52.0 📈* ISM Manufacturing PMI (Jun): Actual 49.0, Forecast 48.8 ✅* ISM Manufacturing Prices (Jun): Actual 69.7, Forecast 69.6 ⬆️* JOLTS Job Openings (May): Actual 7.769M, Forecast 7.320M 🚀All these figures are better than expected! The US Dollar shows a reaction but is still in a multi-year deep area. 📉 For Gold, the actual rally seems over, and a correction should follow. Many FVG (Fair Value Gap) areas are visible on the 4H Chart.I see the correction down at least to $3324. 📉For tomorrow, Wednesday, July 2nd, the ADP Nonfarm Employment Change will be announced at 08:15 EDT.This is an important economic indicator as it provides an early look at private sector employment trends in the US, often serving as a precursor to the government's official Nonfarm Payrolls (NFP) report released a couple of days later. Traders and economists will be watching this closely for insights into the health of the US labor market, which can influence expectations for inflation and the Federal Reserve's monetary policy decisions. 🇺🇸💼On Wednesday, before the U.S. session began, Gold went up 📈 with the support of a -33k ADP Nonfarm Employment Change, surging from $3336 to $3350. The European session earlier started with a drop to $3327 and then ranged up to $3347.As the U.S. session began, the Gold price had a solid way upwards during the rest of the day, after first falling back to $3333, slowly but steadily climbing up to $3365 (+$32) 🚀.The early Asia session is actually beginning with a correction 📉.For Thursday, the calendar has many dates for U.S. economic data again. So, protect your capital and do not gamble on them 🙅♀️, because you never know when mixed data will appear and in what direction it will really go.Do not forget, it's a holiday in the U.S. on Friday 🇺🇸, and on Thursday, the U.S. Market is closing earlier than normal! ⏳The theory seems valid. With New York closing early today, the market is likely drifting sideways. The new session could potentially lead gold to $3350 or $3370.With a corrective move down to $3341 in the Asia Session on Thursday, the gold price came back later in this session to $3363. 📉📈During the Asia and European Sessions, the gold price was more or less ranging between $3365 and $3341. ↔️The U.S. Session began with economic data announcements showing good results: less jobless claims and a lower Unemployment Rate, paired with much better nonfarm payrolls for June than expected.📊 economists had forecast 111K new jobs, but the actual number was 147K. 🥳The reaction was a falling gold price from $3349 to $3311 ($38).🔽The retracement peaked at $3338, and after this ride, gold was ranging in the later session between $3334 and $3322. The U.S. market closed early today, and the price went down to $3326 at the end of the session. 📉Here's a summary of the economic data:- Average Hourly Earnings (MoM) (Jun): actual 0.2% (forecast 0.3%) ⬇️- Initial Jobless Claims: actual 233K (forecast 240K) ✅- Nonfarm Payrolls (Jun): actual 147K (forecast 111K) 🎉- Unemployment Rate (Jun): actual 4.1% (forecast 4.3%) ✅- S&P Global Services PMI (Jun): actual 52.9 (forecast 53.1) ↔️- ISM Non-Manufacturing PMI (Jun): actual 50.8 (forecast 50.8) ✅- ISM Non-Manufacturing Prices (Jun): actual 67.5 (forecast 68.9) ↔️Today, I saw several ideas with a Head and Shoulders Pattern on the 4H Chart, and I'd like to say I think it is not valid. 🙅♀️ In this image, you can see there is a former downtrend, and because of the nature of this pattern to be a reversal pattern, it cannot be valid without a previous uptrend. 📈🚫📉Sometimes patterns are present without the possibility of a confirmation for the outcome because the market declines a certain price to validate the pattern. This is also because they are partially psychological and also follow the events where the market is leading the price. 🧠💡The title should be till 04. July, sorry for the misstake.
Wick-Sniper
Beyond the Headlines - Gold Outlook June 16-20, 2025
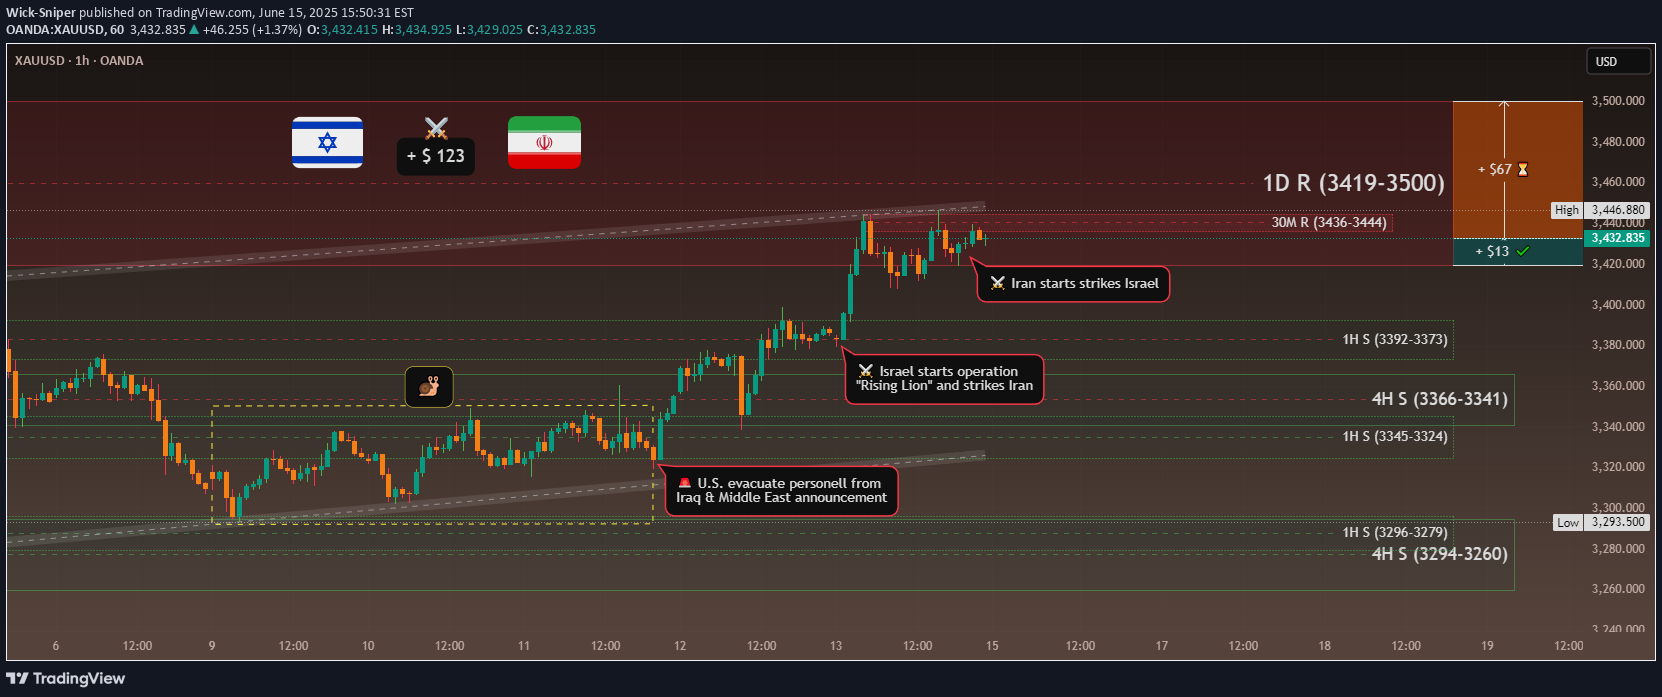
Beyond the Headlines: Gold's Ascent Amidst Global Shifts & Key Technicals 🌐🚀Everything about the last week can be found here: https://www.tradingview.com/chart/XAUUSD/p6UDZ6MI-Turbulent-Week-Ahead-Gold-Outlook-June-9-13-2025/XAUUSD 💰📈We all know what's going on, I believe. Israel struck Iran 💥, and this conflict will likely take a bit before things cool down. 🥶---## Geopolitical News Landscape 🌍📰### Israel / IranSince June 12, Israel launched "Operation Rising Lion," targeting Iranian nuclear sites like Natanz and Esfahan – over 128 killed, Iran claims. 🇮🇷 retaliated with missile and drone strikes on Haifa and Tel Aviv, killing at least 10. 🚀**Outlook:** 🔥 Tensions are spiraling. Without urgent mediation, full-scale regional war remains a real risk. 💣### India / PakistanSince the May ceasefire, few clashes have occurred. However, both navies increased readiness, signaling potential escalation at sea. 🚢**Outlook:** ⚖️ Peace is fragile. A strategic dialogue is key to avoiding a renewed border or maritime conflict. 🙏### Gaza ConflictBetween June 7–15, Israeli strikes killed at least 41 Palestinians, including 8 near an aid center in Rafah. Over 55,000 total deaths, and famine is looming. 💔**Outlook:** 🆘 Gaza remains a humanitarian catastrophe. Global pressure for access and a ceasefire must intensify. 🕊️### Russia / UkraineJune 13–15: Russia returned the bodies of 1,200 Ukrainian soldiers in a rare POW swap gesture. 🤝 Fighting remains intense in Sumy and Toretsk; Russia hit a major oil refinery. 🏭**Outlook:** 🕊️ While symbolic moves continue, no peace is in sight – battlefield outcomes will shape diplomacy. ⚔️### U.S. - China Trade WarThe U.S. hiked tariffs to 55% on key Chinese goods. 🇺🇸🇨🇳 responded with 10% on U.S. imports. Talks yielded a partial truce, but military-use rare earths remain unresolved. 💻**Outlook:** 🔧 Tech remains the battleground. Without progress on critical materials, the trade war may deepen. 📉### Global Trade WarThe OECD revised global growth downward due to rising tariffs from the U.S. targeting 🇨🇳, 🇲🇽, 🇨🇦. Global trade volume is expected to shrink by 0.2–1.5%. 📉**Outlook:** ⛓️ Supply chain disruption is spreading. Global trade will stay under pressure without coordinated policy. 🌍➡️🌍### Trump vs. PowellTrump labeled Powell a "numbskull" for not cutting rates, suggesting he might "force something" if re-elected. 🗳️ The Fed maintains policy independence ahead of a critical June decision. 🏛️**Outlook:** ⚔️ Political pressure on the Fed is mounting. Expect more friction as the election cycle heats up. 🔥### U.S. InflationCPI rose 2.4% YoY in May (from 2.3%); Core CPI held steady at 2.8%. Monthly growth was modest at 0.1%. Key rises were seen in healthcare and vehicle prices. 🚗🏥**Outlook:** Inflation is stable but sticky. 🚦 The Fed will likely hold rates steady until clearer disinflation signals appear. 📊---## Technical View 📐📈### Market Structure:Gold shows a clear **bullish market structure** with higher highs and higher lows. ⬆️ Recent price action suggests we're in a strong uptrend with institutional buying pressure. 🏦### Key Levels:* The chart shows a significant low around the **$3,245 area** (marked as "Low") which could act as a key institutional support level. 💪* The current high near **$3,446** represents a potential institutional resistance zone. 🛑* Look for potential **order blocks** around the **$3,380-$3,400 range** where price consolidated before the recent breakout. 🧱### Fair Value Gaps (FVG):There appear to be several gaps in the price action during volatile moves, particularly during strong rally phases. These could act as future support/resistance areas. 📉📈### Gann Analysis:The price movement shows strong adherence to Gann principles:* The rally from the low follows a steep angle, suggesting strong momentum. 🚀* Key Gann angles would place support around the **$3,300-$3,320 zone**. 📐* The current price near **$3,436** is testing natural resistance levels based on Gann square calculations. 📏### Fibonacci Levels:From the significant swing low to the current high:* 23.6% retracement: ~$3,395 📉* 38.2% retracement: ~$3,370 📉* 50% retracement: ~$3,345 📉* 61.8% retracement: ~$3,320 📉The golden ratio levels suggest key support on any pullback would be around the **$3,370-$3,345 zone**. ✨### Institutional Levels:* **Weekly/Monthly Levels:** The **$3,400** and **$3,450** areas appear to be significant institutional levels based on round numbers and previous price action. 🏦💰* **Smart Money:** The accumulation pattern before the breakout suggests institutional participation. 🧠💡### Cycle Timing:Based on the timeframe (appears to be 30-minute bars from May 26-June 15):* We're seeing approximately **3-week cycles** in the major moves. 🗓️* The current rally phase appears to be in its mature stage. 🌳* The next potential cycle turn could be approaching, suggesting caution for new longs at current levels. ⚠️---### Trading Considerations:* Watch for rejection at current levels near **$3,446**. 📉* Key support confluence around **$3,370-$3,345** for potential re-entry. 🎯* Volume and momentum divergences would be critical for timing any reversal. 📊🔄Other indicators tend to show bullish scenario enhancements. 🚀Gold has formed a **Standard Bullish Flag pattern** over a time from early April till today. 🚩🐂Also, the structure of a **reverse Head & Shoulders** is existing and has broken the neckline! 🔄🗣️Another indicator is an existing "**Ascending Bull Flag**." ⬆️🚩Please take the time to let me know what you think about this. 💬-------------------------------------------------------------------------This is just my personal market idea and not financial advice! 📢 Trading gold and other financial instruments carries risks – only invest what you can afford to lose. Always do your own analysis, use solid risk management, and trade responsibly.Good luck and safe trading! 🚀📊
Wick-Sniper
Turbulent Week Ahead? Gold Outlook June 9-13, 2025
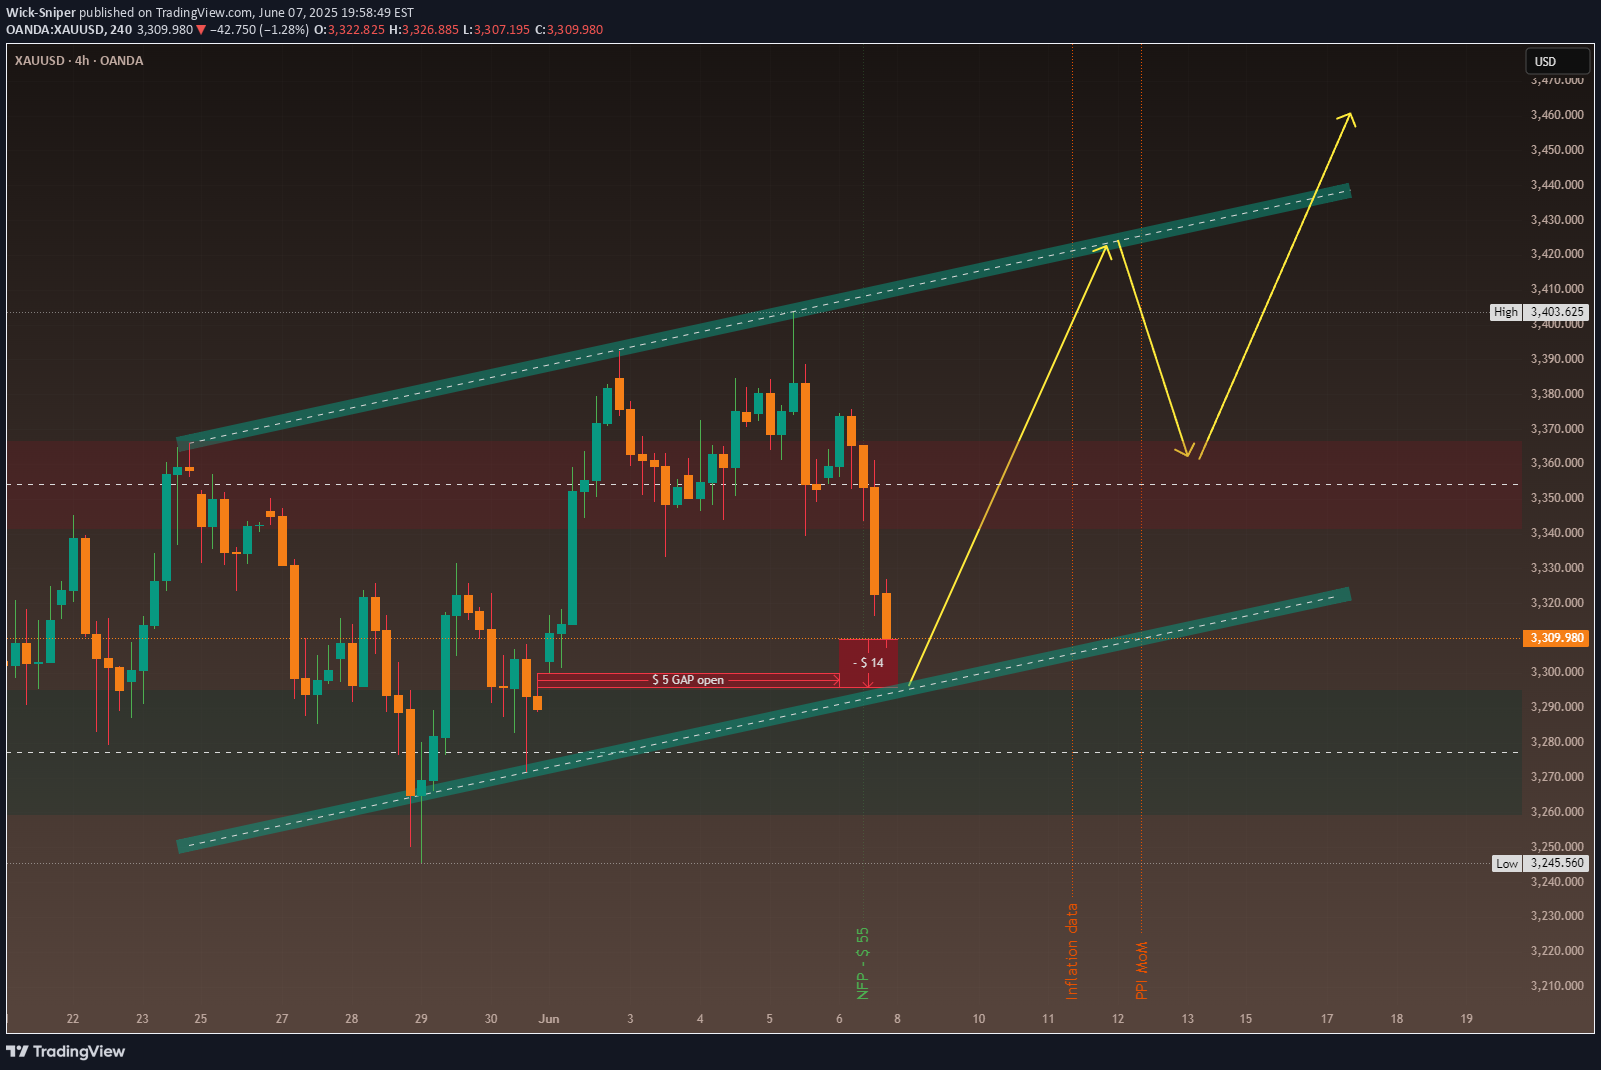
Hey fellow traders,Let's dive into the XAUUSD outlook for the upcoming week, June 9-13, 2025. The recent price action has been a rollercoaster 🎢, and the next few days promise even more fireworks 🎇.Looking back at the 30-minute chart from May 22 to June 6, gold saw an initial consolidation, then a strong rally to multi-week highs near 3,420. However, this was followed by a sharp, dramatic reversal, pushing prices back below 3,300. This "bull trap" 🐂 pattern suggests underlying weakness and potential preemptive market positioning.Another view on this could be the possibility that a gap on the chart at 3300-3295 of around $5 could get closed. Since strong support is right below this, it could serve as a good launchpad 🚀 for an upward rally. Let's see if the upcoming Asia session on Monday triggers this because its only - $14 from $3309.Key Drivers for the Week Ahead:📅 June 9, 2025 (Monday)US-China High-Level Trade Talks Commence in LondonHigh-level delegations from the United States and China began trade discussions in London. This meeting followed an announcement by President Donald Trump on Friday, June 6, 2025, who described a preceding 90-minute phone call with Chinese President Xi Jinping as "very positive".The US delegation included Treasury Secretary Scott Bessent, Commerce Secretary HowardLutnick, and US Trade Representative Jamieson Greer, reflecting a coordinated approach to addressing complex trade issues. The talks were primarily aimed at resolving the ongoing bilateral trade war, with a particular focus on tariffs and the global supply of critical rare earth minerals.5 While no specific time for the commencement of talks was provided, it is understood they began during London's daytime, approximately (10:12 CEST / 04:12 EDT).These discussions occurred in the context of a temporary 90-day agreement reached on May 12, 2025, which had seen the US reduce its tariffs on Chinese imports from 145% to 30%, and China reciprocate by lowering its tariffs on US goods from 125% to 10%.9 However, this temporary truce is set to expire in early August, and President Trump had recently accused China of violating the agreement, specifically regarding critical mineral exports. The broader bilateral relationship remains strained by issues extending beyond tariffs, including restrictions on advanced chips, student visas, and concerns over China's state-dominated economic model.The prompt scheduling of these high-level talks immediately after a leader-to-leader call suggests a tactical move towards de-escalation of immediate trade tensions, aiming to prevent a full-blown trade war. The objective appears to be managing current conflicts rather than achieving a fundamental resolution, especially with the May 12 agreement nearing its expiration. The core disputes, such as control over rare earths and technology, are deeply entrenched and reflect a broader geopolitical competition rather than mere economic disagreements. This pattern of temporary de-escalation followed by persistent underlying tensions indicates a long-term,structural competition. It suggests that trade policy is increasingly intertwined with national security and geopolitical strategy, implying that businesses should anticipate continued volatility and strategic decoupling in certain sectors, rather than a return to pre-trade war normalcy.Other big movers for gold will be the US inflation reports. 💥📅 Wednesday, June 11 (14:30 CEST / 08:30 EDT):We get the crucial US Consumer Price Index (CPI) data.Watch for Core CPI (YoY) with a forecast of 2.9% and headline CPI (YoY) at 2.5%.📅 Thursday, June 12 (14:30 CEST / 08:30 EDT):The US Producer Price Index (PPI) follows.Forecasts are for Core PPI (YoY) at 3.0% and headline PPI (YoY) at 2.6%.📊 These numbers are critical. If inflation comes in hotter 🔥 than expected, it will likely strengthen the US Dollar 💵 and push real interest rates higher 📈, making gold less attractive. This could trigger further declines 📉, especially given the current market structure. Conversely, cooler 🧊 inflation could spark a significant rebound 🔄.Beyond US data, keep an eye 👁️ on speeches from various European Central Bank (ECB) officials throughout the week, including President Lagarde on Tuesday (23:15 CEST / 17:15 EDT). Their collective tone 🎤 could influence EUR/USD dynamics and indirectly impact the US Dollar Index, offering a counterbalance ⚖️ or amplification to gold's movements.Key Numbers and Technical Levels to Watch:Gold is currently sitting on a substantial speculative net long position of 187.9K contracts. This is a massive amount of bullish bets 📊🐂, making gold highly vulnerable to rapid liquidation 💣 if the fundamental picture turns sour. A "long squeeze" could amplify any downside move.Immediate Support: The 3,300 level is paramount. A decisive break below it would signal further weakness. Below that, 3,250 is strong technical support where we saw a bounce previously.Overhead Resistance: Look for resistance at 3,350-3,360, and then the recent peak of 3,420. Reclaiming these levels would require a significant shift in sentiment.Expect high volatility ⚡, especially around the US inflation releases. Trade smart 🧠, manage your risk ⚖️, and stay nimble! 🏃Geopolitical News Landscape 🌍India / PakistanThe ceasefire from May 10 is holding, but diplomatic relations remain frosty. India has launched a global image campaign to gain support, while Pakistan insists on dialogue and accountability.Outlook: Without substantial agreements on border terrorism and water issues, tensions will stay latently high, with potential for new escalation risks. ⚠️Gaza ConflictViolence escalated again in early June. Israel intensified attacks, killing civilians seeking aid in Gaza City, and at least six people were killed at a distribution point.Outlook: The humanitarian situation continues to worsen 🚨, and international mediation efforts are urgently needed. However, an immediate ceasefire seems unrealistic. ❌Russia / UkraineIn the first week of June, Russia launched one of its largest series of attacks: hundreds of drones and missiles hit Kharkiv and Kyiv, resulting in civilian casualties. Simultaneously, a planned prisoner exchange has stalled.Outlook: Strategic air attacks will likely continue 💥, and the prisoner exchange remains deadlocked. Without a diplomatic initiative, the conflict will stay entrenched. 🕳️U.S.–China Trade WarFollowing talks between Trump and Xi, new negotiation rounds are expected in London. China has opened up rare earth exports, a sign of cautious de-escalation.Outlook: If dialogue channels open 🗣️, systemic trust could grow, but genuine reforms remain uncertain. 🤔🌐 Global Trade WarThe OECD has lowered its growth outlook to 2.9%, warning of protectionism 🧱 and delayed investments. The ECB is also maintaining synchronization with the FED.Outlook: Without de-escalation, the world faces a global economic slowdown 🐌 and permanent fragmentation of supply chains. 🔗🏛 Trump vs. PowellTrump has again complained about the FOMC's hesitancy, nicknaming Powell “Too Late,” and demanding a full 1% interest rate cut.Outlook: Pressure is mounting 📣. Whether the Fed yields depends on if inflation and labor data allow for a loose policy. 🎯💵 U.S. Inflation – May 2025Forward-looking data shows a weakening services sector and consumer prices rising again as tariffs pass through. Official CPI data for May 2025 will be released on June 11.Outlook: Higher inflation could halt the Fed's "dereflexion" course — a dilemma ⚖️ between growth 📈 and price stability. 🛑Technical View 📐Regarding the major Head and Shoulders (H&S) reversal pattern on the 4H chart I shared previously, I'd like to explain some new developments that are altering its potential outcome.Since the price has re-entered and fallen below the neckline, I activated my "second brain cell" 🧠 to guess what could be next. This led me to revise the larger 4-hour chart structure with the adjustments shown in the accompanying image.As you can also see in the updated version below, a reversed H&S pattern remains a possibility, as the proportions still appear valid. 🔄Potential Scenarios for Gold 🧩Under this revised idea, Gold could potentially reach the neckline entry at 3397 (+88) from the current price. This is one plausible scenario. ✅Alternatively, the price could drop further to the "Head" at 3120 (-191 from the current 3309), which would, of course, invalidate this H&S pattern. ❗While this is speculative 🔮, given that trading often involves psychological movements and their resulting impacts, I believe this is a favorable approach to forecasting.Another reason to see it as bullish is the formed standard bull flag 🚩🐂.Please take the time to let me know what you think about this. 💬-------------------------------------------------------------------------This is just my personal market idea and not financial advice! 📢 Trading gold and other financial instruments carries risks – only invest what you can afford to lose. Always do your own analysis, use solid risk management, and trade responsibly.Good luck and safe trading! 🚀📊Patterns! In the last few weeks, we've seen some interesting ones, and I'd like to show you why I like them so much.The actual pattern here is this yellow reverse H&S. Let's see if it plays out.It wasn't a bad Monday. The Asia Session closed the gap, and over the day, the gold price rose to $3338 from a low of $3293. In later hours Monday, gold turned into waiting mode, and so did traders, because everyone is awaiting news from the negotiation talks in London between the USA and China. Since no real output is public, the price went down a little bit to $3325. Let's see what Tuesday brings.When both parties can agree on a good deal for both sides and the outcome is stable, then we'll probably see gold rushing down the alley. If no deal can be made during these negotiations, then gold will probably rise.However, because the day of "Inflation Data" is coming closer, I hope we don't get everything at once.So far, gold is playing as expected.More than two days of waiting for news ⏳, and a market that feels frozen 🧊, with a smaller range than in normal times and not offering many opportunities to get good entries, is...Trading in a range of $30 is...My time to trade is limited ⏱️, so I don't have the 23-hour ability others have for trade opportunities.But waiting for a chance is like what every hunter has to do until their quarry appears to hunt it down 🏹, right? Gold is recently acting like a rabbit running in zigzags to escape 🐇. And the few chances I had to make a catch turned out to be bait or lacked enough volume to break through resistance or support. Hopefully, this is over soon 🙏, and the market can get back to normal. "Normal" would need to be defined, but it's definitely different from now.Let's see what Wednesday brings 🗓️. I was hoping we'd get news about a trade deal between China and the USA today 🇨🇳🇺🇸, but it seems to be more complicated the longer it takes. Good luck to everyone tomorrow 🍀 because it could be big if inflation data comes out 📈 and maybe news about a deal. Take care ⚠️, because if it goes as expected, the movements could be very sharp, from down to up and so on.Tariff War: Trump's "Deal" with China 🇺🇸🇨🇳Of course, Trump announced a "deal" with China is done, but because this "deal" is a work in progress and not officially accepted by both sides, the decision isn't finalized yet. 🤔Deal getting US-China trade truce back on track is done, Trump says. ✅Trump says US tariffs will be set at 55%, China's at 10%. 💰The deal should resolve rare earth minerals and magnet curbs. 🌎It seems there's not enough trust for a good standing on this, as the gold price reacted with high demand, surging from $3327 to $3360 (a gain of $33)! 📈--------------------------------------------------------------------Inflation Data Announcement 📉US Inflation Rate Rises Less than Expected! 😮The annual inflation rate in the US rose for the first time in four months to 2.4% in May 2025 from April’s 2.3% (the lowest since 2021), but came in below expectations of 2.5%. Prices rose more for:Food (2.9% vs 2.8% in April) 🍔Transportation services (2.8% vs 2.5%) 🚗Used cars and trucks (1.8% vs 1.5%) 🚙New vehicles (0.4% vs 0.3%) 🆕On the other hand, inflation fell slightly for shelter (3.9% vs 4%). Meanwhile, energy costs declined 3.5%, following a 3.7% fall in April. Prices for gasoline (-12% vs -11.8%) and fuel oil (-8.6% vs -9.6%) continued to decrease, while the rise for natural gas prices remained elevated (15.3% vs 15.7%). ⛽On a monthly basis, the CPI edged up 0.1%, below 0.2% in the previous month and forecasts of 0.2%. In addition, annual core inflation (which excludes volatile food and energy prices) remained at 2.8%, holding at 2021-lows, while expectations were pointing to a rise to 2.9%. The monthly core CPI also edged up 0.1%, below 0.2% in April and expectations of 0.3%.Because of these softer numbers (expectations were worse), the gold price fell from $3360 back down to $3328. 📉--------------------------------------------------------------------Later on Wednesday: Market Shift! geopolitical 🌍News arrived later on Wednesday, and the whole market changed! 🚨Evacuation of US Diplomatic Presence for Several States in Middle East:Officials cite 'heightened security risks' for the decision. ⚠️The US has previously threatened to strike Iran. 💥US military dependents authorized to leave the region. ✈️Gold surged from $ 3315 back to $ 3355 (+$ 40).Behind these announcements, it's clear there's more to it. Tomorrow will be hot again for traders and the market! 🔥Because of all this, it seems the old structure about the big reverse H&S comes back into play. Still interested to see where all actual things lead gold to! 💰📈Thursday: Despite expectations of a falling gold price due to a better-than-forecasted US - PMI, gold actually rose from $3338 to $3399 (a $61 increase) over the day. 📈The PMI came in softer at 0.1, while 0.2 was forecasted. Normally, this would suggest a "sell" scenario, as it's better than expected. However, the ongoing uncertainty surrounding the Israel-Iran conflict is providing a strong foundation for gold's growth. Additionally, the unpredictable situation surrounding a potential trade deal between China and the USA adding to the market's unease. Even with Trump's claims of a deal, it's public knowledge that tariffs are set to remain until the end of August, leaving much up in the air. 🤷Gold is in a tricky position! After a hot trading day with heavy volume and some wild price movements, I'm glad I secured some profits. 🤑 Now, looking at the chart at the end of the day, all I see is RESISTANCE, and a lot of it! 🚧I have no idea how Asia will react in the upcoming session. 🤔 But if they drive the price higher, I think the daily resistance between $3419 and $3500 could be the ceiling. Anything is possible; maybe the Asian session will truly break through. Personally, I lean more towards a pullback if $3419 is touched.Perhaps Friday will be a sell day? Who knows! 📉Another thing I noticed, without knowing its accuracy for sure, is that the Big Reverse Head & Shoulders pattern has already touched its neckline! 🤯I'm not sure what's coming next, but if the price keeps climbing, it will be a tough decision for me to enter a trade, at least until a new All-Time High (ATH) becomes visible. 🧐But that's not all! There's also another Reverse Head & Shoulders forming on a smaller timeframe, which isn't complete yet, but take a look: 👀When the price reaches $3429, the left shoulder's bottom will be ready (I know it's technically at the top for a reverse H&S).With all this in mind, I believe we might see at least a little bit of movement towards $3429, followed by a pullback to around $3333? 🤔Stay tuned and let me know what you think about this theory! 👇Friday recap 📉starting with high expectations for a growing price, likely influenced by the geopolitical tensions in Israel and Iran.The Asia Session kicked things off nicely, pushing the price up from $3379 to $3444 (a solid +$65 gain! 💪). However, during the European session, the price dipped back down to $3408 before surging again to $3446, marking a new higher high (+ $38). 📈As the US Session came in, we saw a higher low at $3419 (-$27). After that, the market was mostly "hovering the grass," or chopping sideways 🤷♀️, with crazy volume bouncing back and forth.The market ultimately closed at $3432, with approximately 18% more trade volume than average (570k compared to 481k). 📊Overall, it was disappointing to see the price not break out and rise higher than $3446. Hopefully, Monday brings a more stable and predictable market environment. 🤞While the situation in Israel and Iran continues to develop, it seemed big players were taking "dumb money" from retail traders like crazy on Friday. 💰🤔
Wick-Sniper
Shoulder on Shoulder - Need a dump this Week

😥 The past week was complicated, and I don't want to bore you with all the political goings-on, which I hope you're already aware of. I'm a bit short on time right now, but I still wanted to share this perspective with you all.💁♂️ It is Shoulder on Shoulder H&S everywhere!💡 My concept of a plan:🧗 Let's climb the Pinky way down3289 - Actual Price3271 - 🏁 S13232 - 🚪 Pink Neckline entry3245 - 🤞 S2 & Head of White reverse H&S3204 - 👀 Pink Start from Left Shoulder3184 - 🎯 TP 1 - Fibo 1.2723163 - 🎯 TP 2 - Fibo 1.414 or 31663134 - 🎯 TP 3 - Fibo 1.618 or 31543120 - 👀 Head of Yellow reverse H&S3079 - 🎯 TP 4 - Fibo 2🗣️ Important: FED Chair Powell speaking June 02 Mon at 1 PM EDTWhat are your toughts about this? Please write it in the comments.-------------------------------------------------------------------------This is just my personal market idea and not financial advice! 📢 Trading gold and other financial instruments carries risks – only invest what you can afford to lose. Always do your own analysis, use solid risk management, and trade responsibly.Good luck and safe trading! 🚀📊This structure was negated after price raised above the head of the pink H&S.
Wick-Sniper
Possible Reverse Head and Shoulders?

👁️🗨️ The strong uptrend yesterday, followed by the downtrend during the Asian session, has built a possible inverse head and shoulders pattern (30 min chart) 🤷🏼♂️.⏫ If an uptrend follows today, the pattern will be complete.The right shoulder began around $3287, which isn't far from the current price.👀 Keep an eye on this, as it could drop lower while still keeping the structure intact.⚡ What's very interesting is that the downward trendline (strong resistance) crosses the neckline support if the time window allows.🙏 Possible target points:TP 1: $3358TP 2: $3382What are your toughts about this? Please write it in the comments.-------------------------------------------------------------------------This is just my personal market idea and not financial advice! 📢 Trading gold and other financial instruments carries risks – only invest what you can afford to lose. Always do your own analysis, use solid risk management, and trade responsibly.Good luck and safe trading! 🚀📊As expected, the inverse Head & Shoulders pattern is still in the process of forming.Due to today's better-than-expected economic news, it was anticipated that the gold price would fall, which it did, from around $3304 to $3271 (a $35 drop). Some consolidation and perhaps another drop could occur, but overall, I see the pattern remaining intact.After reaching $ 3379 i closed this trade. Crazy market, was not 100% this could reach almost TP 2 but almost did, good profits. Lets see if Powell brings it down later on.
Disclaimer
Any content and materials included in Sahmeto's website and official communication channels are a compilation of personal opinions and analyses and are not binding. They do not constitute any recommendation for buying, selling, entering or exiting the stock market and cryptocurrency market. Also, all news and analyses included in the website and channels are merely republished information from official and unofficial domestic and foreign sources, and it is obvious that users of the said content are responsible for following up and ensuring the authenticity and accuracy of the materials. Therefore, while disclaiming responsibility, it is declared that the responsibility for any decision-making, action, and potential profit and loss in the capital market and cryptocurrency market lies with the trader.