
Who-Is-Caerus
@t_Who-Is-Caerus

What symbols does the trader recommend buying?
Purchase History
پیام های تریدر
Filter
Who-Is-Caerus
راز معاملات طلا: ریسک به ریوارد 1:26 با اندیکاتور محرمانه!
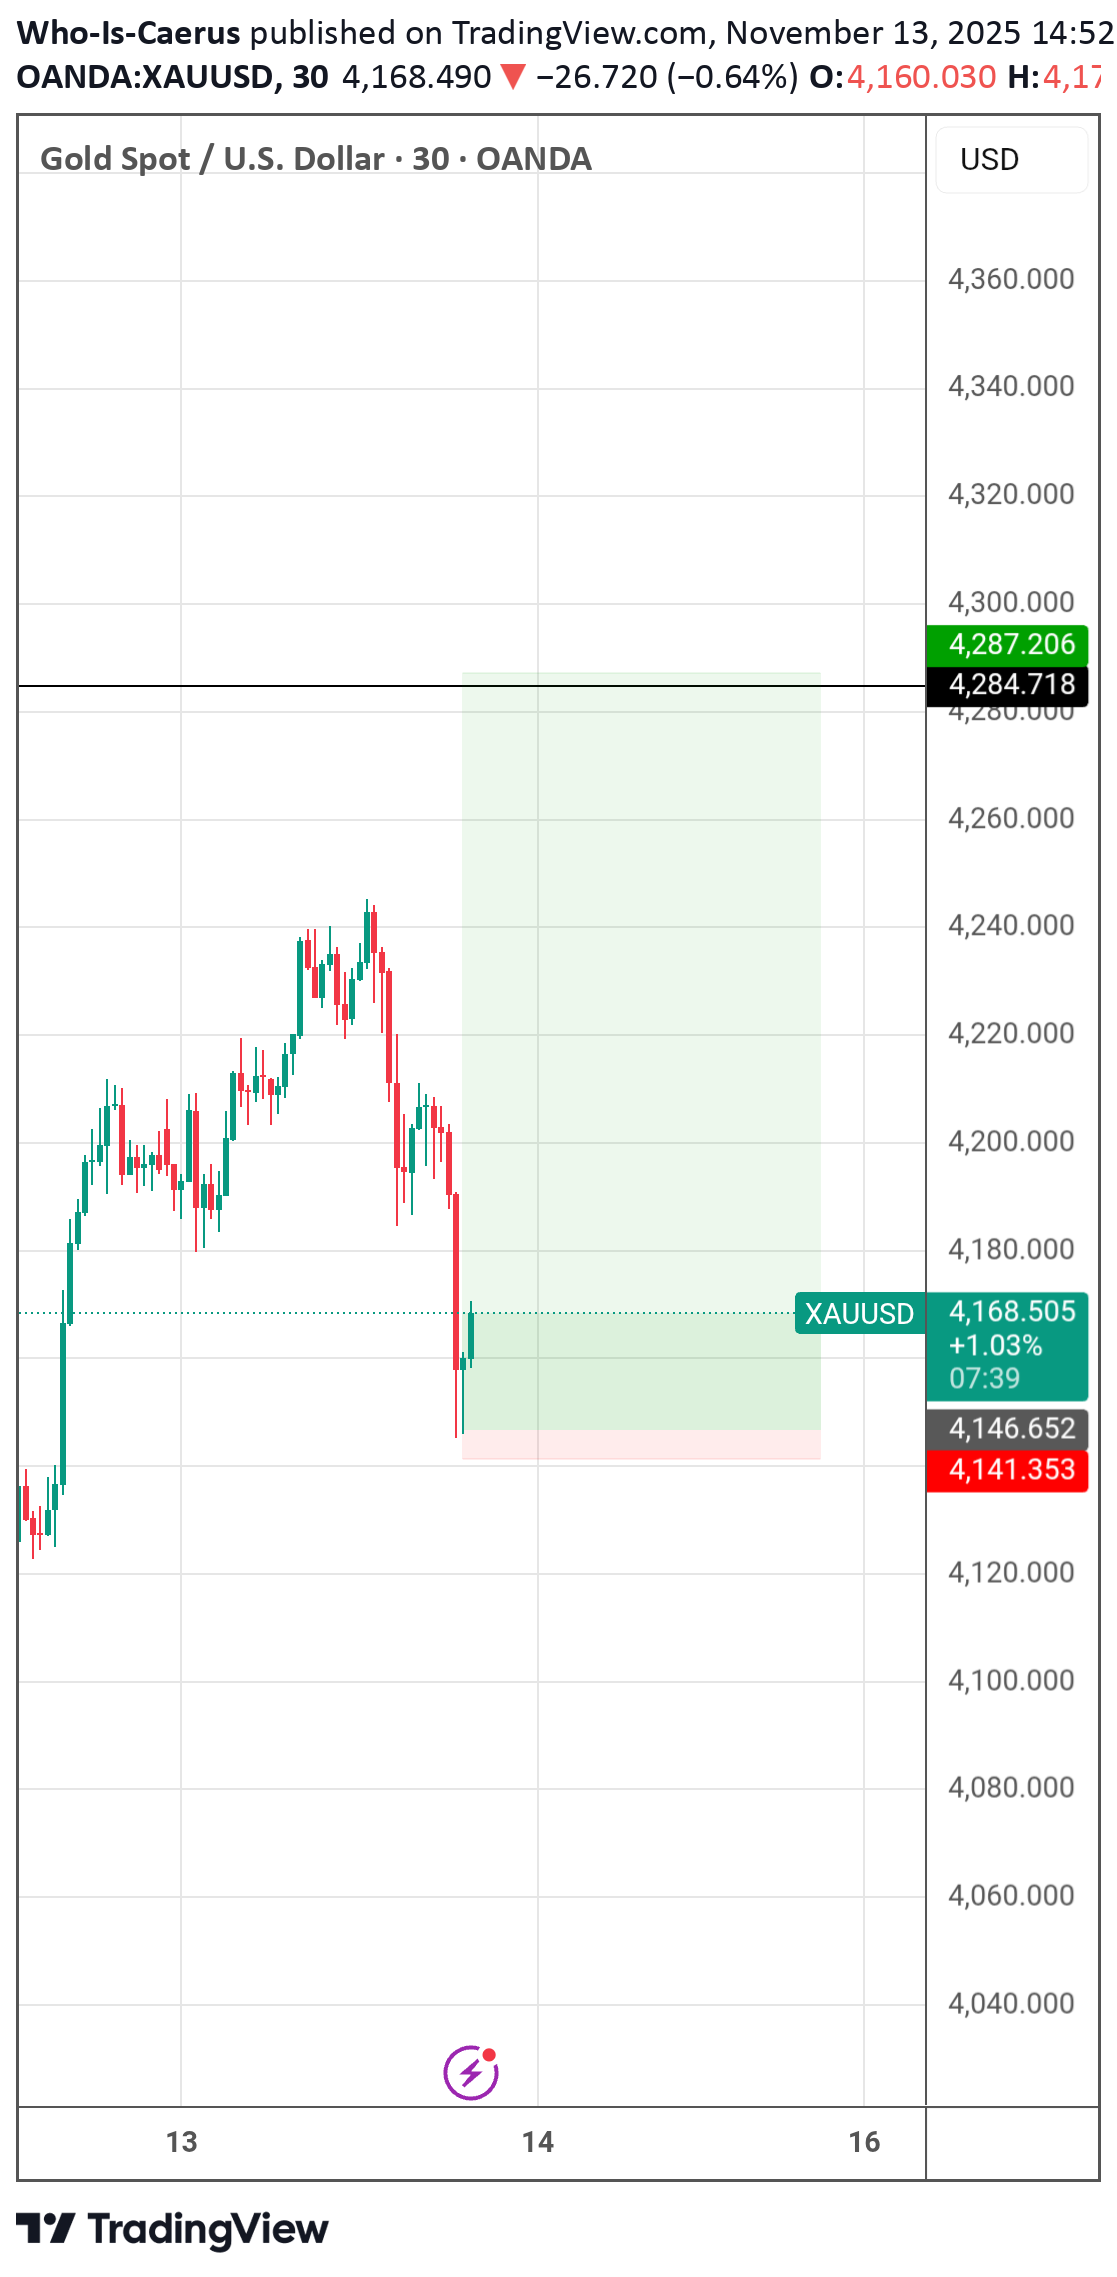
Structure fulfilled. Next structure target. Using one of my self made indicators which uses probability to identify future structure with extreme accuracy. Have to hide when publishing public ideas 🤷♂️
Who-Is-Caerus
gold 3270 13th june, and 3050 6th july

Gold on its way. Patience. Then 4400 ath imo. regardless, 3k ish on the table in the meantimeOpen since 3388 tbf
Who-Is-Caerus
BTC/USD Short Trade Setup Analysis (1D Timeframe - Bitstamp)

📍Currently, Bitcoin is showing signs of a potential rebound, but technicals suggest we are not yet at a confirmed reversal. We can see how BTC has recently broken below the ascending channel hitting a low of $78,000 which was very close to out $75,000 target. While it is possible for a sharp rejection up and beyond previous highs, it is unlikely. We anticipate that Bitcoin is testing the broken channel as resistance before falling lower towards our $75,000 target over a period of months (potentially 6 months) consolidating in an tighter range until a direction is determined. This latest move upwards by Bitcoin and the trailing market is the result of the Trumps crypto reserve statement. The market seen a surge after his remarks, but this will be short lived because nothing has actually changed:Size of the Reserve:No official size has been confirmed, but proposals vary. Senator Cynthia Lummis suggests acquiring 1 million Bitcoins over 20 years (about 5% of total supply). Trump’s March 2, 2025, announcement named Bitcoin (BTC), Ethereum (ETH), XRP, Solana (SOL), and Cardano (ADA) for inclusion but didn’t specify amounts. The government currently holds ~200,000 Bitcoins (worth ~$18–21 billion) from law enforcement seizures, which could form the basis of the reserve.Timeline for Filling the Reserve:Lummis’ proposal outlines a 20-year timeline to acquire 1 million Bitcoins (200,000 per year). Trump’s January 2025 executive order tasked a working group with evaluating the reserve within 180 days (by July 2025), but no specific timeline for filling it was provided. Posts on X speculate on faster timelines, but these lack official confirmation and are inconclusive.Is It Actually Going to Happen?The proposal is still exploratory, not finalized. Trump’s executive order and March 2 announcement show intent, but congressional approval is likely needed for major purchases or funding beyond seized assets. Experts like Nic Carter (via web sources) doubt a “true” reserve will pass Congress due to economic and political opposition. Posts on X show mixed sentiment—some bullish, others skeptical—but no definitive action has occurred.Can Trump Make This Happen Unilaterally?No, Trump cannot create or fund a large-scale reserve alone. The executive order allows evaluating and potentially using seized assets (~200,000 Bitcoins), but expanding it (e.g., to 1 million Bitcoins) requires congressional legislation and funding. Some argue the Treasury’s Exchange Stabilization Fund could be used, but legal experts and posts on X suggest significant hurdles remain, including Federal Reserve and congressional oversight.This push in price is driven by hype, fomo and retail traders not understanding the market. Current Outlook:Risk/Reward = 1:12.5📉 Bearish Scenario (Anticipated outcome)- ❌ Invalidation Level: Above $100,000- 🔻 Downside Targets:Bitcoin appears to be testing the recent break of the parallel channel. We expect to see Bitcoin fall to test previous structure high, which lines up with the 61.8% fib at $75,000.✅ Justification:- Bitcoin remains in a long-term bullish trend, however given the recent break below the parallel channel, we are currently still bearish whilst it remains below $100,000.- Bitcoin / the market have seen strong bullish moves since Trump became president, with "positive" news coming frequently. However, upon deeper inspection, this positive news lacks sustenance, and will likely be deflationary over the coming weeks and months as traders begin to realise that nothing has changed.⚡ Key Takeaways:- 🔹 Bitcoin has broken the parallel channel to the downside, hinting at a potential further drop.- 🔹 The recent break of the channel is usually followed by a test of broken support, to be confirmed as resistance before falling lower. We believe this is what we are seeing now.- 🔹 Bitcoin still remains in a long-term bullish direction, so we will take shorts when appropriate, with tight stops at invalidation levels mentioned above.- 🔹 Expect price to fall from here, down towards $75,000 over the next few weeks / potentially months of consolidation.Bullish invalidation: - 🔹 If Bitcoin breaks above $100,000 we can consider a long, targeting $110,000. With a stop placed below the lower support of the ascending channel. We must wait for candle closes before entering. ❗Fundamental Outlook:❗📍The recent macroeconomic environment, including U.S. monetary policy shifts and global adoption of Bitcoin, has significant implications for its price.❗1. U.S. Monetary Policy and Inflation ConcernsThe Federal Reserve’s cautious stance on interest rates in early 2025, coupled with persistent inflation fears, has driven investor interest in Bitcoin as a hedge against fiat currency devaluation. Lower interest rates or quantitative easing could further bolster Bitcoin’s appeal as a store of value.❗2. Institutional Adoption and ETF InflowsMajor financial institutions and Bitcoin ETFs have seen record inflows in 2025, with companies like BlackRock and Fidelity increasing their exposure. This institutional buying pressure supports a bullish outlook for Bitcoin, as it signals growing acceptance of cryptocurrencies in traditional finance.❗3. Geopolitical UncertaintyOngoing geopolitical tensions, such as U.S.-China trade disputes and regional conflicts, have increased demand for decentralized assets like Bitcoin, which are seen as immune to government interference or currency controls.❗4. Halving and Supply DynamicsAlthough the most recent Bitcoin halving occurred in 2024, its effects on reducing new supply continue to tighten market dynamics, potentially driving prices higher as demand outpaces supply growth.Fundamental Analysis Conclusion📍Macroeconomic uncertainty, institutional adoption, and Bitcoin’s supply dynamics create a bullish environment for its price.📍Geopolitical risks and inflationary pressures reinforce Bitcoin’s role as a digital store of value, supporting upward price movement.📍Growing ETF inflows and institutional interest suggest sustained buying pressure in the near term.Outlook: Mixed signals for Bitcoin direction📈Given the combination of macroeconomic tailwinds, institutional adoption, and Bitcoin’s unique supply characteristics, the fundamentals point toward continued strength in Bitcoin prices. However, many of these fundamentals on the surface appear to point towards the bulls, but we must be cautious of trading what you hear, vs what you see. Technically, bitcoin is bearish in the shorter term, unless it breaks back above $100,000.Going well.
Who-Is-Caerus
XRP/USD Short Trade Setup Analysis (9H Timeframe - Bitstamp)

🔹 Current Setup:📈 XRP experienced a strong move down from our previous entry at 2.84. Currently XRP has broken through and entered the middle parallel channels whilst respecting and testing their boundaries, verifying the channels validity as a true trading range thus far. At this moment we can see that XRP has broken down to the middle channel, breaking through the median/equilibrium line before now returning up to test the middle channels resistance level.🔹Price appears to be respecting the level so far ($2.25), with early signs showing a potential break down from this level. 📉 Given our previous entry at 2.84 which remains open, we can now enter a new position here, upon touch of the middle channels upper resistance level. We want to use a tight stop loss, and a smaller amount of margin for this one, given that price is between higher timeframe support and resistance levels. We can see that the most recent high, formed via a candle wick sits at 2.361, so our stoploss should be placed just slightly above this level around 2.38 at which point if hit, would invalidate this trade. 🎯 This allows us to target our new level of 1.52, updated from Februarys 1.4 target identified by the -0.272 fib extension, and a monthly dynamic support.🎯Previous Trade:Current Outlook:📍 Key Resistance Levels (Potential Rejection Zones):- 🎯 $2.25 (Middle channels upper resistance)- 📍 Key Support Levels:- ❗ $2.10 (0.23 Fib retracement)- 🔻 $1.76 (100 Fib retracement)- 📉 Deeper Target: $1.52 - $1.40 XRP (Projected based on Fibonacci extensions, channel breakdown & monthly dynamic support)📈 Bullish Scenario (Breakout Play)- 🟢 Entry: If price breaks above $2.38, our stop will be hit and we should also close our original short from 2.84.✅ Justification:- 🔹 If price breaks and holds above $2.38, the bearish structure could be invalidated and price would find itself back within the higher parallel channels range. At this point it would be advised to close all positions and wait for confirmation in direction.📉 Bearish Scenario (Primary Expectation)- ❌ Invalidation Level: Above $2.38- 🔻 Downside Targets:- $2.10: 0.236 Fibonacci retracement- $1.76: 100 Fibonacci retracement- $1.52: Monthly dynamic support- $1.36 - $1.40 XRP: Final bearish target (0.272 Fib extension & channel bottom)✅ Justification:- ❗ Price remains within a descending channel, signaling a continuation of the downtrend.- ❗ The ETF-driven pump appears to be a liquidity grab, leading to a likely reversal.- ❗ A rejection from $2.35 / the middle channels upper resistance, it would confirm bearish continuation, targeting the lower support zones.- ❗ Bitcoin still needs to come lower to test support, therefore, XRP is likely to fall further due to Bitcoins directing the broader market.⚡ Key Takeaways:- 🔹 XRP is facing parallel channel resistance at $2.25, a likely rejection zone.- 🔹 A breakdown below $2.00 increases bearish pressure, targeting $1.52 XRP.- 🔹 Bearish bias remains unless price breaks & holds above $3.21.- 🔹 Expect price to follow the descending channel structure toward $1.52 - $1.40.
Who-Is-Caerus
XRP/USD Short Trade Setup Analysis (9H Timeframe - Bitstamp)

🔹 Current Setup: - 📈 XRP experienced a strong move upward following ETF news but is now approaching major resistance. - 🔹 Price is testing the 0.618 Fibonacci retracement level at $2.66, aligning with the descending channel's resistance. - 📉 Given the broader bearish trend, a rejection from this level could trigger a strong downside move. - 📍 Key Resistance Levels (Potential Rejection Zones): - 🎯 $2.87 (0.764 Fibonacci retracement & upper channel resistance) - 🎯 $3.21 (Full Fibonacci retracement, invalidation level for bears) - 📍 Key Support Levels: - ❗ $2.48 (0.5 Fibonacci retracement) - 🔻 $2.36 (0.382 Fib retracement) - 📉 Deeper Target: $1.36 - $1.40 XRP (Projected based on Fibonacci extensions & channel breakdown) 📈 Bullish Scenario (Breakout Play) - 🟢 Entry: Above $2.87 (If price breaks above 0.764 Fib) - 🎯 Take Profit 1: $3.21 (Full retracement level) - 🎯 Take Profit 2: $3.50+ (Potential bullish expansion) - 🔴 Stop Loss: Below $2.66 ✅ Justification: - 🔹 If price breaks and holds above $2.87, the bearish structure could be invalidated. - 🔹 Momentum from the ETF-driven rally might fuel another leg up beyond $3.00. - 🔹 A strong breakout above $3.21 would confirm a bullish reversal. 📉 Bearish Scenario (Primary Expectation) - ❌ Invalidation Level: Above $3.21 - 🔻 Downside Targets: - $2.48: 0.5 Fibonacci retracement - $2.36: 0.382 Fibonacci retracement - $1.76: Key structure support - $1.36 - $1.40 XRP: Final bearish target (0.272 Fib extension & channel bottom) ✅ Justification: - ❗ Price remains within a descending channel, signaling a continuation of the downtrend. - ❗ The ETF-driven pump appears to be a liquidity grab, leading to a likely reversal. - ❗ A rejection from $2.66 - $2.87 would confirm bearish continuation, targeting the lower support zones. ⚡ Key Takeaways: - 🔹 XRP is facing strong resistance at $2.66 - $2.87, a likely rejection zone. - 🔹 A breakdown below $2.48 increases bearish pressure, targeting $1.40 XRP. - 🔹 Bearish bias remains unless price breaks & holds above $3.21. - 🔹 Expect price to follow the descending channel structure toward $1.36 - $1.40.So far so good. Breaking below a key support1.6 target hit. expecting lower
Who-Is-Caerus

🔍 Market Context: - XRP/USD is currently experiencing a sharp decline, breaking below key trendline support. - The price has dropped significantly, reflecting bearish momentum, and is now approaching critical Fibonacci retracement levels. - Fibonacci retracement levels and trendline intersections suggest potential areas of support and resistance for a possible reversal or continuation. 📊 Trade Entry Criteria: - The price has broken below a key ascending trendline, confirming bearish sentiment. - A bearish continuation is expected if the price remains below the broken trendline and key support zones. - A possible reversal could occur if price reclaims the trendline and moves above 2.45 resistance. 🎯 Trade Targets & Risk Management 🔴 Bearish Scenario: - Entry Price: Below 2.40 USD (break of support) - Take Profit (TP1): 1.94 USD (50% Fibonacci retracement) - Take Profit (TP2): 1.6 USD (61.8% Fibonacci retracement) - Take Profit (TP2): 1 - 1.2 USD (76.4% Fibonacci retracement and psychological support) - Stop Loss (SL): Above 2.45 USD (previous structure resistance) 🟢 Bullish Scenario: - Entry Price: Above 2.45 USD (trendline recovery) - Take Profit (TP1): 2.56 USD (61.8% Fibonacci retracement) - Take Profit (TP2): 2.69 - 2.86 USD (50%-38.2% Fibonacci resistance levels) - Stop Loss (SL): Below 2.38 USD (confirmation of bearish continuation) 📉 Profit Target Justification: - The bearish target aligns with Fibonacci retracement zones and previous price action, suggesting further downside if the break holds. - The bullish target is supported by Fibonacci levels and previous resistance-turned-support areas. 📌 Summary ✔ Price is at a crucial support level, with a confirmed bearish breakdown. ✔ Fibonacci levels provide clear confluence for both bullish and bearish trade setups. ✔ Risk-to-reward ratio is favourable, with a well-defined invalidation zone. 🔻 Invalidation: - If price moves back above 2.45 USD, the bearish setup is invalidated. - If price fails to reclaim 2.40 USD, the bullish recovery scenario weakens.
Who-Is-Caerus

🔍 Market Context: - XRP/USD is in a downtrend, forming lower highs and lower lows on the 4-hour timeframe. - The price has bounced off a key support zone (green highlighted area) but remains under bearish pressure. Long here should have a tight stop, and be careful not to over margin your position.- Fibonacci retracement levels indicate potential resistance zones above. 📊 Trade Entry Criteria: - The price has reacted to a strong support level around 2.79 - 2.80 USD, forming a potential double bottom. - A bullish reversal is possible if the price breaks above the 2.85 - 2.90 USD resistance zone. - Alternatively, rejection from resistance could lead to another leg down. 🎯 Trade Targets & Risk Management - Bullish Scenario: - Entry Price: Above 2.85 USD - Take Profit (TP1): 2.95 USD (38.2% Fibonacci) - Take Profit (TP2): 3.00 - 3.05 USD (50%-61.8% Fibonacci) - Stop Loss (SL): Below 2.75 USD - Bearish Scenario: - Entry Price: Below 2.79 USD (break of support) - Take Profit (TP1): 2.68 USD (-27.2% Fib extension) - Take Profit (TP2): 2.54 USD (-61.8% Fib extension) - Stop Loss (SL): Above 2.85 USD 📉 Profit Target Justification: - The bullish target aligns with key Fibonacci retracement levels and a previous liquidity zone. - The bearish target aligns with Fib extensions and historical price action, indicating potential further downside. 📌 Summary ✔ Price at key support level with a possible bounce or breakdown. ✔ Fibonacci confluence provides clear trade setups for both bullish and bearish scenarios. ✔ Risk-to-reward ratio is favourable in both directions. 🔻 Invalidation: If price breaks below 2.75 USD, bullish setups are invalid. Conversely, a strong move above 2.90 USD would invalidate bearish setups.
Who-Is-Caerus

🔍 Market Context: - Bitcoin has completed a five-wave Elliott Wave structure, suggesting a potential corrective phase. - A corrective ABC wave is forming, with wave (b) rejecting at the 0.753 Fibonacci retracement level (106,484 USD), indicating strong resistance. - The price is showing weakness at key resistance, confirming a possible trend reversal or deeper retracement. 📊 Trade Entry Criteria: - The short trade is based on Elliott Wave analysis, expecting a wave (c) drop towards Fibonacci extension targets. - Price is currently in a consolidation zone after completing wave (b), showing signs of a lower high formation. - Strong resistance is holding at 106,484 USD, preventing further upside. 🎯 Trade Targets & Risk Management - Entry Price: Around 101,767 - 106,484 USD - Stop Loss (SL): Above 109,295 USD (previous key resistance) - Take Profit (TP): - First target: 92,482 USD (previous support) - Second target: 87,646 USD (1.618 Fibonacci extension) - Extended target: 76,374 - 73,440 USD (0.618 Fibonacci retracement) - Risk-to-Reward Ratio: High probability setup with a strong risk-reward structure. 🛑 Stop-Loss Placement: - The stop-loss is placed above 109,295 USD, invalidating the short if price continues upwards. 📉 Profit Target Justification: - The 1.618 Fibonacci extension at 87,646 USD aligns with key support and an ideal corrective wave target. - If bearish momentum increases, a deeper retracement toward 72,273 - 63,526 USD is possible. 📌 Summary - Bitcoin has likely completed a five-wave rally and is entering a corrective phase. - Fibonacci resistance at 106,484 USD is holding, indicating a strong rejection point. - Wave (c) projection suggests a decline toward 87,646 - 73,440 USD, aligning with key support levels. - If price reclaims 109,295 USD, the trade setup is invalidated and a continuation to new highs could occur. 🔻 If confirmed, this short setup provides a strong risk-reward ratio with multiple profit targets in case of deeper correction.Trade is going well. Take partial profits here at 100.5k as we may see price pull up abit from here before resuming lowerTrade closed. Can keep a portion open if you choose depending on your entry. Pull up is a potential. We can look for another short soon.
Who-Is-Caerus

🔍 Market Context: - XRP/USD is trading within a rising channel, but recent price action shows signs of weakness near the upper resistance level. - A breakdown from a smaller ascending trendline suggests that bearish momentum is building. - The price is testing a key horizontal resistance zone while struggling to break higher. 📊 Trade Entry Criteria: - Entry is positioned at the rejection of the upper channel resistance. - The price has broken a minor trendline, indicating a potential shift in momentum. - A lower high structure is forming, which may confirm a bearish reversal. 🎯 Trade Targets & Risk Management - Entry Price: Around 3.018 - 3.132 USD - Stop Loss (SL): Above 3.291 USD (above the recent highs) - Take Profit (TP): 2.104 - 2.070 USD (previous strong support) - Risk-to-Reward Ratio: Favourable short setup with R:R over 1:3 🛑 Stop-Loss Placement: - Stop-loss is placed above 3.291 USD to protect against a potential breakout continuation. 📉 Profit Target Justification: - The main target is the 2.104 - 2.070 USD range, aligning with a key horizontal support level. - If price breaks lower, further downside toward 1.900 USD could be possible. 📌 Summary - Price is rejecting key resistance inside an ascending channel. - Lower high formation signals potential bearish continuation. - Clear risk-reward ratio makes it a high-probability short setup. - Targeting strong historical support levels for take profit. 🔻 If price reclaims 3.291 USD, the trade setup is invalidated. Otherwise, continued downside is expected.Trade is going well. Take partial profits here at 2.845 as we may see price come up a bit here.Trade closed. Can keep a portion open if you choose depending on your entry. Pull up is a potential. We can look for another short soon.
Who-Is-Caerus

🔍 Market Context: - OP/USDT has broken below an ascending trendline, indicating a potential trend reversal from bullish to bearish. - The price is retesting the broken trendline as resistance, a common pattern before further downside movement. - Recent price action has been bearish, forming lower highs and lower lows. 📊 Trade Entry Criteria: - Entry aligns with a trendline retest rejection, signaling a failed attempt to reclaim the previous uptrend. - Bearish price action confirms sellers stepping in at this level. - The rejection is occurring near a previous support zone, which is now acting as resistance. 🎯 Trade Targets & Risk Management - Entry Price: Around 1.412 - 1.487 USDT - Stop Loss (SL): Above 1.596 USDT (above previous resistance) - Take Profit (TP): 1.084 - 1.074 USDT (previous major support zone) - Risk-to-Reward Ratio: Favorable short setup with R:R over 1:3 🛑 Stop-Loss Placement: - Stop-loss is positioned above 1.596 USDT, ensuring protection against a fake breakout or bullish reversal. 📉 Profit Target Justification: - The main target is the 1.084 - 1.074 USDT range, which aligns with a strong historical support level. - If bearish momentum continues, a potential deeper drop toward 1.000 USDT could be possible. 📌 Summary - Bearish breakdown below key trendline - Retest rejection confirms sellers in control - Clear risk-reward ratio (high probability short setup) - Targets strong historical support levels for take profit 🔻 If price reclaims 1.596 USDT, the trade setup is invalidated, suggesting potential bullish recovery. Otherwise, continued downside is expected.Trade is going well. Take partial profits here at 1.332 as we may see price come up a bit here.Trade closed. Can keep a portion open if you choose depending on your entry.
Disclaimer
Any content and materials included in Sahmeto's website and official communication channels are a compilation of personal opinions and analyses and are not binding. They do not constitute any recommendation for buying, selling, entering or exiting the stock market and cryptocurrency market. Also, all news and analyses included in the website and channels are merely republished information from official and unofficial domestic and foreign sources, and it is obvious that users of the said content are responsible for following up and ensuring the authenticity and accuracy of the materials. Therefore, while disclaiming responsibility, it is declared that the responsibility for any decision-making, action, and potential profit and loss in the capital market and cryptocurrency market lies with the trader.