
Whale_signal
@t_Whale_signal

What symbols does the trader recommend buying?
Purchase History
پیام های تریدر
Filter
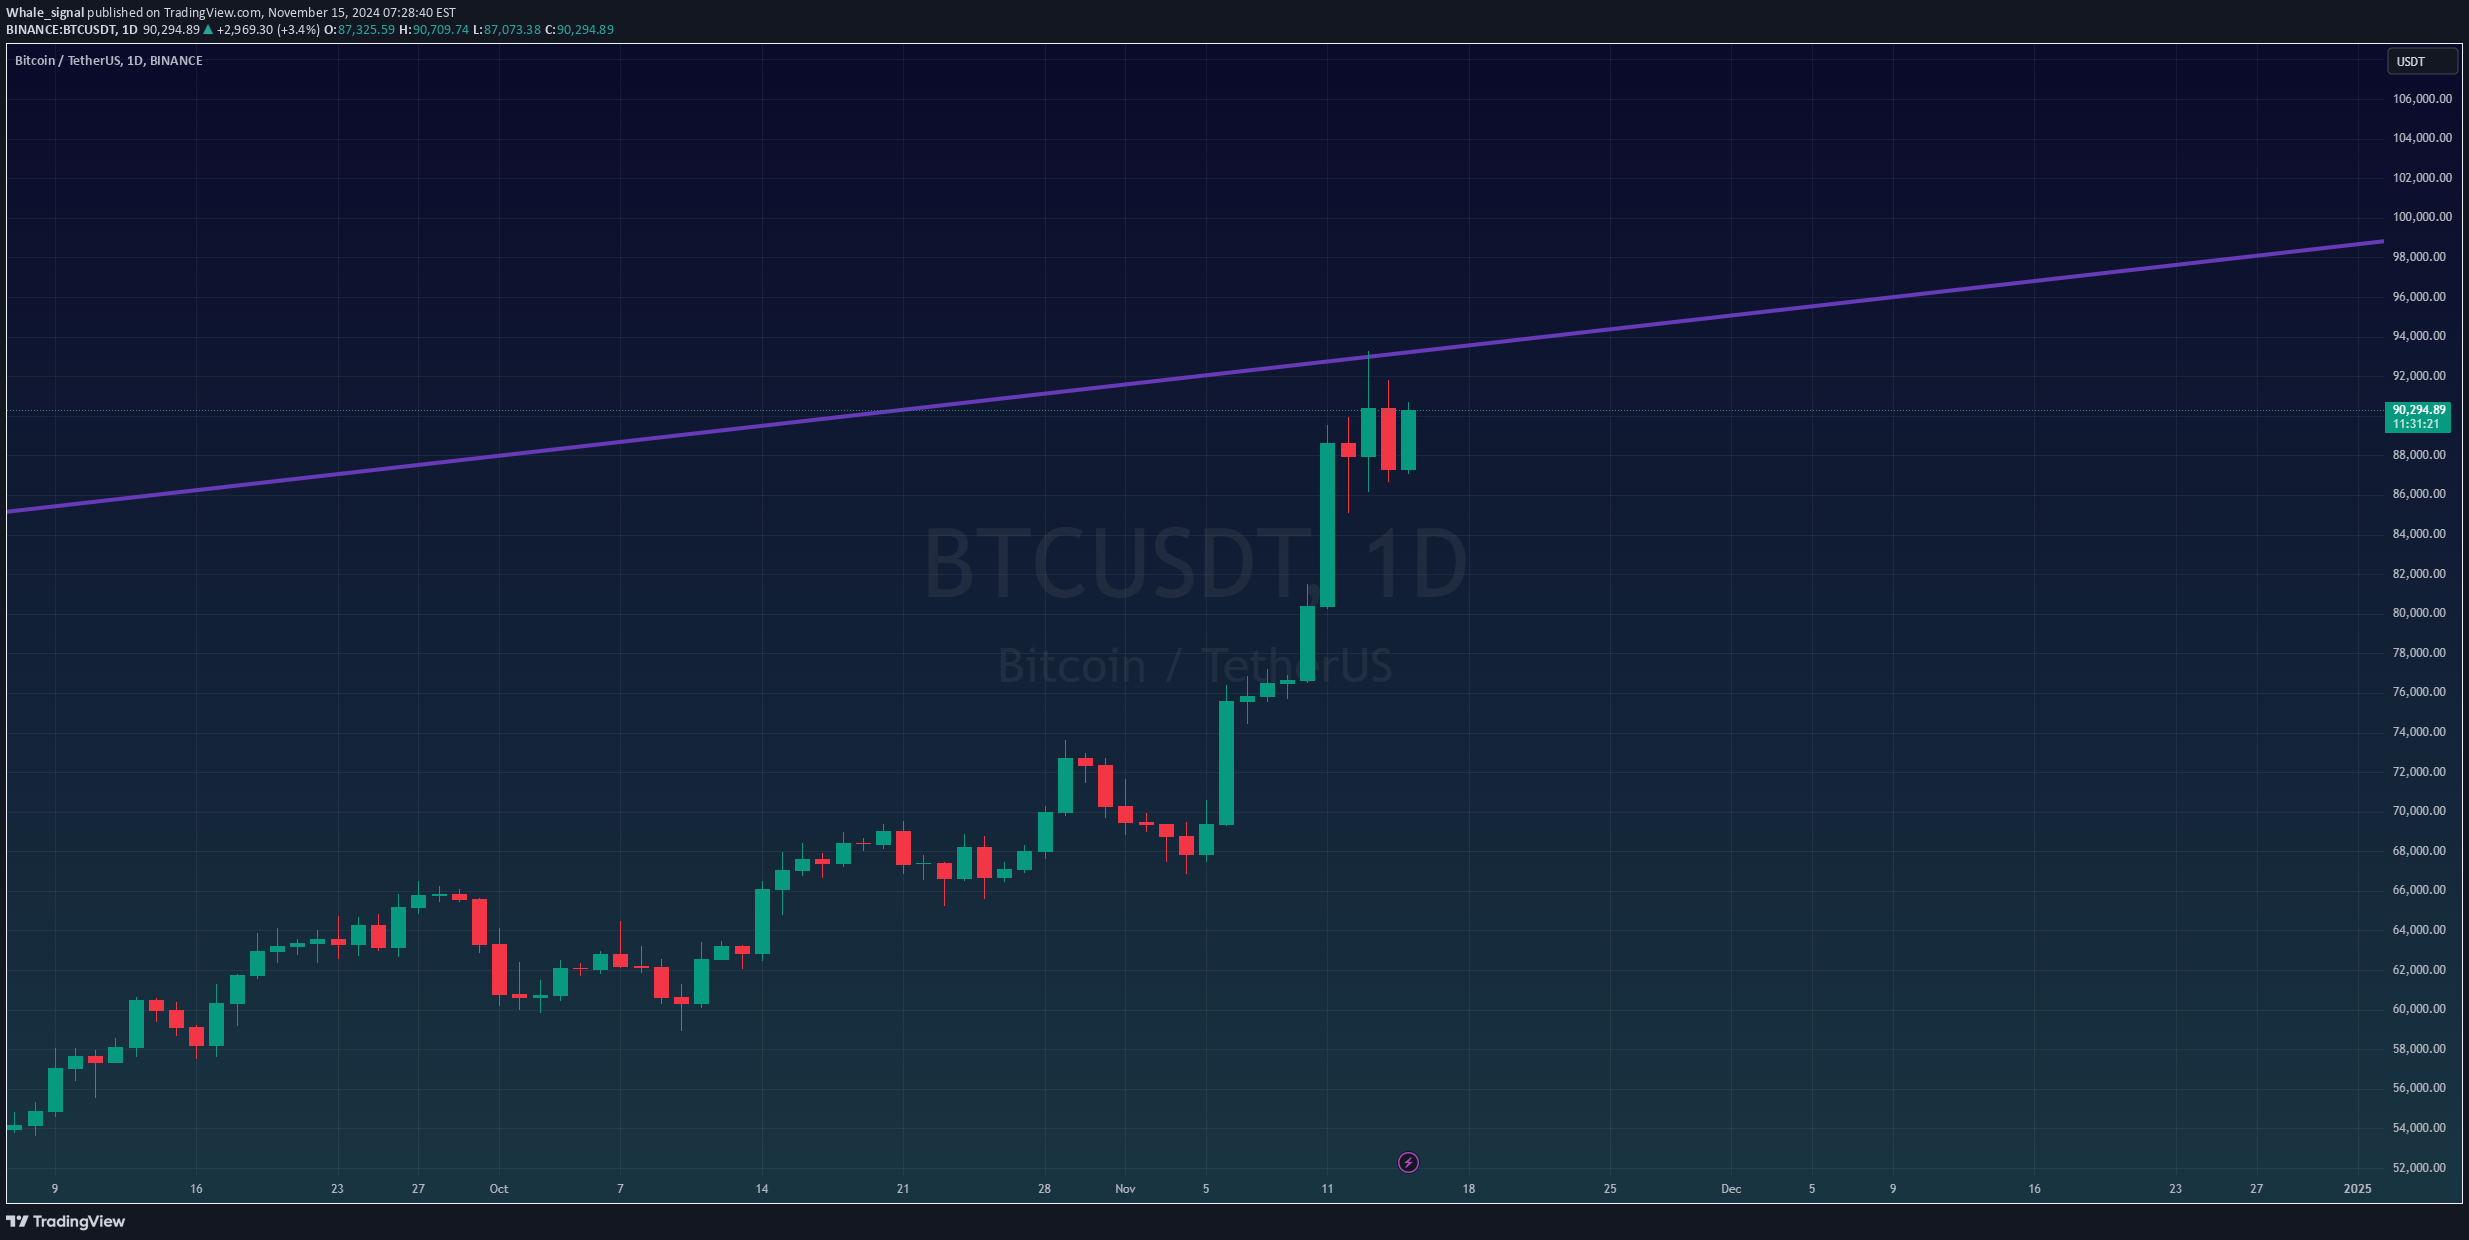
24.11.15 Whale Index (go to 10.5K?)
Hello, I'm Whale Signal
BTCUSDT-1D Whale Indicator Uploads
Currently, the Bitcoin chart continues to be bullish, and of course, the long view is more dominant than the short position
Below are the key analyses and strategies
1. Major Analysis of the Daily Chart
The Purple Whale Indicator: On the current daily chart, the corresponding purple whale indicator could act as a major resistance, but breaking through this segment will likely strengthen market sentiment and buying and make a target above 10K a reality (please check the daily closing form)
If you don't break through the indicators, it's important to timing the buy in the adjustment section
2. Four-Hour Whale Index Analysis
🐳 Whale Indicator - 4H Real-time Chart Sharing (for public use)
kr.tradingview.com/chart/5KYBbLUd/
Purple Whale Indicator: If You Break Through The Purple Whale Indicator And Set To Support, It Looks Like Further Upside
If a strong buy is confirmed, there is a need to leave open the possibility of a surge towards the next target price
3. a strategic proposal
Long Position First: If the bull market continues, it is recommended to see it settle after breaking through the resistance line and strategize for entry
Risk Management: You must set up a breakout price to prepare for uncertainty because the rise has already been too big
Conclusion:
Bitcoin Market Is Bullish Right Now, Whether Whale Indicator Breaks Will Be An Important Inflection Point For Further Rise
I hope you get the best timing through thorough risk management and use of indicators
*I don't share a point of view. It's a personal opinion, and the whale indicator simply points to support and resistance. I hope you guys take a RBI single through the whale indicator in your analysis*
*For more detailed analysis and real-time updates, please check the real-time chart sharing guide link below*
<
11.07 Whale Index (note this section)

Hello, I'm Whale Signal
Bitcoin Continues Bullish Flow After Trump's Recent Reelection Success, Stretching Higher
We'd like to look at RBI from a short-term perspective at our current position
Bitcoin Is Already Up Significantly, But Here's How Long Short-Term Wave Will Continue Based on Two Scenarios
The progress of short-term waves and two approaches
Currently, Bitcoin is uncertain whether the short-term bullish wave, which started at 66.8K, has progressed to wave 5
In this regard, I will divide the following two cases into strategies
1. If the short-term 5th wave has been completed
If the current short-term upward wave is a five-wave finish, we plan to focus on the "purple whale indicator" in the adjustment section
The purple whale indicator overlaps with the Fibonacci 0.382 section of this rising wave, and if the flow defending the section (a bottom-tail type candle or settling flow) is confirmed, we will proceed with the sale from a long perspective
However, in situations where the purple whale index deviates from the purple whale index, if it settles down the purple whale index again rather than from a short perspective, we will explore a long opportunity again in the retest or pressing position
[b2.] Short term wave 5 is in progress
If wave 5 is still in progress, we are expecting resistance in the top white box section
However, breaking through this section also opens up the possibility of a strong further rise
When these resistance boxes are reached, we plan to recheck the short-term flow and set up more specific RBI (if that section comes, we will proceed with the indicator update again)
Based on the fact that Tether Dominance is open to "4.4-4.6", the possibility of a current five-wave progression cannot be ignored
24.11.04 Whale Index (up $2,400!! Was it accurate again??)

Hello, we're Whale Signal
First, let's review the previous analysis
Previously, I uploaded a whale indicator to TradingView and informed you that if Bitcoin is located in a major supporting section, and this section is re-formed into a supporting section, we can expect further upside
As a result, there has been a trend of exactly $2,400 rise since then, and those who have used whale indicators seem to have made a significant return
Congratulations to those who made profits
Since then, the price has fallen again, but a positive profit structure would have been possible if you had set up the anti-profit half-currency well (to secure some profits and stopros)
In addition, we believe whale indicators showed good flow again this time, as the closing bar breakout and retest continued and the short position entry opportunity was provided in the fall breakaway structure
Now I'm going to talk about the current point of view
The current section is once again considered an important support section
If time rod seating is confirmed in this section consistent with where previous whale indicators were formed, entry may be considered when retesting or pressing of the candle body section occurs (personal perspective)
In addition, an upward break through the all-high point segment based on Dow theory is expected to increase the likelihood and reliability of it
However, if you leave the purple whale index again, you should also consider short withdrawal
However, as the U.S. presidential election is scheduled tomorrow, please respond briefly and thoroughly manage the risks
*I don't share a point of view. It's a personal opinion, and the whale indicator simply points to support and resistance. I hope you guys take a RBI single through the whale indicator in your analysis*
*For more detailed analysis and real-time updates, please check the real-time chart sharing guide link below*
<
24. 11.01 Whale Index

Hello, we're Whale Signal
Here's an update and share of today's Bitcoin 1-Hour Whale Indicator
Currently, Bitcoin is located in a very important section
This is because it is the point where the purple whale index was formed and overlapped with the previous sale
It is now likely to be re-formed into an important support, as it has broken through a position that has been constantly resisted
If the buying in this section forms support, it is seen as a position to expect further upside
In the short term, it is considered a period where the downward trend can stop, and we look forward to defending this period well and seeing a rebound
However, if the section deviates, we recommend that you respond with the possibility of further decline in mind
*I don't share a point of view. It's a personal opinion, and the whale indicator simply points to support and resistance. I hope you guys take a RBI single through the whale indicator in your analysis*
*For more detailed analysis and real-time updates, please check the real-time chart sharing guide link below*
<
Whale Indicator ($2300 Revenue Available, Congratulations)

Hello, I'm Whale Signal
Here's a quick recap of the Bitcoin trading ideas I shared in Trading View yesterday
Bitcoin is forming a triangular convergence pattern, and we need to closely monitor whether it breaks through the upper resistance line or deviates from the lower low based on the important sell-off. We've explained that, and we've shared some of the main sell-offs that you must check for that
As a result, Bitcoin broke above the top of the trend, supporting the main resistance stand within the triangle convergence pattern
Following the retest, additional gains were made using the main selling point as a springboard, and the opportunity to realize $2,300 in revenue was provided
One thing that's unfortunate is that if a clearer retest had been made after the breakthrough, more people would have easily earned profits
In fact, some of those who expected a retest missed the opportunity, but those who entered after seeing the breakthrough rise must have made a good profit because they clearly broke through the sale table and closed it immediately
Congratulations to those who responded flexibly as Bitcoin broke through the main selling point and met the rising conditions
<
10.28 Whale Indicator (predicted USD 1200 rise, congratulations)

Hello, I'm Whale Signal
Through the last point of view, you were able to predict a 1,200-dollar rise and a 1,900-dollar rise
We will continue to do our best to analyze trends so that you don't miss useful information that can generate profits despite market volatility
First, let's look back on the last analysis
In the last analysis, we said that the support line of the white whale indicator would be an important defense point, but it continued to rise with a press at the hour mark
There was a very slight departure from the first candle, but the opportunity to buy the retest was again offered within the range of the hand's end, and I told you to keep an eye on the 68.5-69K range if the uptrend continues
We explained that this is because this is a section where there is a possibility of disappointing sales if the head-and-shoulder pattern and Dow theory fail to break through the high point
As a result, Bitcoin has seen a sharp decline, leaving a tail around 68.7K
Those of you who have referenced my analysis have the opportunity to expect a return of about $1,200, and if it has helped you with the sale, I would like to congratulate you from the bottom of my heart
Subsequently, a downward break from the support of the white whale indicator at the one-hour bar after receiving resistance led to a drop of about $1,900 in the next candle retest segment
In a previous article, I mentioned a strategy of maintaining a loss line in the event of a departure from the white whale indicator, implementing some blade and main liquidation, and continuing to hold the remaining volume
For those who have sold under this strategy, it is believed that it would have been possible to liquidate the partial day and the main account
However, if further guidance had been made on the support section below, it would have been more profitable
There were some regrets due to the long bottom tail, but as a result, I think we shared a good trading strategy
Let's move on to today's analysis
⚠️Btcusdt - 1H
Bitcoin has been seen going sideways over the weekend in a breathtaking segment
Now, a week before the U.S. presidential election, there is a possibility that there will be a move to confirm the direction in the market
Currently, Bitcoin appears to be forming a convergence pattern
If this convergence is correct that it is progressing, we need to look closely at whether it breaks through the previous high or if it deviates from the previous low or if it can support it without
In particular, if the upper resistance trendline and previous high breakthrough are confirmed, more attention will be paid to the important "core interval" in the whale indicator
This is because we believe that the key section can be an important gateway to open up new market trends in the future
In addition, we will carefully watch for the breakaway from the low, as trading volume has been on the defensive lately, whether it is triangular convergence or not
If the trend continues to break lows in Dow theory, we need to focus on the sell-off segments below
The whale surface area plans to respond flexibly based on specific trend lines in this situation
(I've shared important sales tables that I must check today, so please check them out when you have time.)
*I don't share a point of view. It's a personal opinion, and the whale indicator simply points to support and resistance. I hope you guys take a RBI single through the whale indicator in your analysis*
*For more detailed analysis and real-time updates, please check the real-time chart sharing guide link below*
<
24.10.25 Whale Index (Congratulations on the $1200 rise)

Hello, we're Whale Signal
Analyzing Bitcoin's 1-hour chart yesterday, I told you that you need to observe it carefully in the retest segment when it settles on the white whale indicator
In fact, since the exact retest on the white whale indicator, we've seen a rise of more than $1,200
Congratulations to those who earned profits
My current view is that once again, the support line of the white whale indicator should be an important defense line. (Please note that the white whale indicator is updated in this uploaded chart.)
To sustain Bitcoin's current uptrend, we believe it's essential to keep the recent breakthrough sales range
If further rise continues, the movement in the 68.5K to 69K section becomes important again
This is the position where the formation of the head-and-shoulder pattern can be expected in the section,
This is due to the possibility of a disappointment sale opening if it fails to break through the highs under Dow theory
If the upward breakthrough fails due to continuous resistance in the 68.5K to 69K section, this section may become the entry point for a common short position. In this case, we plan to clearly establish a loss line, sell some of the supplies, and proceed with the main liquidation at the same time, and to hold the remaining supplies
However, if we break through the 68.5K~69K section and settle down (I think we should pay close attention to the 4 hours and the daily salary rather than the 1 hour salary), we plan to open up a scenario of further rise
If we continue to deviate from the white whale indicator at the bottom, we will need to closely monitor the overall situation of the market, but in this case, as mentioned earlier, we will maintain a strategy of implementing some blade and main liquidation while maintaining the loss line and holding the remaining volume
The above strategy is a risk management plan that can respond flexibly to market volatility and aims for a systematic approach based on critical resistance and support lines
It's unclear whether the market will move sideways this weekend or there will be high volatility, but we need to focus on important resistance and support segments ahead of the U.S. presidential election
*I don't share a point of view. It's a personal opinion, and the whale indicator simply points to support and resistance. I hope you guys take a RBI single through the whale indicator in your analysis*
*For more detailed analysis and real-time updates, please check the real-time chart sharing guide link below*
<
24.10.24 Whale Index

Hello, I'm Whale Signal
Referring to the purple whale indicator in the last four-hour Bitcoin chart analysis, the upper tail resistance occurred several times and eventually failed to break through, accelerating the downtrend
As a result, Bitcoin saw a huge drop of about $2,300
At the time, I mentioned the possibility of going down to the 64K to 62K section in case of further decline, but unfortunately, it has not reached that section and is showing an upward trend again
However, the $2,300 drop was enough to generate revenue from the next day, and if you've used whale indicators to realize profits, congratulations
Now, it's time to pay attention to the Bitcoin hour chart
That's why we believe an important position is being formed right now
1. This is because the bottom tail was formed along with the trading volume where the sales overlapped during the recent downtrend. This can be interpreted as a sign of the market's willingness to rise
2. Since the trap, it has re-entered the market and continues its short-term upward trend, so it is necessary to carefully examine whether this trend will continue without breaking it
3. It also coincides with the Fibonacci 0.382 interval for the recent uptrend, which can expect a stronger rebound
In particular, it is important to closely observe the movement in the retest section if it settles on the white whale surface on an hour stick basis
Since it is a position that has been resisted several times, we cannot rule out the possibility that if it continues its uptrend by breaking through the highs on the white whale index and Dow theory, it will open up further upside sections
Conversely, if we don't consistently break through the white whale indicator and continue to decline further, we'll need to closely monitor market conditions once again and devise a more cautious trading strategy
I hope you will respond carefully to the Bitcoin movement in the future and wish you a successful sale
*I don't share a point of view. It's a personal opinion, and the whale indicator simply points to support and resistance. I hope you guys take a RBI single through the whale indicator in your analysis*
*For more detailed analysis and real-time updates, please check the real-time chart sharing guide link below*
<
24.10.22 Whale Index

Hello, I'm Whale Signal
Important Purple Whale Indicator Formed In Bitcoin's 4-Hour Bar Currently, Market Movements Are Active, Updates Quickly
The purple whale indicator also overlaps with the previous sale, which could serve as an important support and resistance for the market
Also, considering the bottom tail that occurred in the downtrend this morning, the divergence has appeared at the 1-hour bar
While further declines in this segment could accelerate the downtrend, a resurgence above the whale indicator could be seen as a positive turnaround sign
If the whale indicator recovers from the four-hour bar and continues its uptrend, the first short-term target segment could be set at 68.1k to 68.4k
On the other hand, if further departures continue, the possibility of a drop to the 64k-62k range should also be considered
Therefore, keep a close eye on the purple whale surface section and plan your response strategies carefully
I don't share views
The whale indicator simply points to support and resistance
I hope you can take the RBI through the whale index in your analysis
<
24.10.14 Whale Index

Hello, I'm Whale Signal Following yesterday's analysis, I recommended that you check the early 61.8K to 62K sections based on the daily wage in this morning's update. I explained that it's still moving in the upper section In addition, the purple whale indicator at the top is likely to act as a resistance line in the event of a full-high point breakthrough, and if a strong breakthrough is made, caution is needed for the subsequent pressed section Since the time and daily closing shapes are important for whale indicators, checking the purple whale indicators at the top after the closing bars will be a more stable trading strategy For those of you who entered without checking the closing bar, I think you lost about 400 dollars. I'm sorry about that! I'll share the analysis quickly from now on The purple whale surface section, currently located at the top, is an important position that overlaps with the previous sale If the upward flow continues based on this section, we believe we can expect further upward Conversely, in the event of a breakaway and further fall, we may also consider a flow to retest the top section of the previous drop channel So, from an uptrend point of view, I think at least the purple whale surface section located in the middle should be maintained as a support line to protect If this section collapses and enters the downtrend channel again, we plan to check the direction of the market more carefully and then go on sale Under these market conditions, we share notable support, resistance, and inflection sections through whale indicators, so please refer to them The whale indicator simply points to support and resistance I hope you can take the RBI through the whale index in your analysis ***whale surface intensity*** Purple>>>Orange>>>White (Purple indicators are the strongest) More detailed analysis and continuous updates will be conducted through real-time chart sharing below
Disclaimer
Any content and materials included in Sahmeto's website and official communication channels are a compilation of personal opinions and analyses and are not binding. They do not constitute any recommendation for buying, selling, entering or exiting the stock market and cryptocurrency market. Also, all news and analyses included in the website and channels are merely republished information from official and unofficial domestic and foreign sources, and it is obvious that users of the said content are responsible for following up and ensuring the authenticity and accuracy of the materials. Therefore, while disclaiming responsibility, it is declared that the responsibility for any decision-making, action, and potential profit and loss in the capital market and cryptocurrency market lies with the trader.