
Wavervanir_International_LLC
@t_Wavervanir_International_LLC

What symbols does the trader recommend buying?
Purchase History
پیام های تریدر
Filter
Wavervanir_International_LLC
اصلاح موج ABC بیت کوین: آیا منتظر سقوط تا ۴۰ هزار دلار باشیم؟
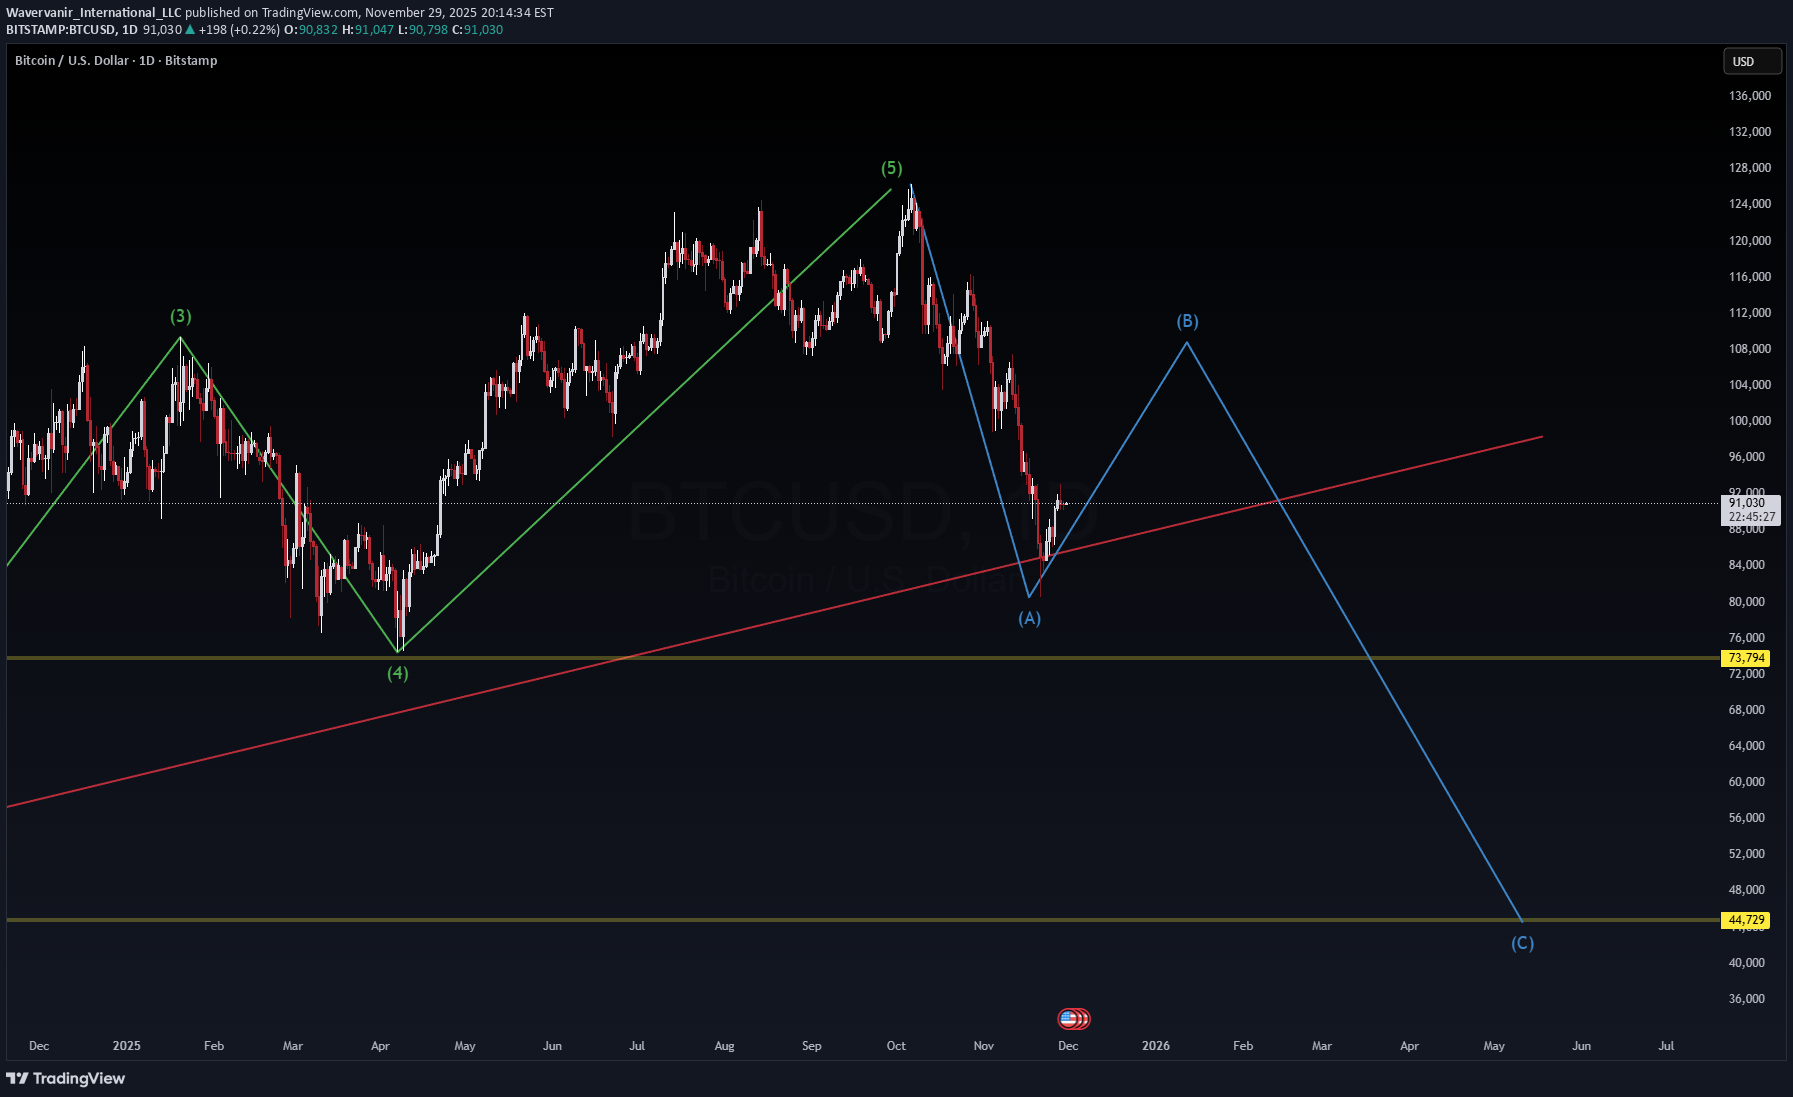
Watching BTC USD, Not attractive until 40K range. That's all I have to say about this chart. Looks like ABC correction is also coming.
Wavervanir_International_LLC
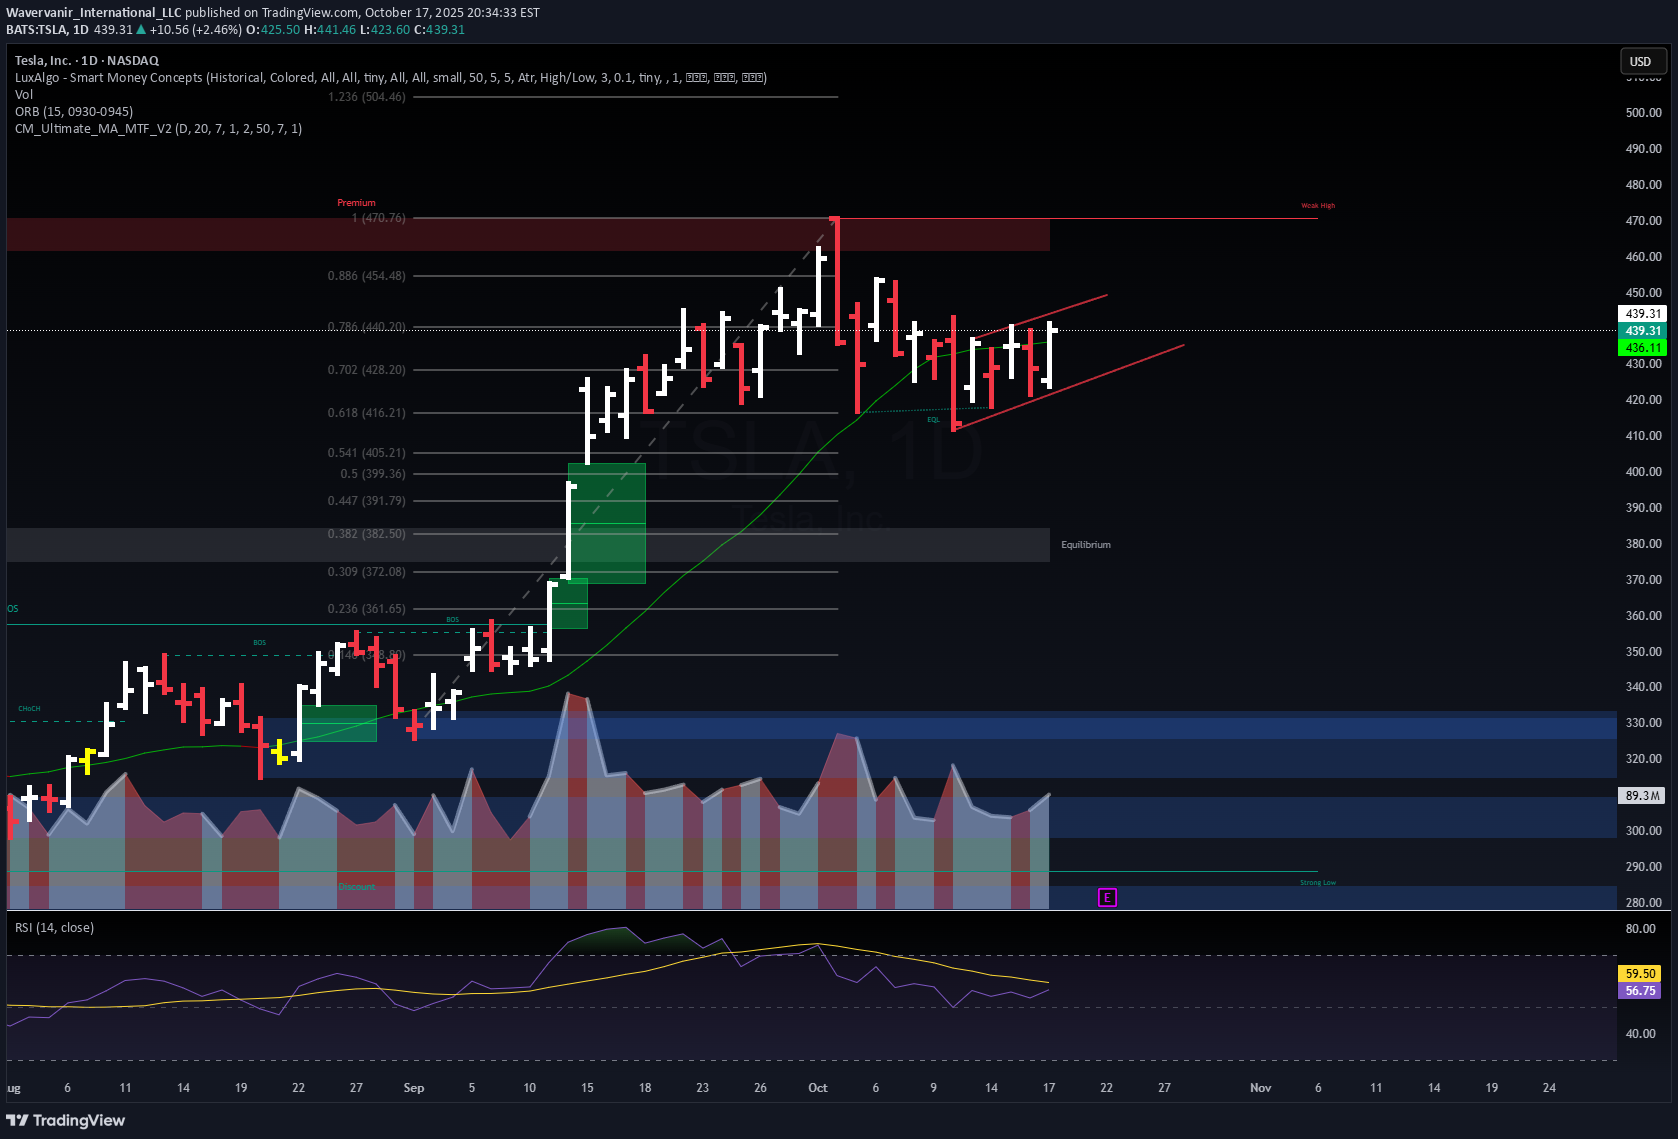
تحلیل روزانه تسلا (TSLA): آیا سقوط ادامه دارد یا زمان خرید جدید فرا رسیده است؟
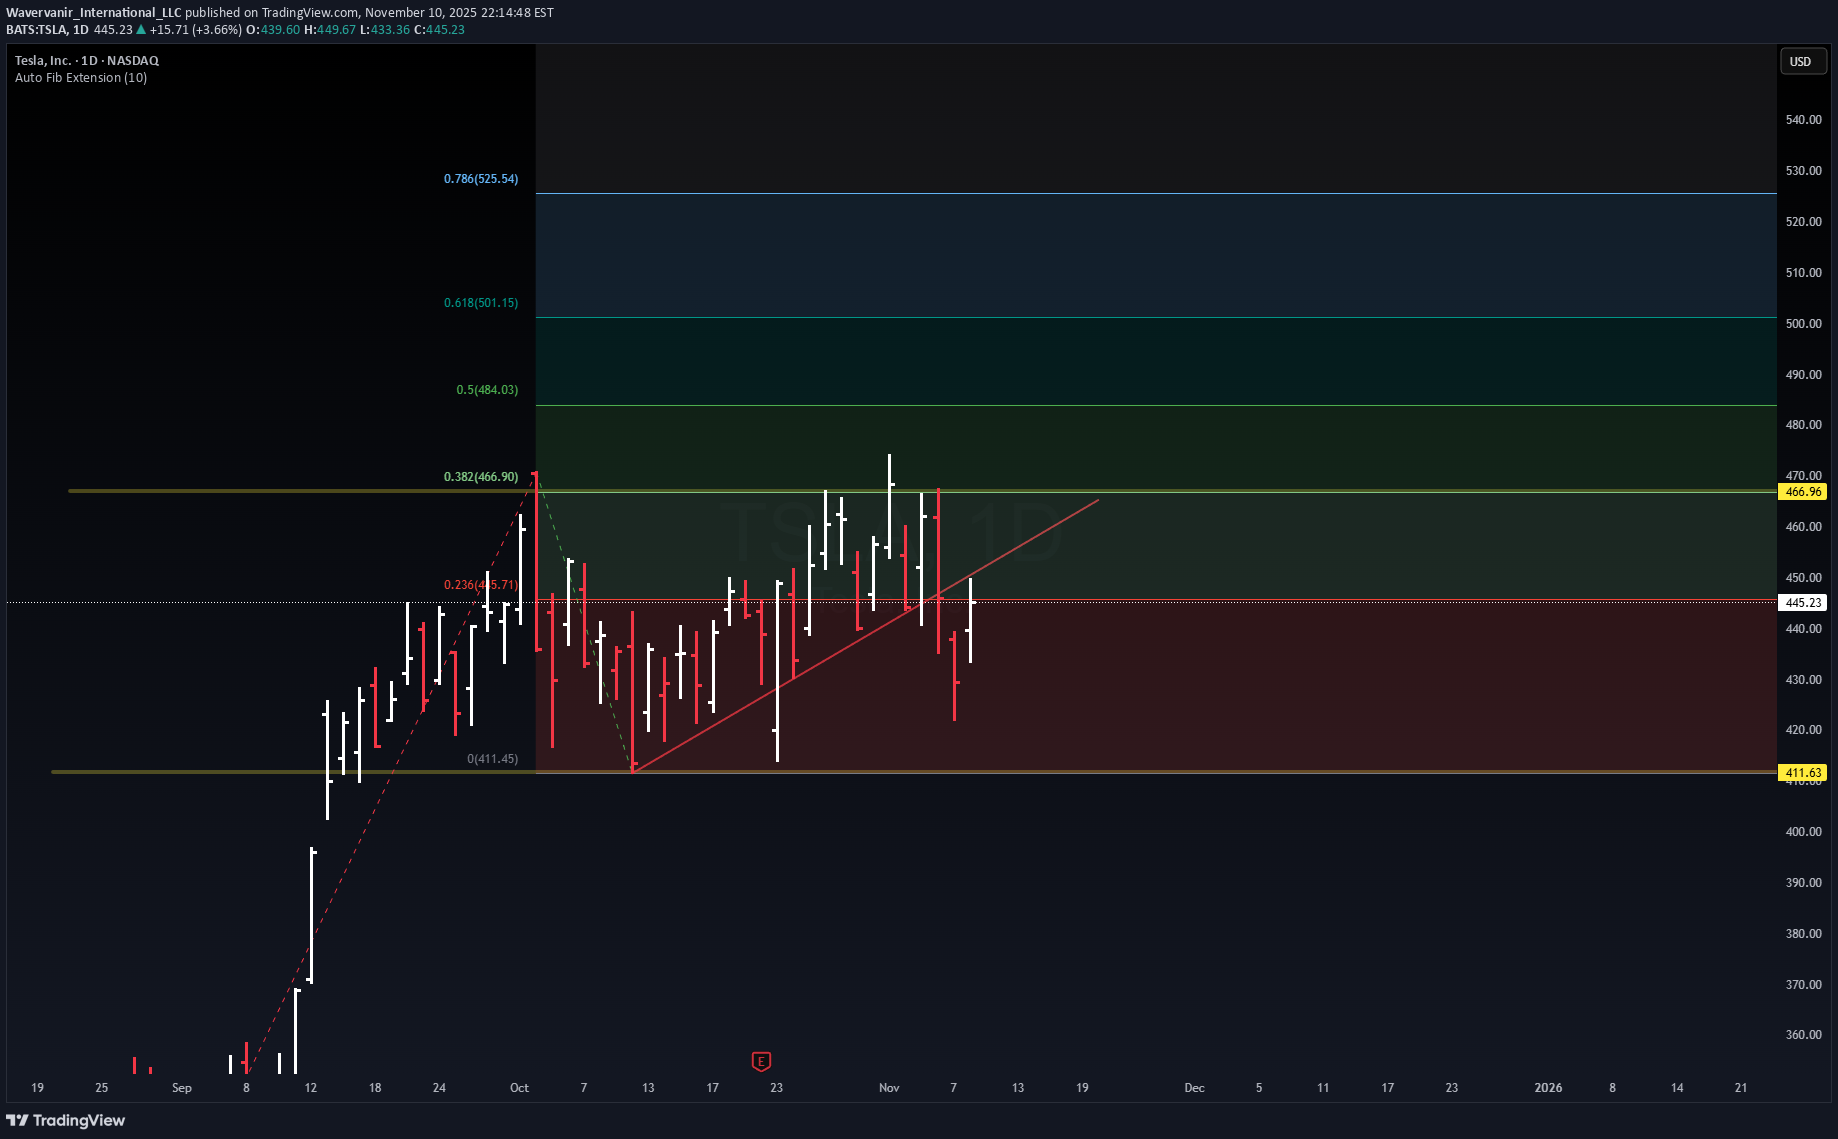
⚡ WaverVanir Edge – TSLA Daily Outlook TSLA rejected from the 0.382 Fib ($466.9) and is hovering near $445, showing short-term weakness after an extended rally. Auto-Fib map reveals liquidity clusters: 🟢 Premium Zones: $484 → $501 → $525 (target expansion levels) 🔴 Discount Zone: $411.6 major support ⚖️ Current equilibrium around $445 — consolidation before directional break. WaverVanir DSS: Bearish divergence (−14% 30-day projection) Institutional Model: Bullish rebound (+9% target → $485.6) Edge Consensus: ⚠️ Range compression — volatility pocket between $411 and $466. 🌍 Macro & Catalysts ⚙️ FSD/AI expansion and Energy storage growth remain medium-term bullish 💰 Margins still under pressure amid price cuts & China competition 🏦 Fed tone mildly dovish → liquidity supportive, but yield volatility persists 🔋 Watch raw material cost trends (lithium, nickel) into Q1-2026 Base Path (WaverVanir Scenario): Pullback → $420–$411 → re-accumulation → breakout >$466 to retest $484 “When volatility converges, conviction breaks. Patience over bias.” #TSLA #WaverVanir #VolanXDSS #Fibonacci #SmartMoneyConcepts #AITrading #Macro #ElonMusk #StockMarket #RiskOn
Wavervanir_International_LLC
تسلا (TSLA): آیا 450 دلار خط قرمز خرسهاست؟ نقشه فروش آماده شد!
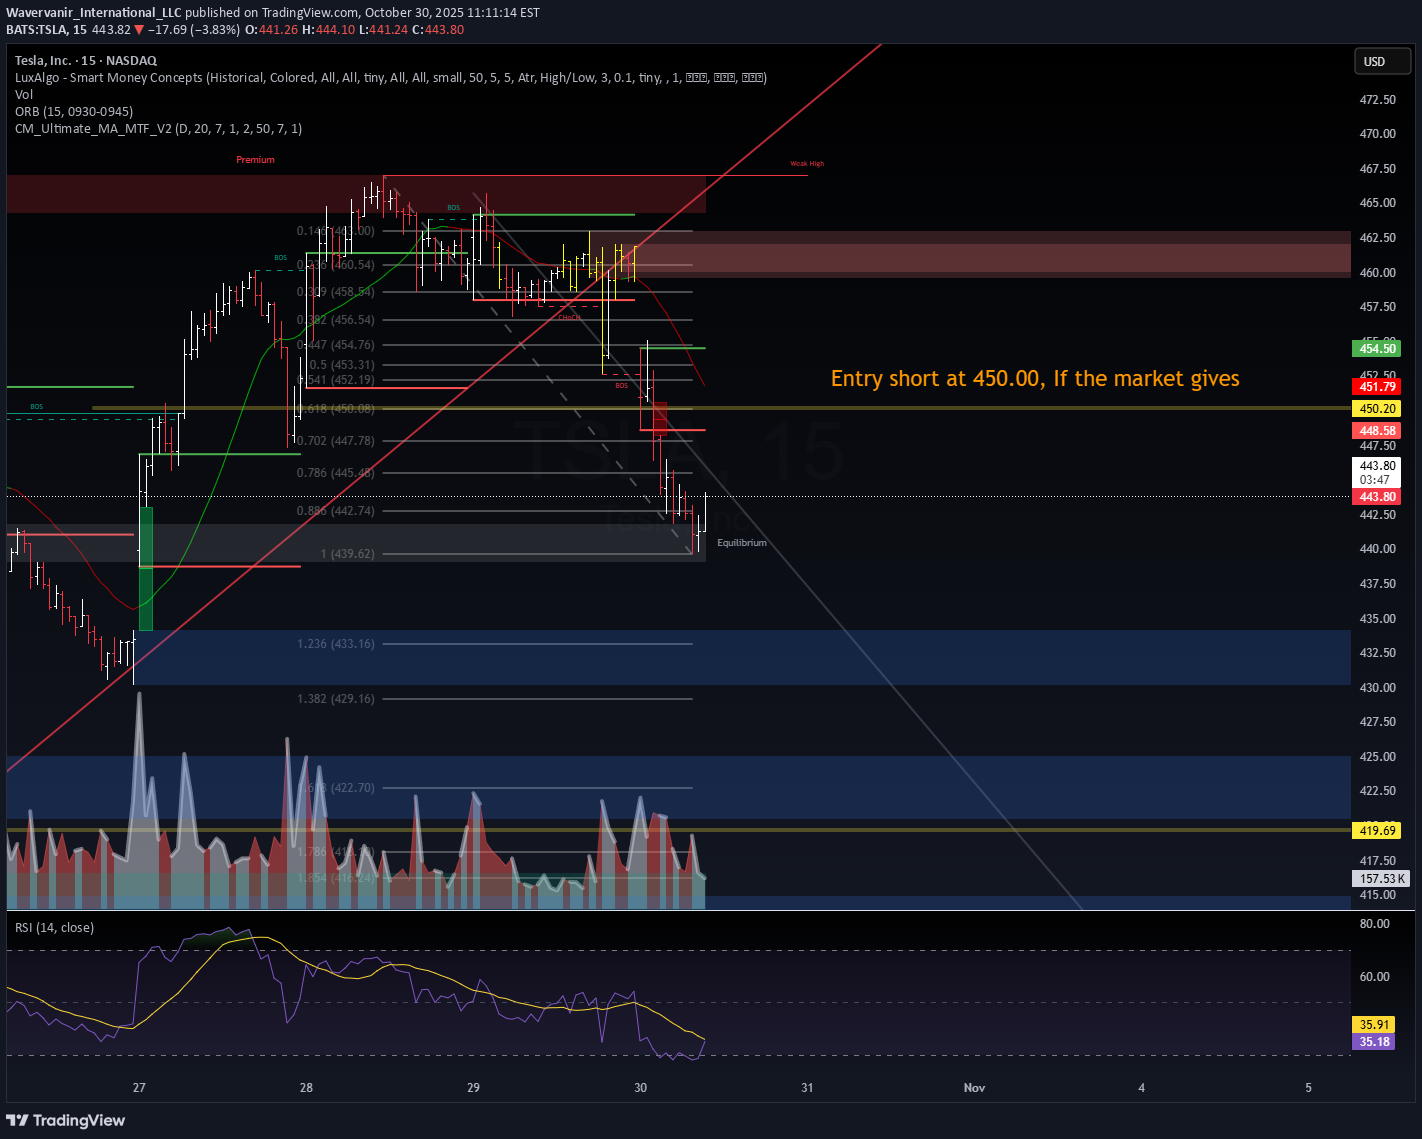
⚙️ TSLA | Short Setup Loading — 450 is the Line in the Sand Tesla continues its controlled descent after rejecting the weak high at 465–470. Price retraced into the 0.786 Fib (≈ 445) zone, finding short-term equilibrium before the next leg. 📊 VolanX DSS Technical Outlook (15m): Structure confirms bearish displacement with multiple CHoCH breaks. Retrace zone: 447 → 450 = ideal short re-entry if market allows. Target zones: 433 → 420 → 419.69 (liquidity shelf). RSI = 35 → momentum favors continuation; no confirmed divergence yet. Volume dropping into equilibrium = possible redistribution phase. 🎯 Trade Plan: Entry short @ 450.00 if market gives. Maintain stop above 452; scale out near 433–420. VolanX Liquidity-Reversal-Guard (LRG) stays inactive until RSI divergence appears. Macro Context (Oct 30 2025): Fed tone = hawkish → yield = 4.10 %. Risk assets fading post-earnings; AI and EV names seeing capital rotation. TSLA tracking QQQ correlation ≈ 0.83 → expect synchronized intraday volatility. VolanX DSS Bias: 🟥 Bear 60 % 🟨 Neutral 25 % 🟩 Bull 15 % “450 is the battlefield — equilibrium decides who walks away.” #TSLA #WaverVanir #VolanX #SmartMoney #Liquidity #Macro #Fed #AITrading #SPY #QQQ #Tesla #ShortSetup
Wavervanir_International_LLC
لحظه سرنوشتساز اتریوم: منطقه فشردهسازی نقدینگی و پیشبینی صعود به 4200 دلار!
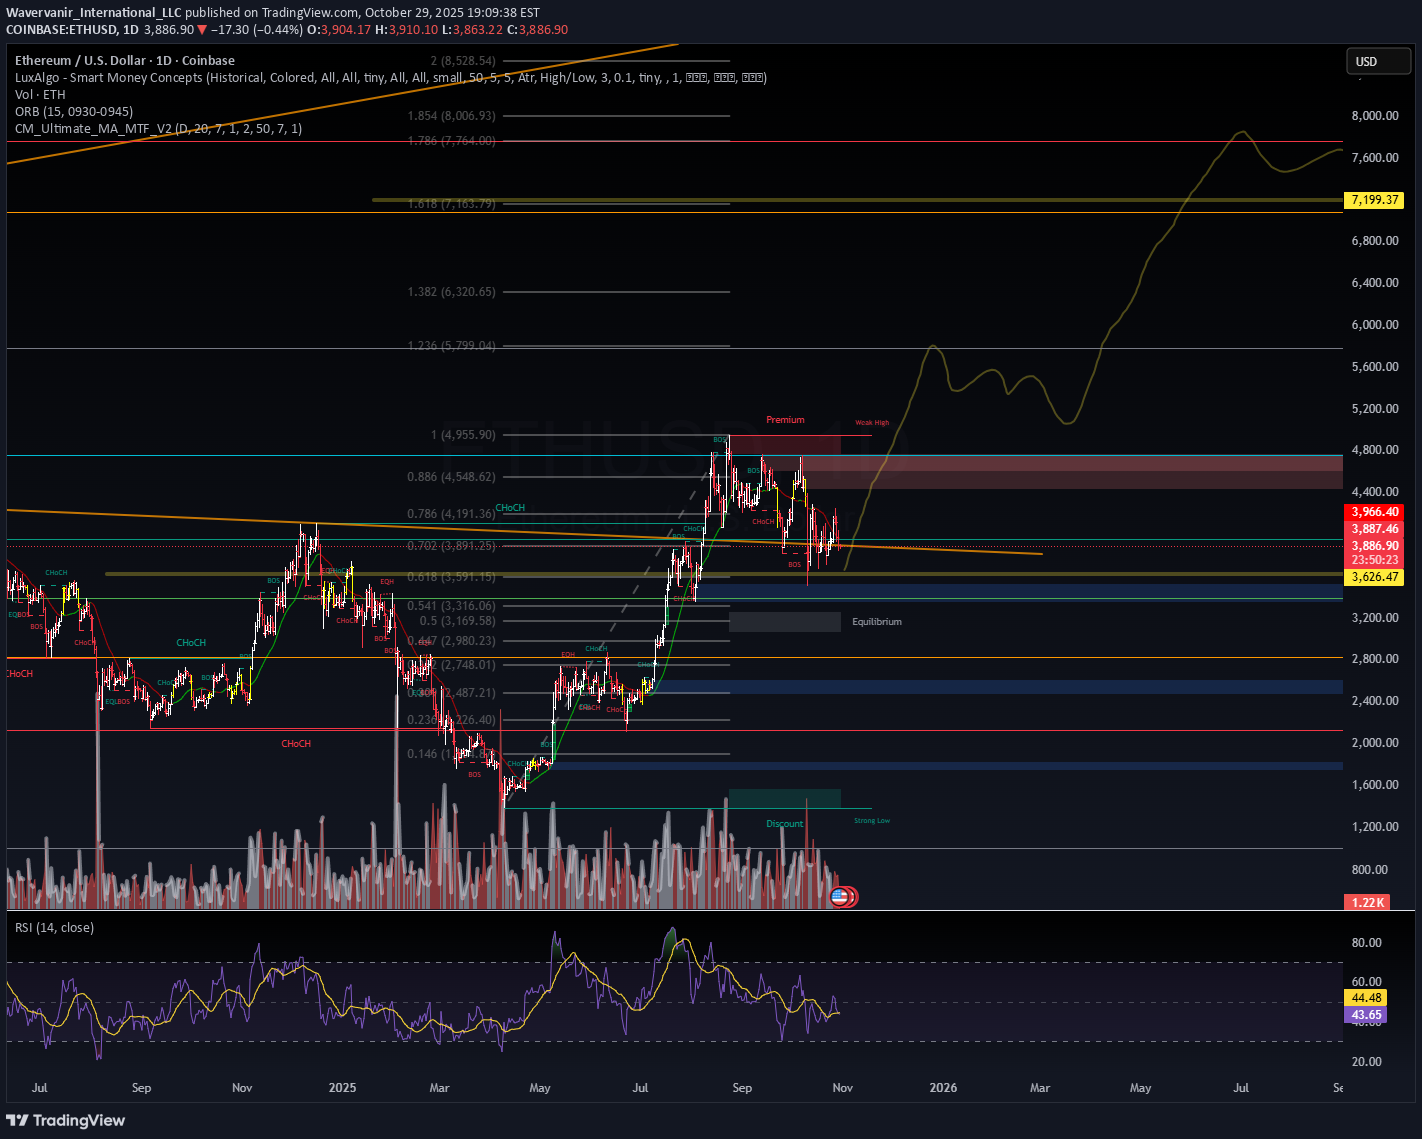
⚙️ ETHUSD | Make or Break Moment 💥 VolanX DSS | Liquidity Compression Zone It’s overdue for a move. The Ethereum ( ETH ) structure has coiled long enough — this is the make-or-break zone where conviction meets volatility. 💰 Sellers selling. Buyers buying. 📈 Range is tightening. The next candle decides who wins. 🧠 VolanX DSS liquidity model flags equilibrium pressure building — a breakout could trigger a cascade toward $3.9K–$4.2K if bulls absorb remaining sell walls. 📊 Bias: Neutral → Bullish if structure flips above $3,350 ⚠️ Invalidation: Weekly close under $3,050 #ETH #Ethereum #Crypto #VolanX #SmartMoneyConcepts #Liquidity #MakeOrBreak #DeFi #Altcoins #CryptoTraders #MarketEdge #BTC #ETHUSD
Wavervanir_International_LLC
سقوط حساب کاربری: درسهای تلخ از بازی بقا در تریدینگ (TSLA)
💥 Trading Is a Game of Survival TSLA blew up my account — I’ll be completely honest about that. It hurts, but it also teaches. Every great trader has been here once. I fund my account every two months, which means I won’t be trading until next month. That’s fine — I’m using this reset to rebuild cash flow and strengthen my system. I promise to come back stronger, with cash in hand, discipline sharpened, and focus doubled. The goal isn’t to win once — it’s to stay in the game long enough to master it. This isn’t the end. It’s just a reset. #Trading #Discipline #RiskManagement #Comeback #TSLA #WaverVanir #VolanX
Wavervanir_International_LLC
تحلیل و آمادهسازی معامله روزانه تسلا (TSLA): شانس سود یا خروج سریع؟
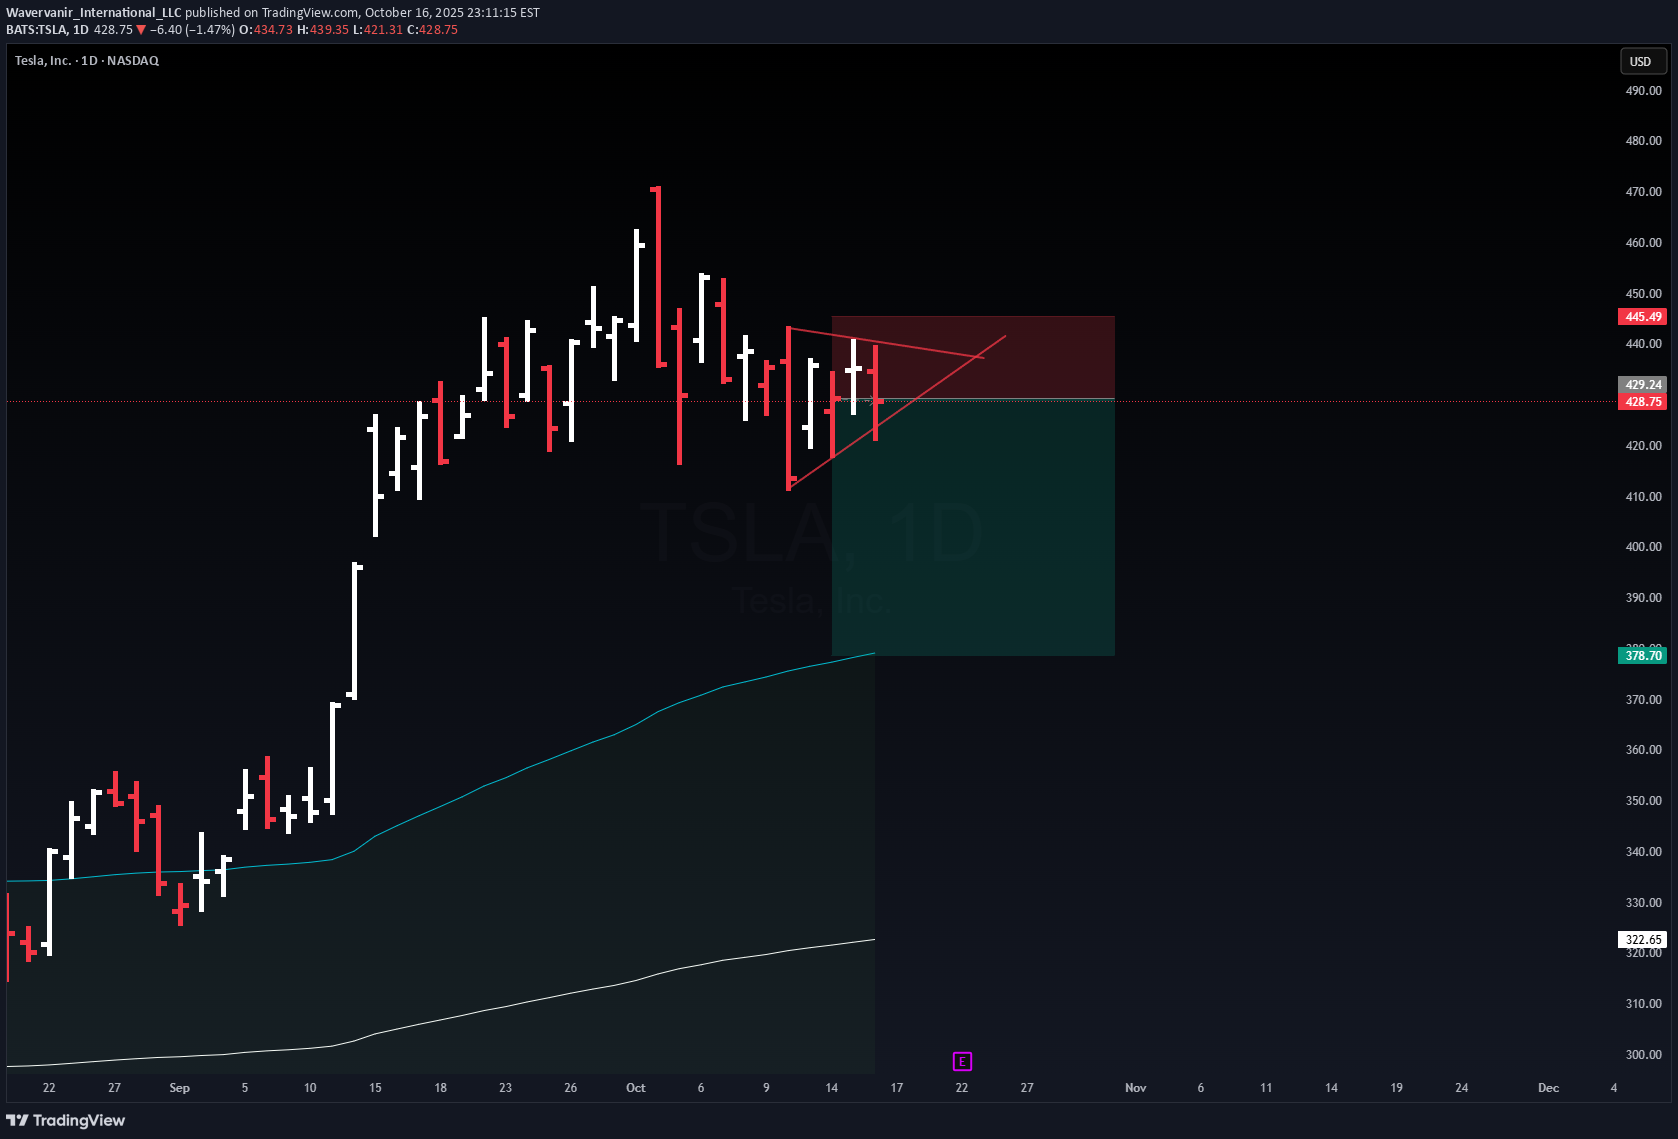
Just Mapping the R/R for my trade. Let's see if we get stopped out or $$$$
Wavervanir_International_LLC
پیشبینی موج الیوت تسلا ۲۰۲۵-۲۰۲۶: آیا اصلاح ۳۸۰ دلاری در راه است؟
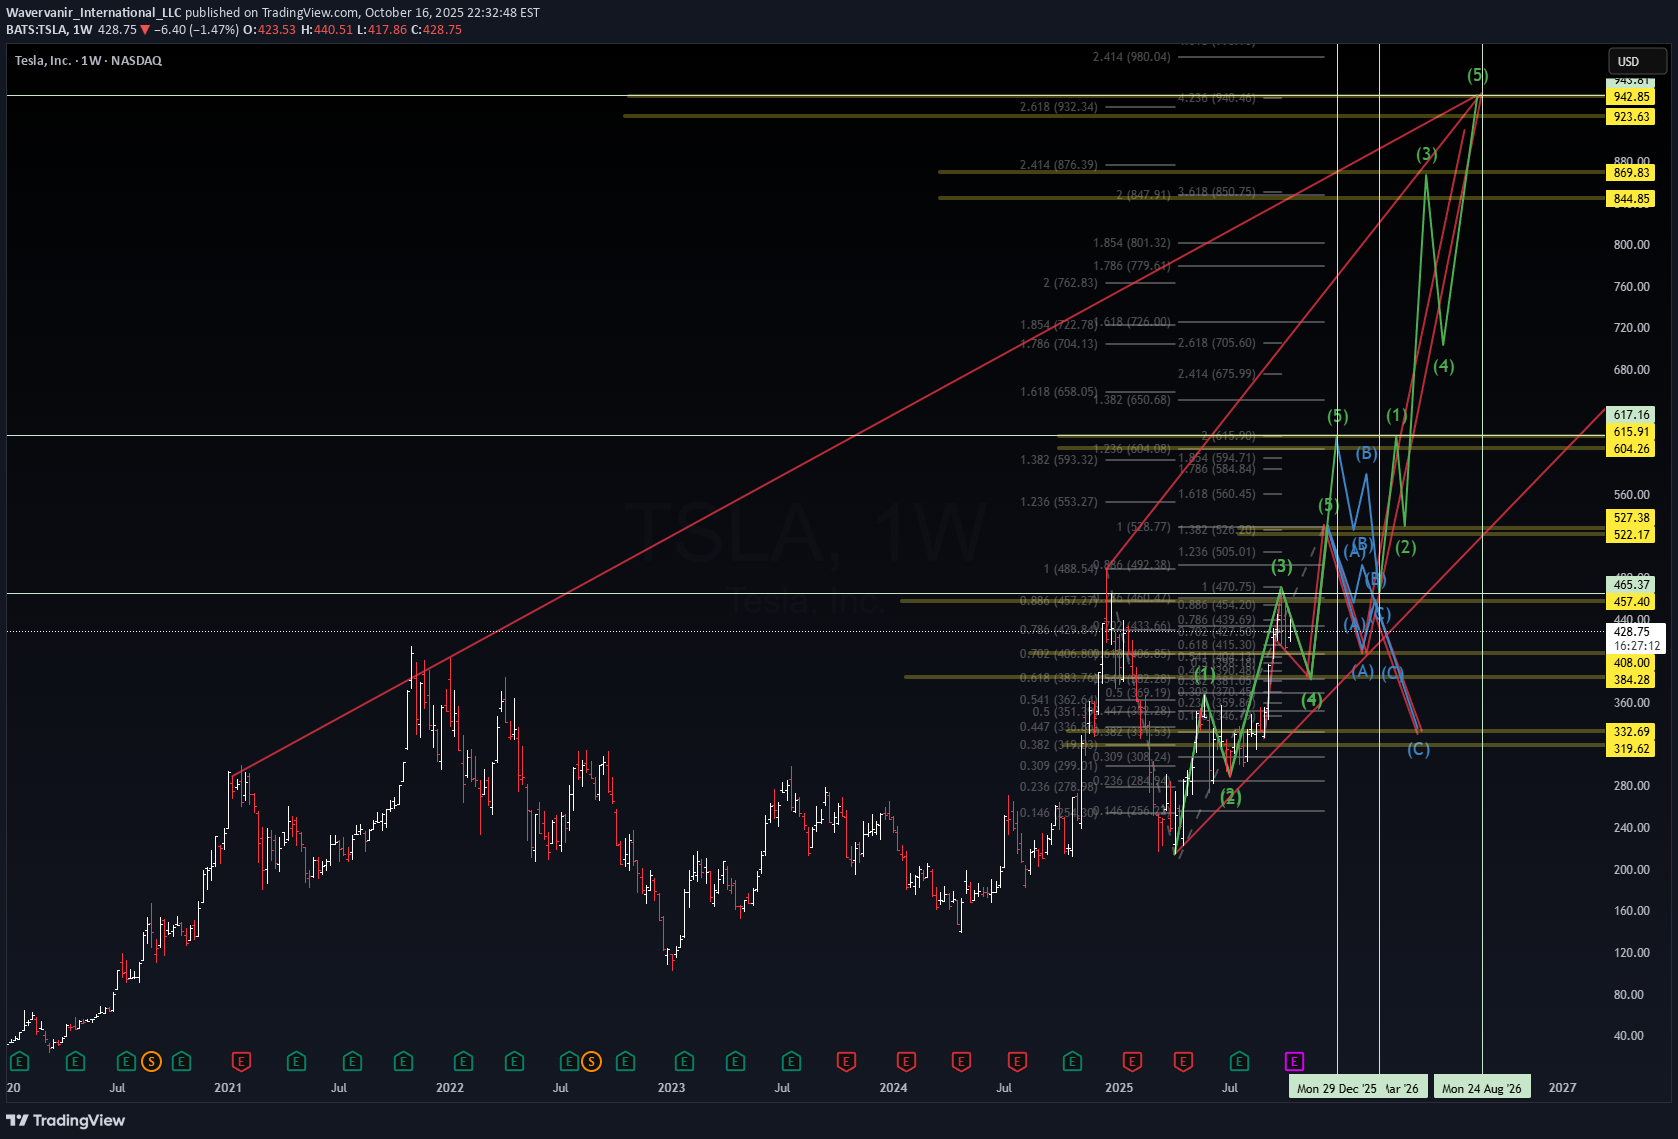
🔮 TSLA | Medium-Term Elliott Wave Outlook (2025–2026) Price action shows a mature 5-wave structure approaching completion. The next probable phase is a corrective ABC retracement before a new expansion leg begins. 🧭 Base Case (Most Probable ~60%) End of current impulse around $527–$540 Correction to $380–$400 region (Wave A–B–C) Mid-to-long-term expansion toward $615 → $705 → $869+ by late 2026 ⚙️ Technical & Macro Confluence RSI + volume divergence confirming wave exhaustion Macro liquidity compression aligns with corrective phase Institutional demand re-entry near $395–$400 zone Fibonacci & structure symmetry consistent with this projection 📊 Bias: Short-term bearish → Medium-term accumulation → Long-term bullish. 📅 Cycle Horizon: 2025–2026 “Correction isn’t collapse — it’s the reload before expansion.” #TSLA #ElliottWave #Macro #VolanXDSS #WaverVanir
Wavervanir_International_LLC
پیشبینی تکاندهنده تسلا تا ۲۰۲۶: راز ساختار موجها و سقوط احتمالی!
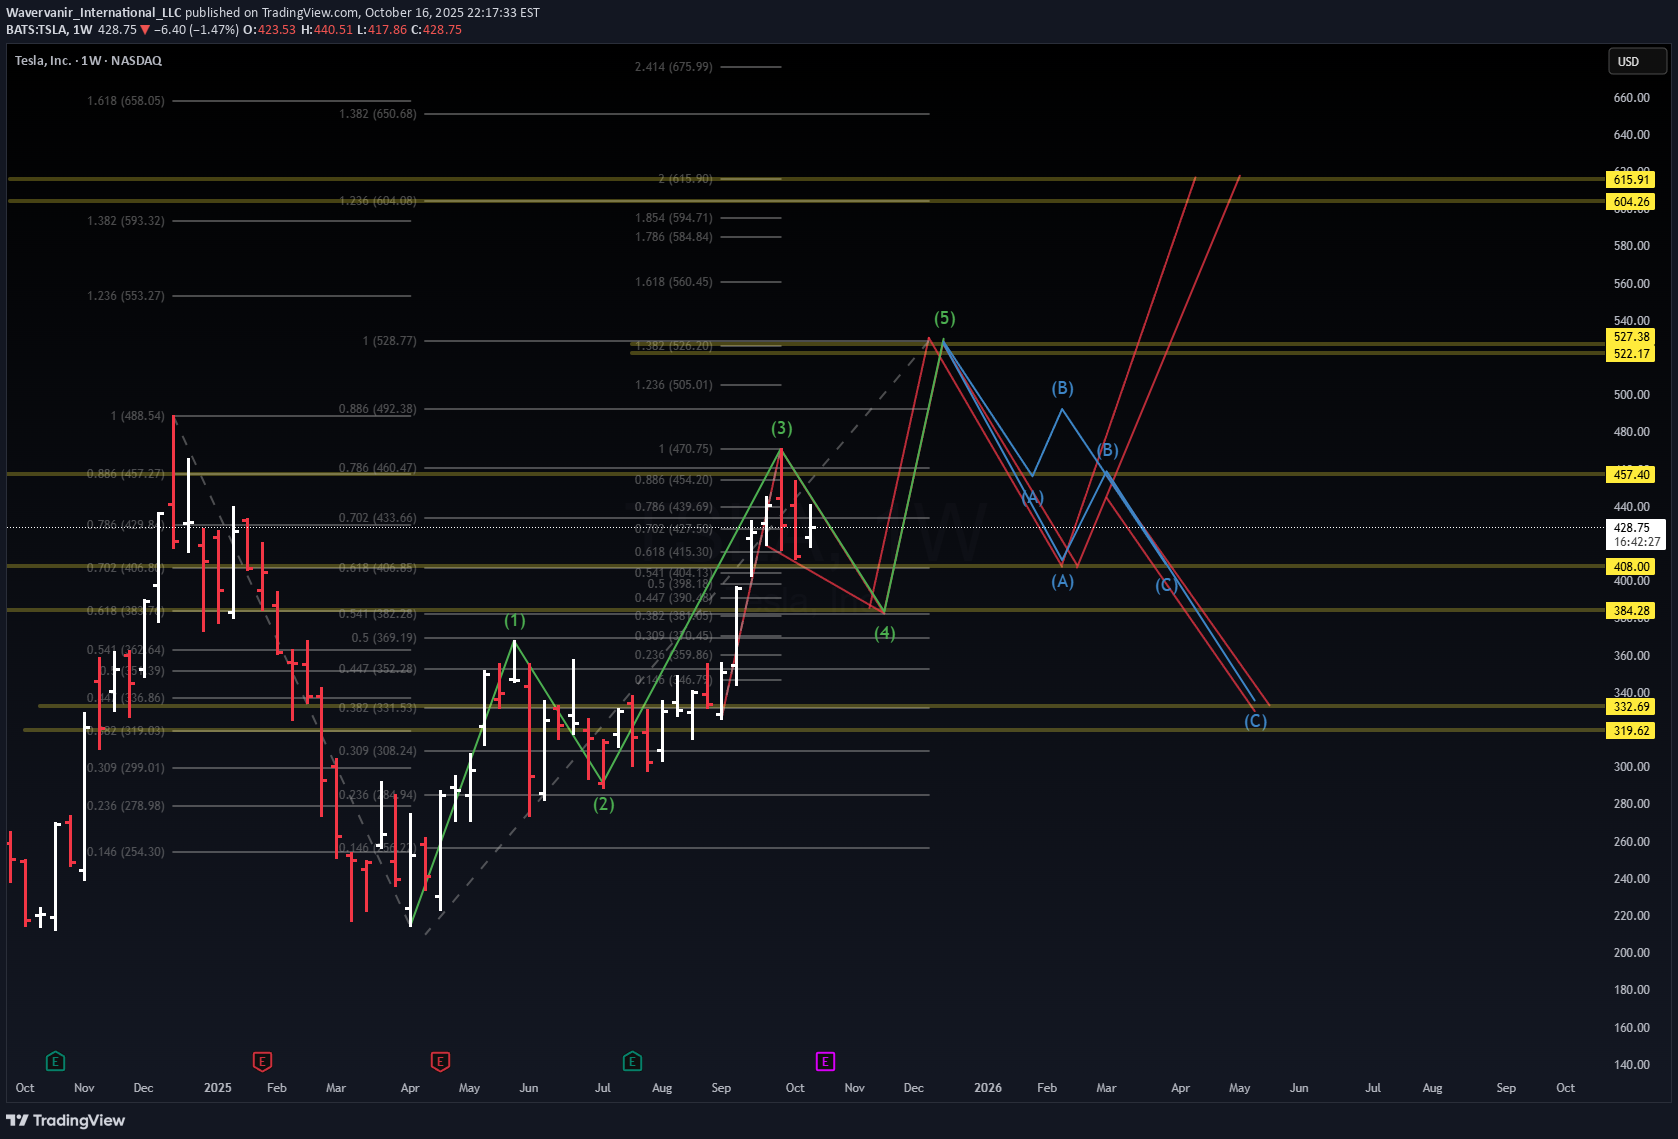
👇 🔮 TSLA | Wave Count Outlook: 2025–2026 Projection The larger structure is forming a clean Elliott Wave sequence, suggesting a potential top near the completion of Wave (5) before a corrective phase unfolds. 🧩 Structure Overview: Primary impulse appears complete between $527–$540 Corrective phase (ABC) projected toward $384 → $332 → $319 If confirmed, this would align with the macro liquidity contraction and potential market re-pricing post-Fed actions 🔍 Technical Confluence: Wave (5) targets align with 1.236–1.618 Fibonacci extensions RSI divergence already forming — early weakness Volume momentum decelerating across higher timeframes 🧭 Outlook: Short-term bias: Neutral to bearish Medium-term (1–3 months): Potential correction toward $380s Long-term (Q2–Q3 2026): Bullish resumption possible if liquidity stabilizes “Wave completion precedes transformation — patience pays.” #TSLA #ElliottWave #TechnicalAnalysis #Macro #VolanXDSS #WaverVanir
Wavervanir_International_LLC
تسلا (TSLA): طوفان در راه است! تحلیل فنی سقوط احتمالی تا ۳۷۴ دلار
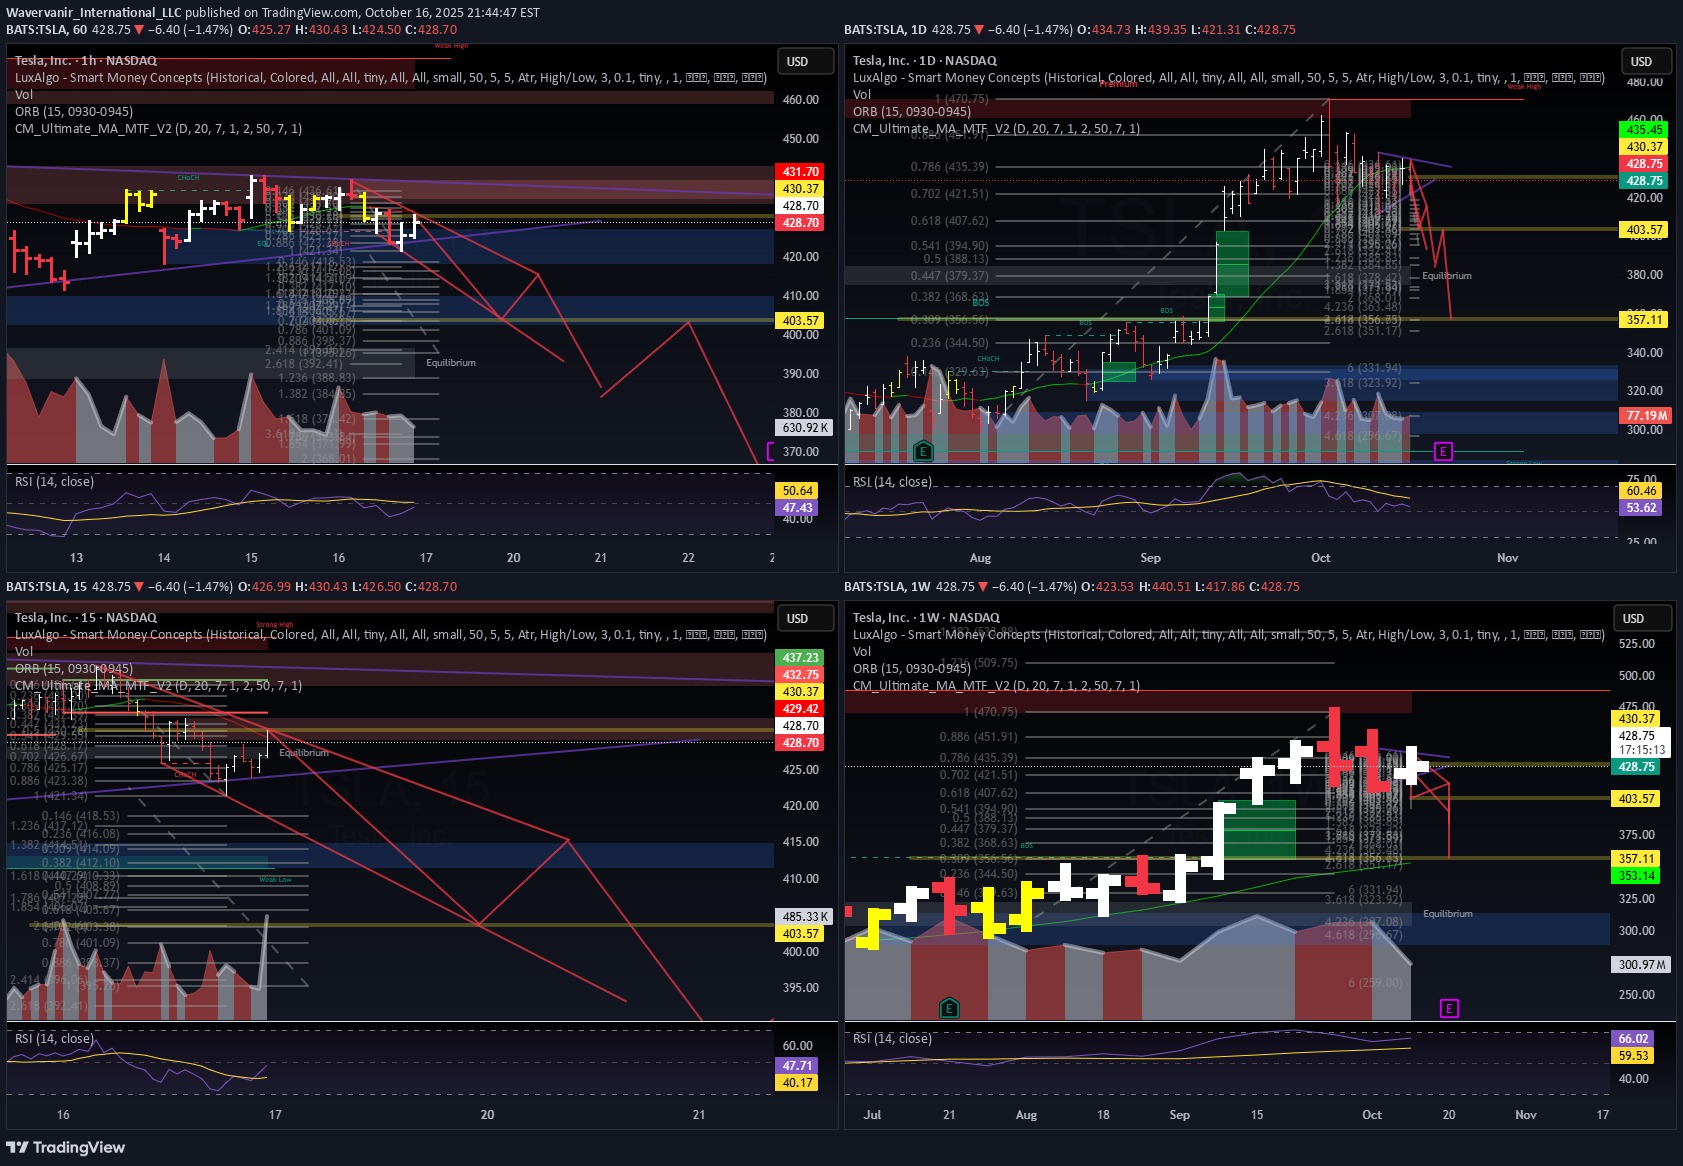
TSLA – The Calm Before the Storm ⚡ Tomorrow could define the next leg. The structure is tight, momentum is fading, and macro pressure aligns with technical exhaustion. Multi-Timeframe Outlook: 1D / 1W: Bearish continuation setup confirmed; equilibrium breached, liquidity void below remains unfilled (targets: $403 → $374). 4H / 15M: Series of lower highs with visible imbalance; RSI divergence confirms momentum exhaustion. Fib Levels: 0.618 and 0.786 rejection zones hold — signaling institutional distribution rather than retail bounce. VolanX DSS Probability Model Bearish Probability: 82% (downward continuation) Bullish Reversal Probability: 18% Volatility Projection: +/- 4.6% intraday range expected Macro & Catalysts Rates & Yields: Rising real yields put pressure on high-beta tech. Earnings Proximity: Market may be front-running a guidance downgrade. Liquidity Flows: Options flow skewed toward puts since Oct 14 — institutional hedging confirmed. Bias: I’m fully committed to the short side here — structure, volume, and macro all align. “Go big or go home.” If $428 fails to reclaim, the path to $403 → $374 opens. 🧠 This is my personal technical outlook, not investment advice. #TSLA #TradingView #VolanX #AITrading #MacroStrategy #WaverVaniryoutu.be/3BFuQicL2WI?si=yZyvpQG7C_xrGsUOI will just wait for 2026 to trade. I am done with the after hr fckery.
Wavervanir_International_LLC
تکمیل شکاف قیمتی تسلا: آیا سقوط فردا آغاز میشود؟
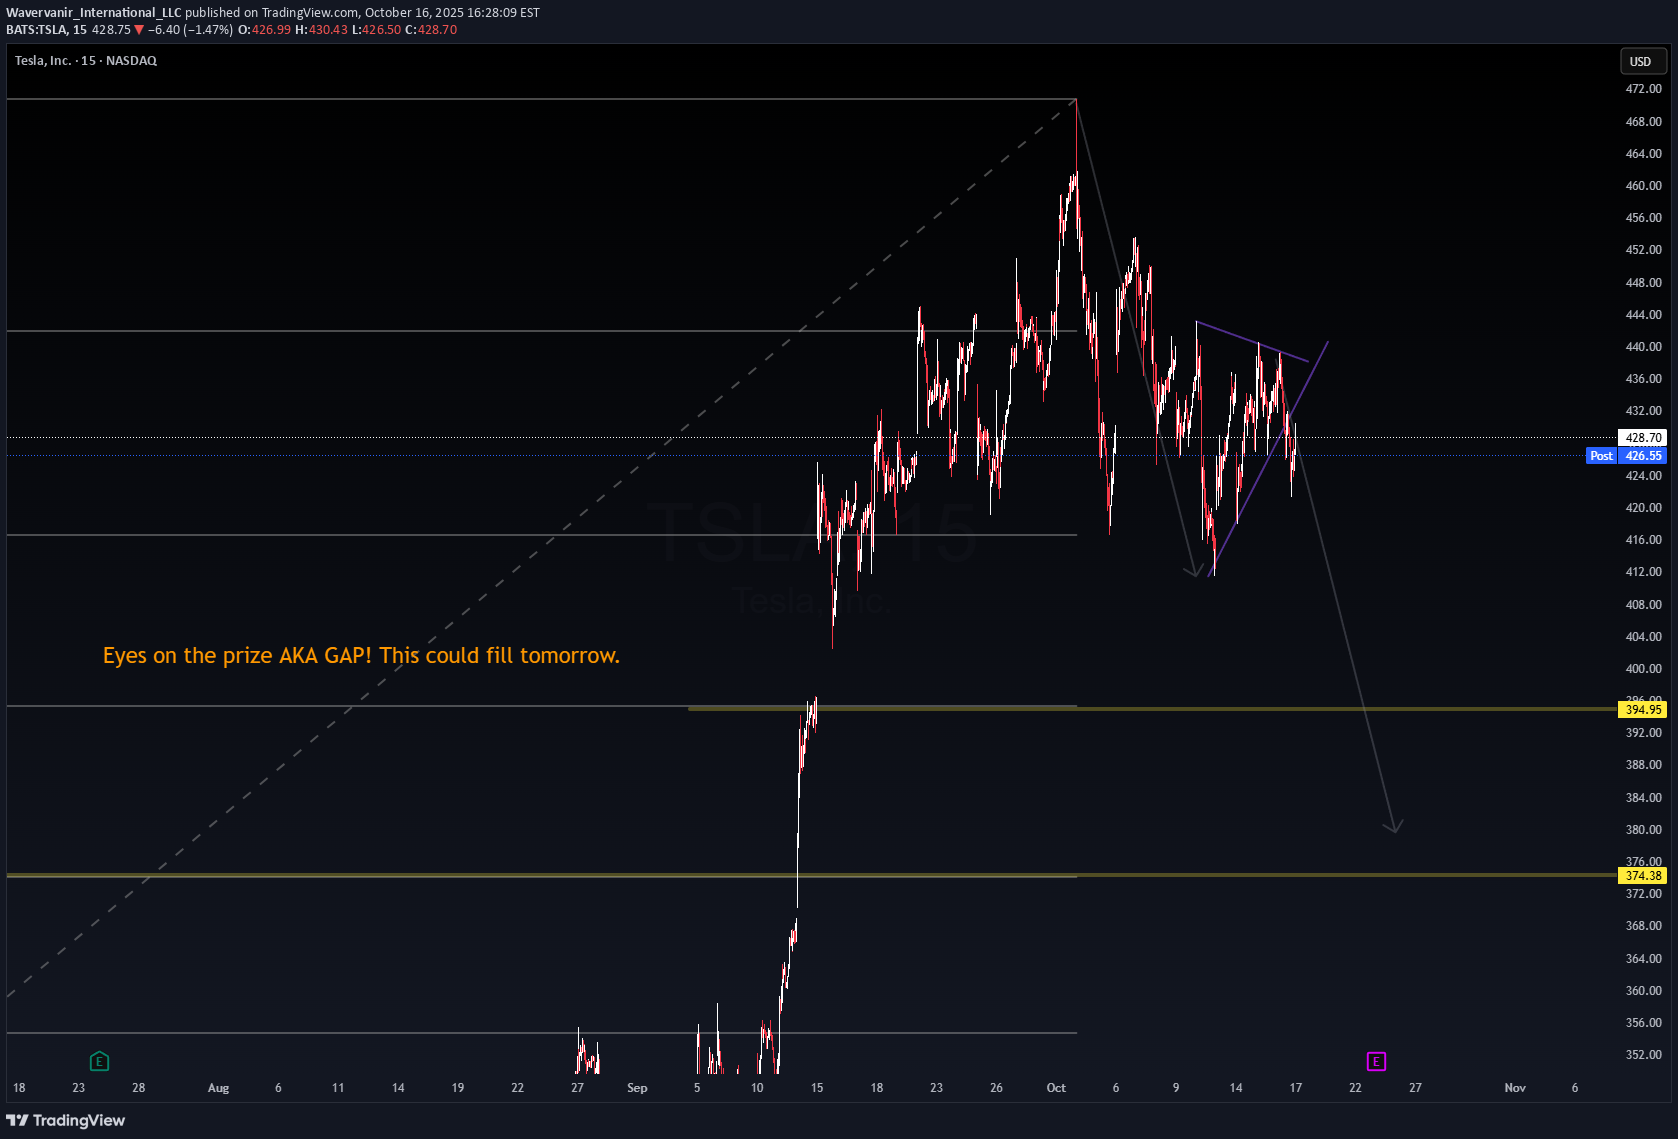
TSLA Eyes on the prize — AKA the GAP 🧠 This imbalance could fill tomorrow if momentum continues downward. RSI cooling off, structure leaning bearish, and that liquidity pocket below looks too tempting to ignore. Just watching price react to the zone — not financial advice. #TSLA #VolanX #GapFill #LiquidityZones #AITrading
Disclaimer
Any content and materials included in Sahmeto's website and official communication channels are a compilation of personal opinions and analyses and are not binding. They do not constitute any recommendation for buying, selling, entering or exiting the stock market and cryptocurrency market. Also, all news and analyses included in the website and channels are merely republished information from official and unofficial domestic and foreign sources, and it is obvious that users of the said content are responsible for following up and ensuring the authenticity and accuracy of the materials. Therefore, while disclaiming responsibility, it is declared that the responsibility for any decision-making, action, and potential profit and loss in the capital market and cryptocurrency market lies with the trader.