Technical analysis by Wavervanir_International_LLC about Symbol TSLAX on 11/11/2025

Wavervanir_International_LLC
تحلیل روزانه تسلا (TSLA): آیا سقوط ادامه دارد یا زمان خرید جدید فرا رسیده است؟
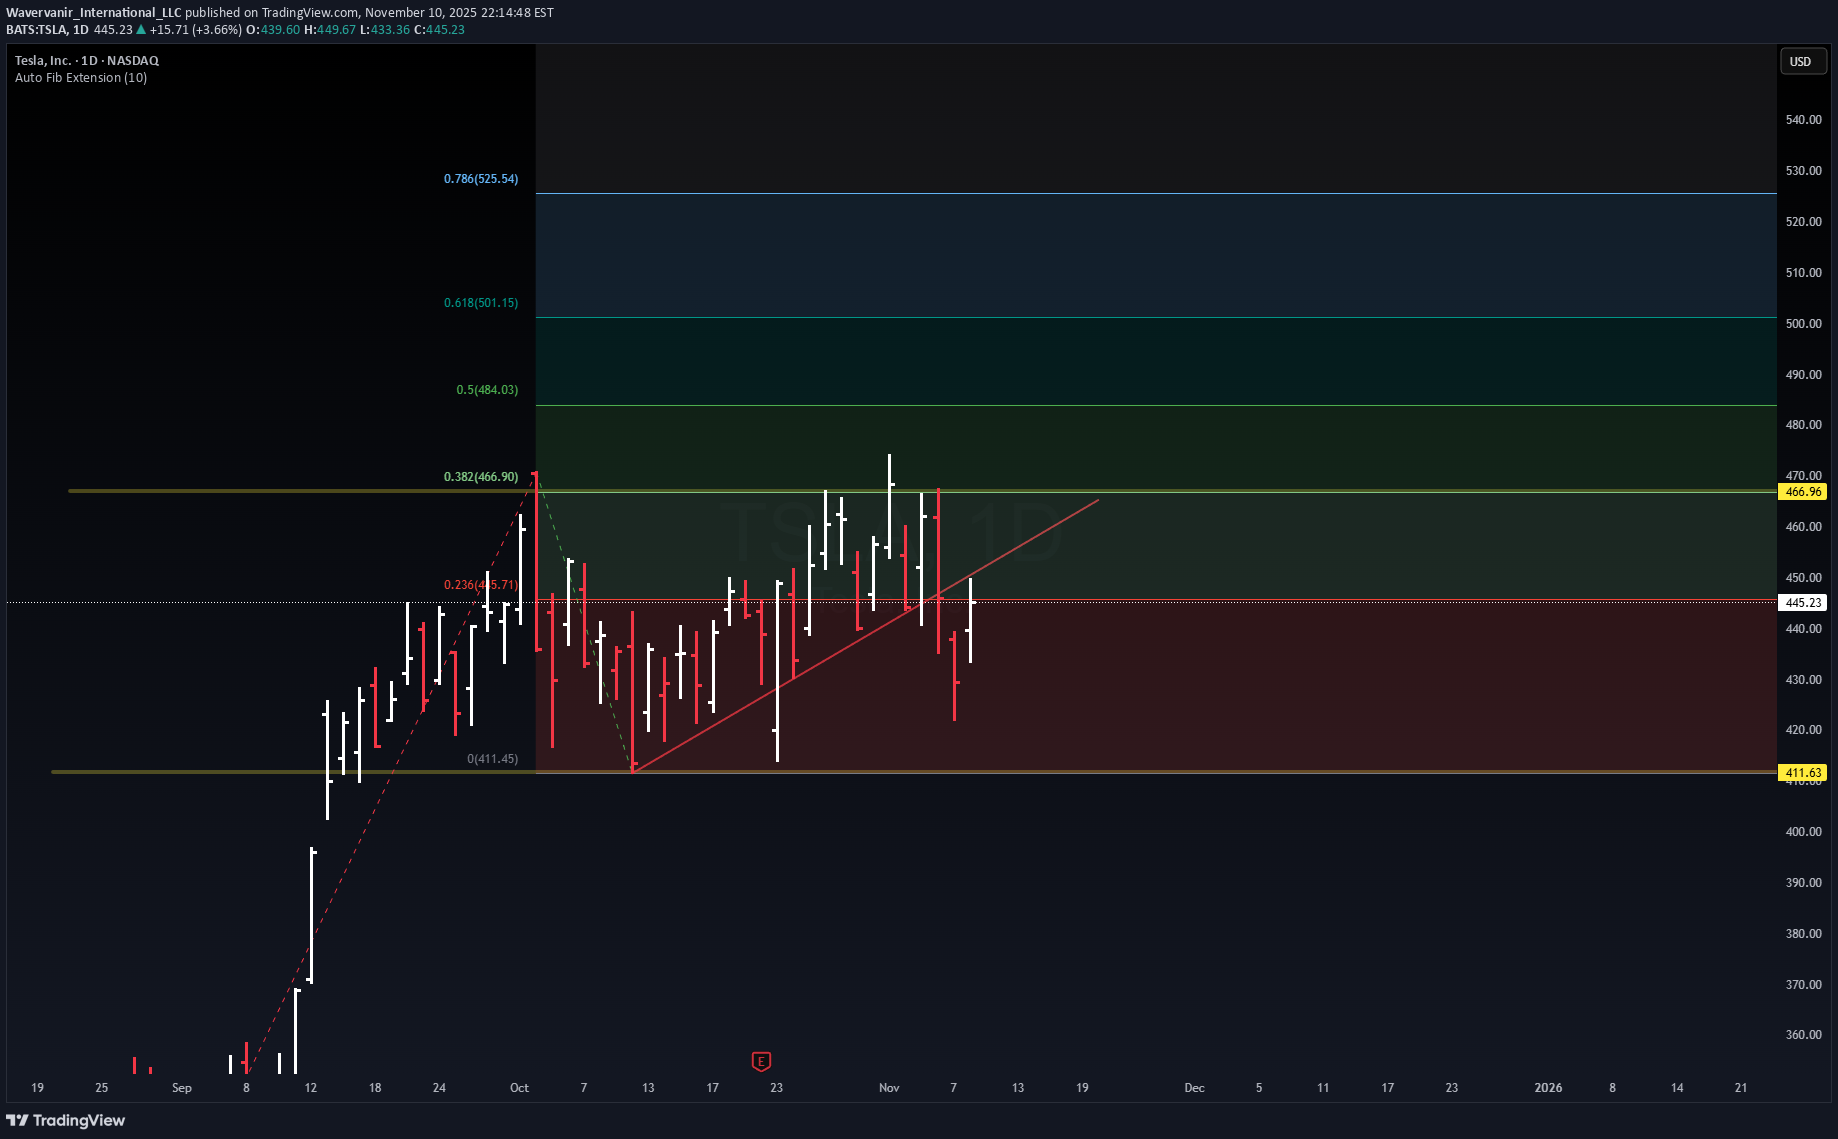
⚡ WaverVanir Edge – TSLA Daily Outlook TSLA rejected from the 0.382 Fib ($466.9) and is hovering near $445, showing short-term weakness after an extended rally. Auto-Fib map reveals liquidity clusters: 🟢 Premium Zones: $484 → $501 → $525 (target expansion levels) 🔴 Discount Zone: $411.6 major support ⚖️ Current equilibrium around $445 — consolidation before directional break. WaverVanir DSS: Bearish divergence (−14% 30-day projection) Institutional Model: Bullish rebound (+9% target → $485.6) Edge Consensus: ⚠️ Range compression — volatility pocket between $411 and $466. 🌍 Macro & Catalysts ⚙️ FSD/AI expansion and Energy storage growth remain medium-term bullish 💰 Margins still under pressure amid price cuts & China competition 🏦 Fed tone mildly dovish → liquidity supportive, but yield volatility persists 🔋 Watch raw material cost trends (lithium, nickel) into Q1-2026 Base Path (WaverVanir Scenario): Pullback → $420–$411 → re-accumulation → breakout >$466 to retest $484 “When volatility converges, conviction breaks. Patience over bias.” #TSLA #WaverVanir #VolanXDSS #Fibonacci #SmartMoneyConcepts #AITrading #Macro #ElonMusk #StockMarket #RiskOn