
Warner_Bear
@t_Warner_Bear

What symbols does the trader recommend buying?
Purchase History
پیام های تریدر
Filter
Warner_Bear
تحلیل تکنیکال QQQ: صعود موقت یا سقوط نهایی؟ نقشه راه معاملهگران
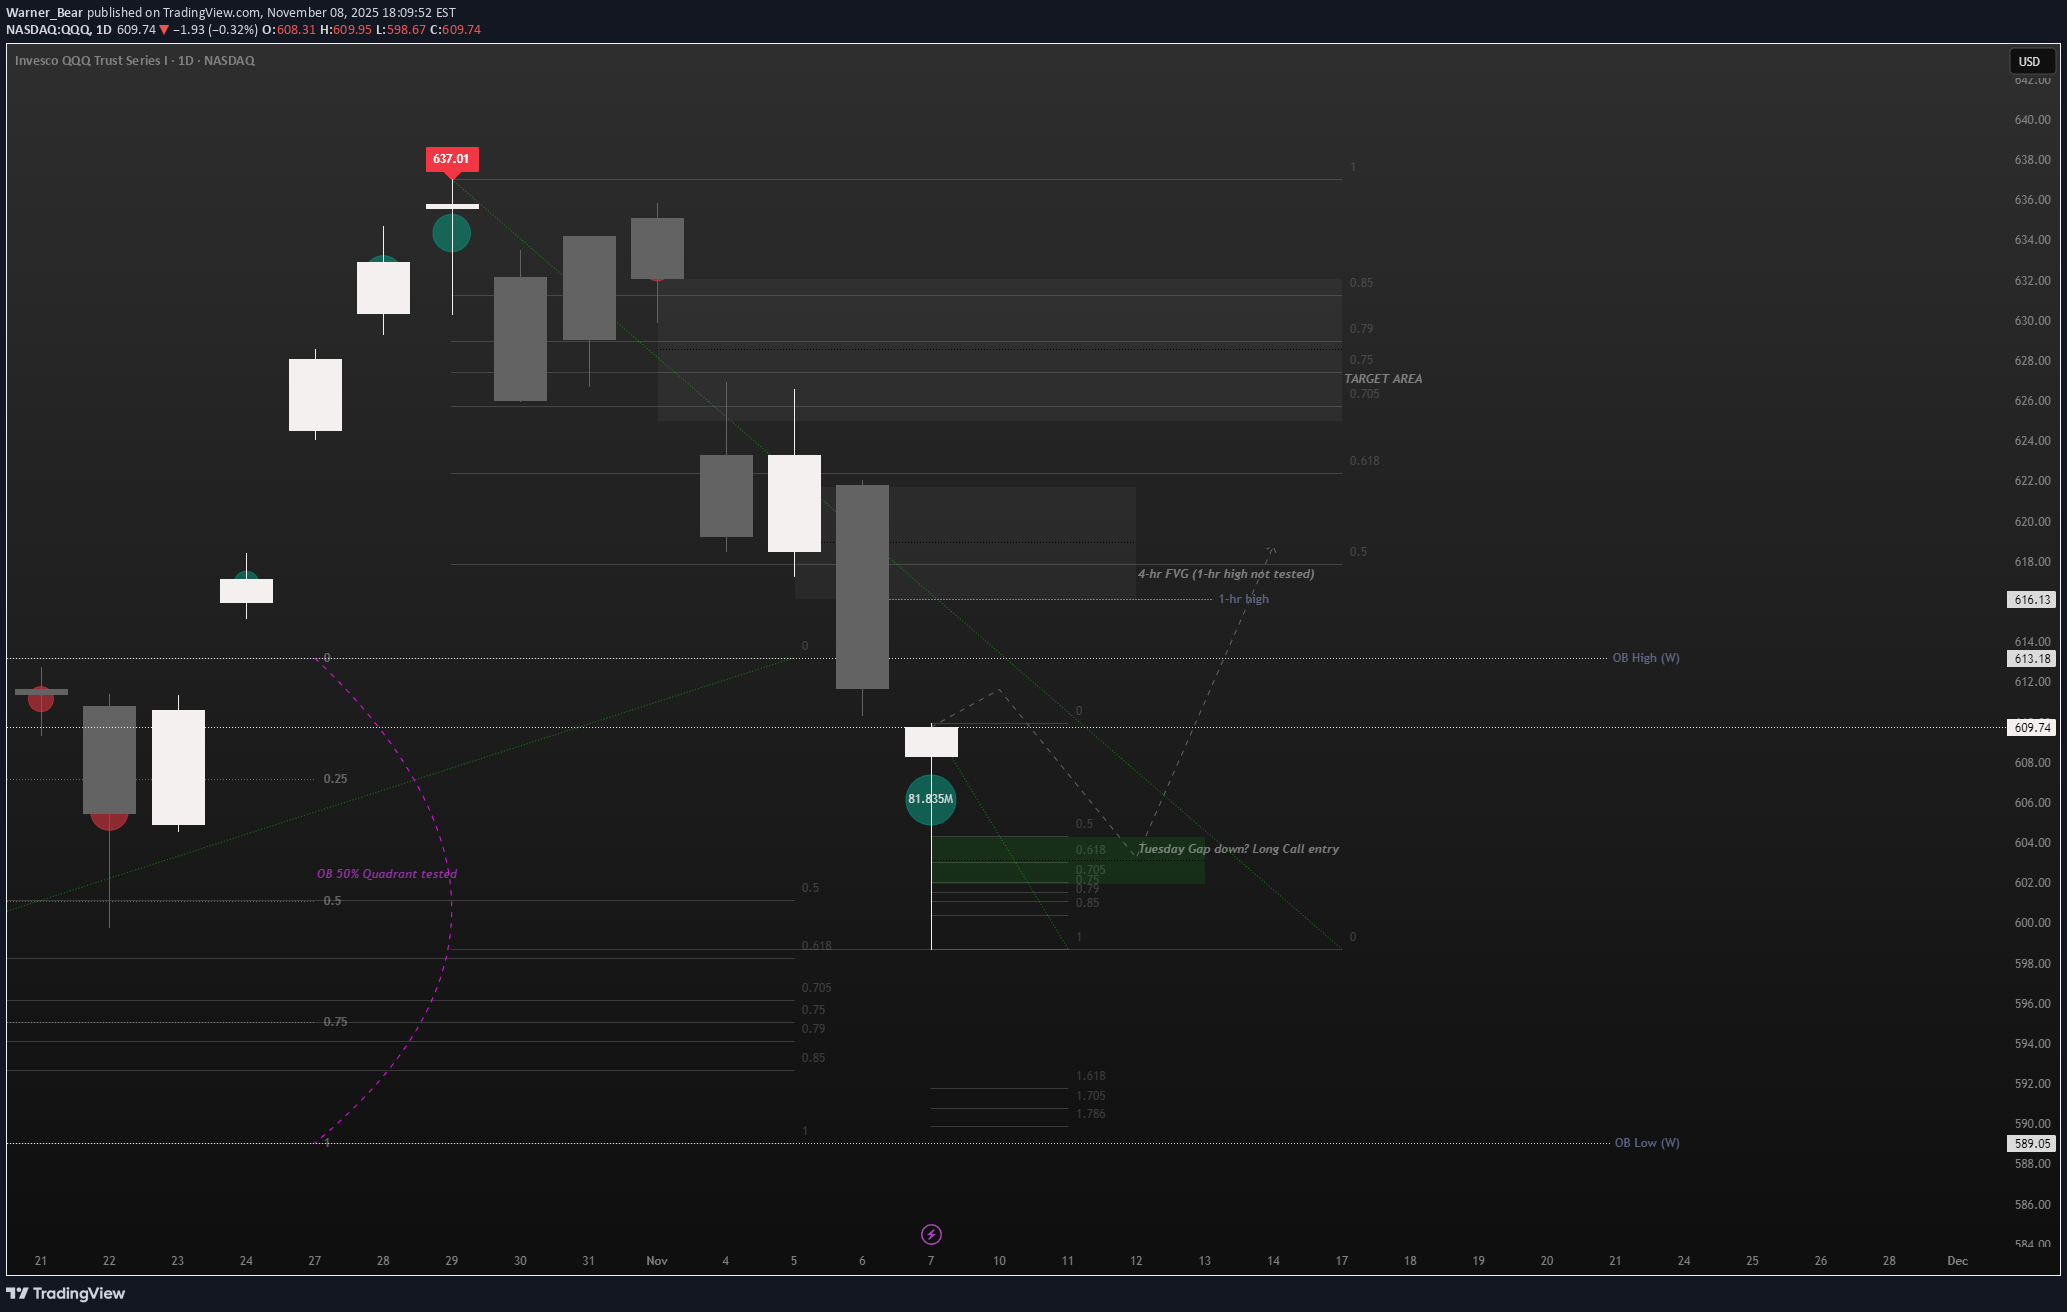
Lots of things going on here (haha). 1. This week we closed with a bullish hammer on daily after testing the inside 50% quadrant of the weekly OB candle. - Good support shows strength back to the upside. - I want to see a gap down Tuesday into the green area for calls. 2. Don't get the long idea twisted, I am still temporarily bearish. - I am long back up to the 4-hr FVG, looking at a 1-hr high sweep. After this I am watching for continued downside. - A push past the 4-hr FVG indicates bullishness and my target changes to .705 of the fibs. 3. If the 4-hr FVG fails, then my target becomes the OB low on weekly.
Warner_Bear
تحلیل بیت کوین (BTC): هدف کوتاهمدت و نقشه راه بلندمدت 52 هزار دلاری!
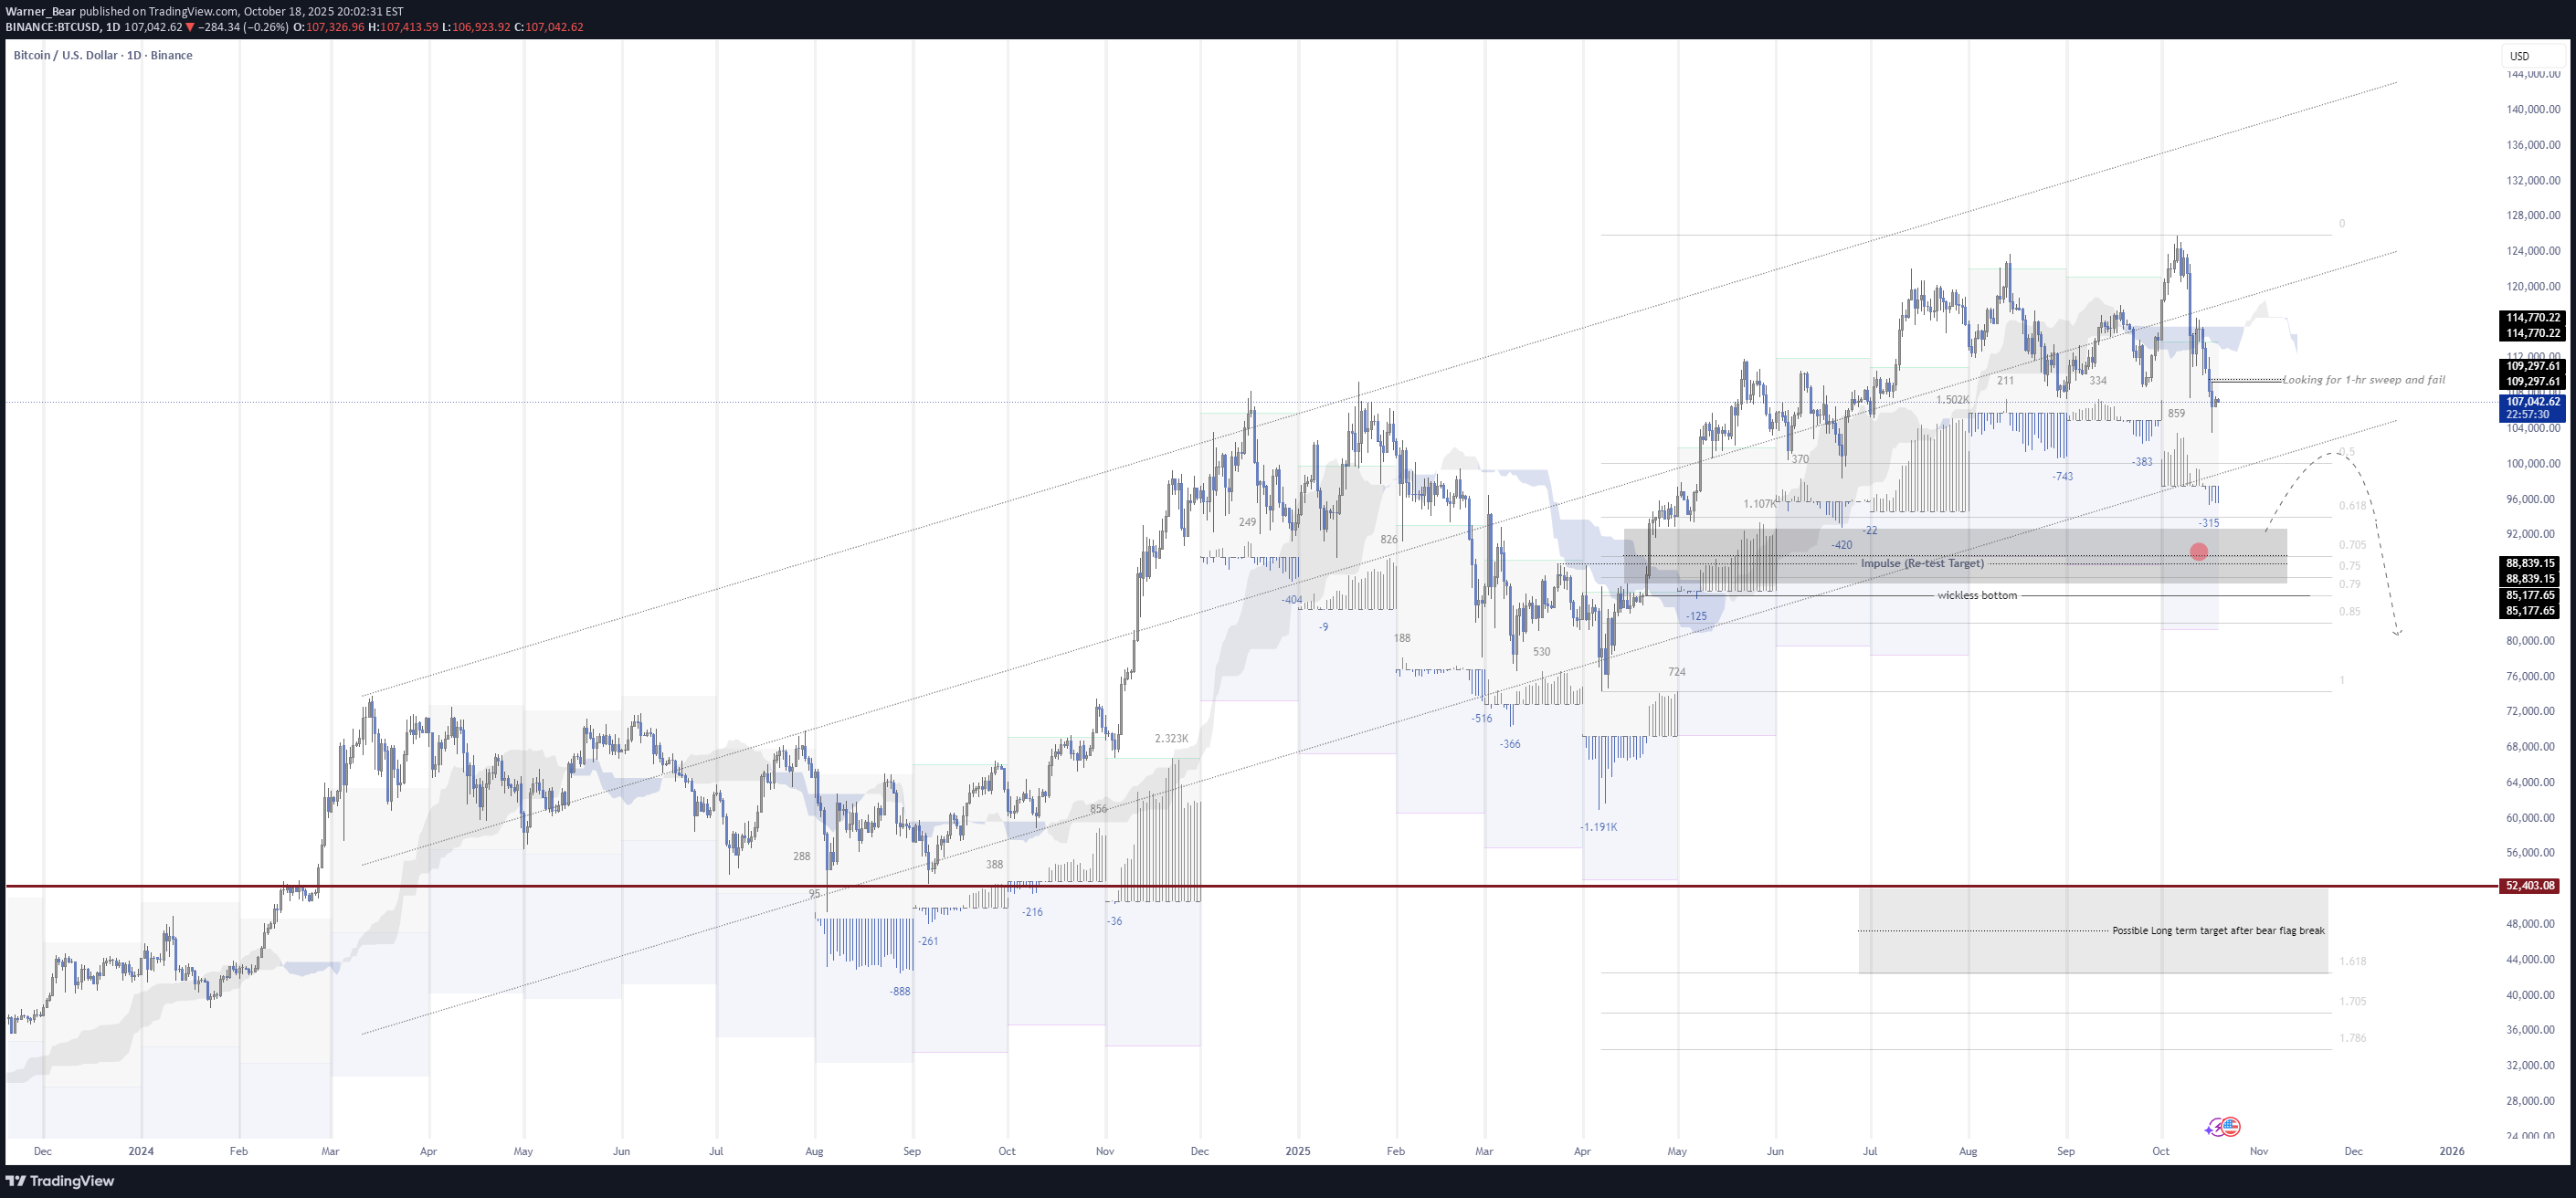
Short Term - watching for BTC to sweep 1-hr high into FVG and fail. Long term - Bear Flag break on BTC with 52K target. Currently, BTC is trading in this bear flag on the daily. With the impulse candle on the weekly chart that was never re-tested, and the bottomless wick, those are high priority targets. Targeting this area means BTC the bear flag on BTC is in play. After the weekly impulse area and wickless bottom are mitigated, we should see BTC move back up to re-test the break (watching for some sort of high and sweep into an FVG). Once the bear flag break is confirmed, only then will BTC move down to the 50K level. This means we can harvest more from MSTR short.BTC is playing out as expected. Target is still long term area 52K. Bounce to re-test break could come soon.
Warner_Bear
تحلیل کوتاه و استراتژی جدید معامله: آیا تسلا به اوج تاریخی بازمیگردد؟
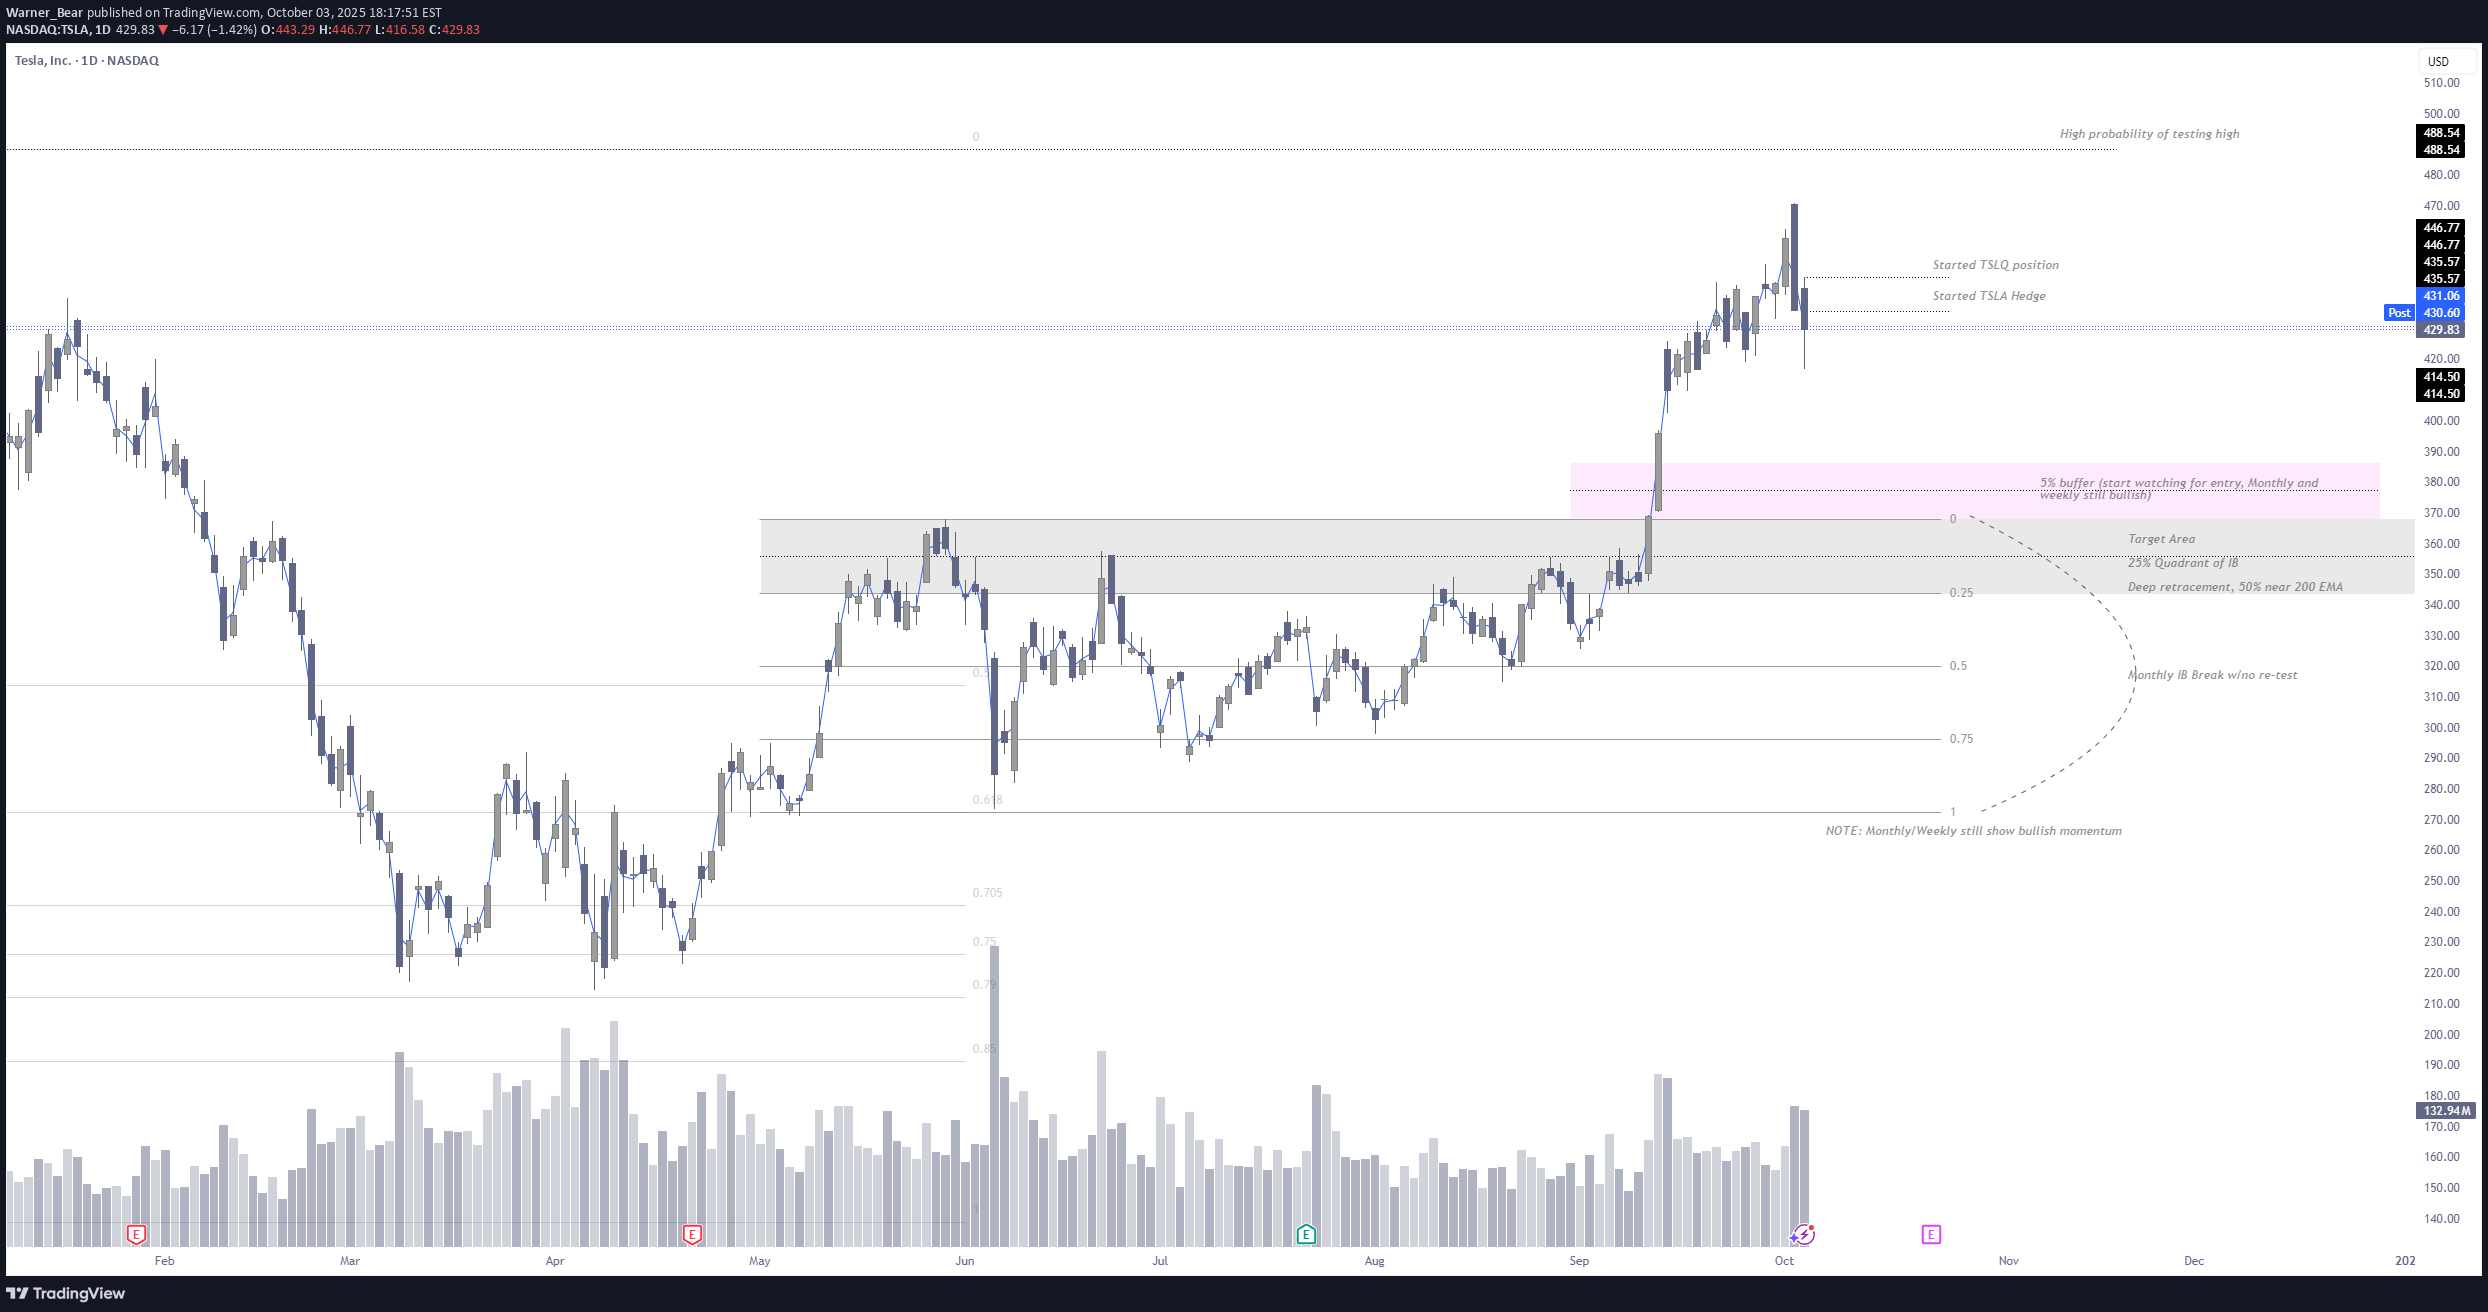
1. May/June Inside Bar: Broke to the upside on September with no re-test of break. a. Higher timeframes take longer for this to re-test. b. I have found that 18 days is an average re-test, but this is not 100%. 2. Daily chart shows pullback, but its extremely important to understand that the weekly and monthly show bullish momentum. 3. I have started a TSLQ short position adding slowly, with TSLA shares targeting ATH's. 4. The target is for TSLA to move back into the 5% buffer, where I will start looking for a long position. The inside bar is usually re-tested. If bullish momentum is still there, which the weekly and monthly still show, then the 5% buffer and 25% quadrant are entry zones. However, if something changes, then 50% quadrant should be the target. Happy trading!Beautiful dump---been waiting on this! If you were short TSLA or in TSLQ huge congrats!
Warner_Bear
MSTR (possible short)
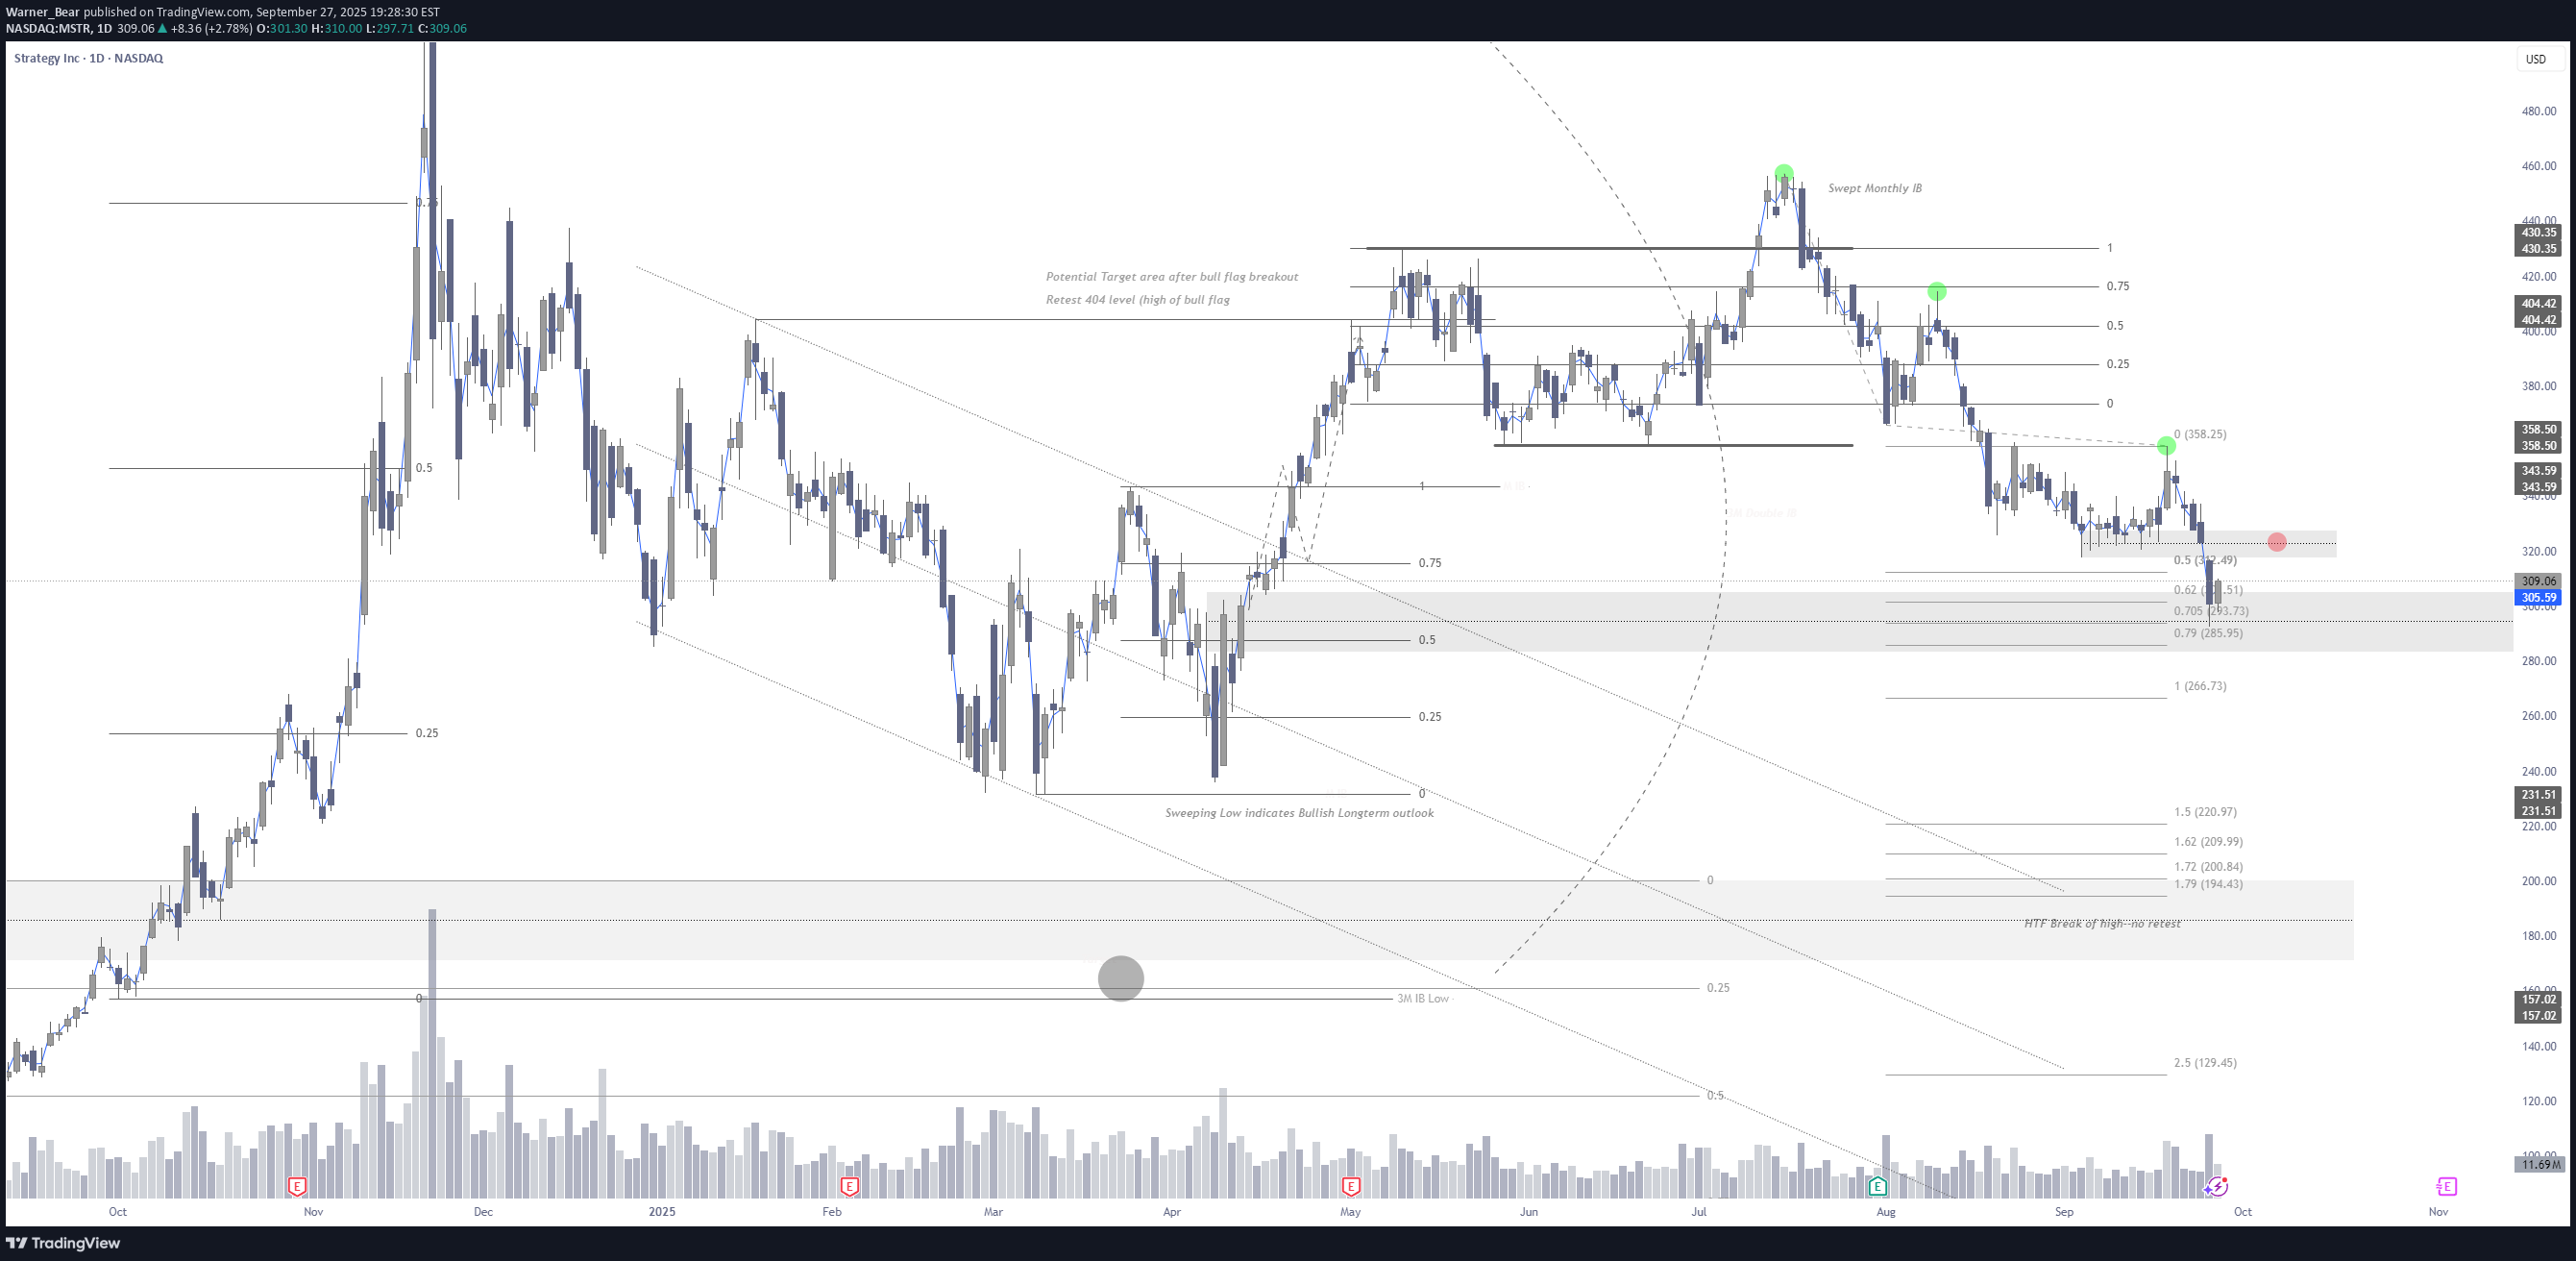
Alot going on here, but its jus because I have been charting this out since around March. BTC has a bearish setup where we could possibly see 92.5Kish. Looking at MSTR which is a huge follower, we broke below the 200 on the daily. My reasoning for possible short entry (red dot). 1. Trend Based Fib (3-point in green): shows we could bounce here, but extend down toe the $200 level. 2. We could bounce here because we are re-testing the monthly IB that we broke out, we are at the 50% quadrant of that IB. 3. However, we are currently trading within the 3M quarterly candle, and the HTF breakout we had was never re-tested. Sweeping this 3M candle, would put us in a good spot for long term growth. 4. Short entry would be red dot, with covering at the last high on daily ($358ish).
Warner_Bear
TSLA - Long
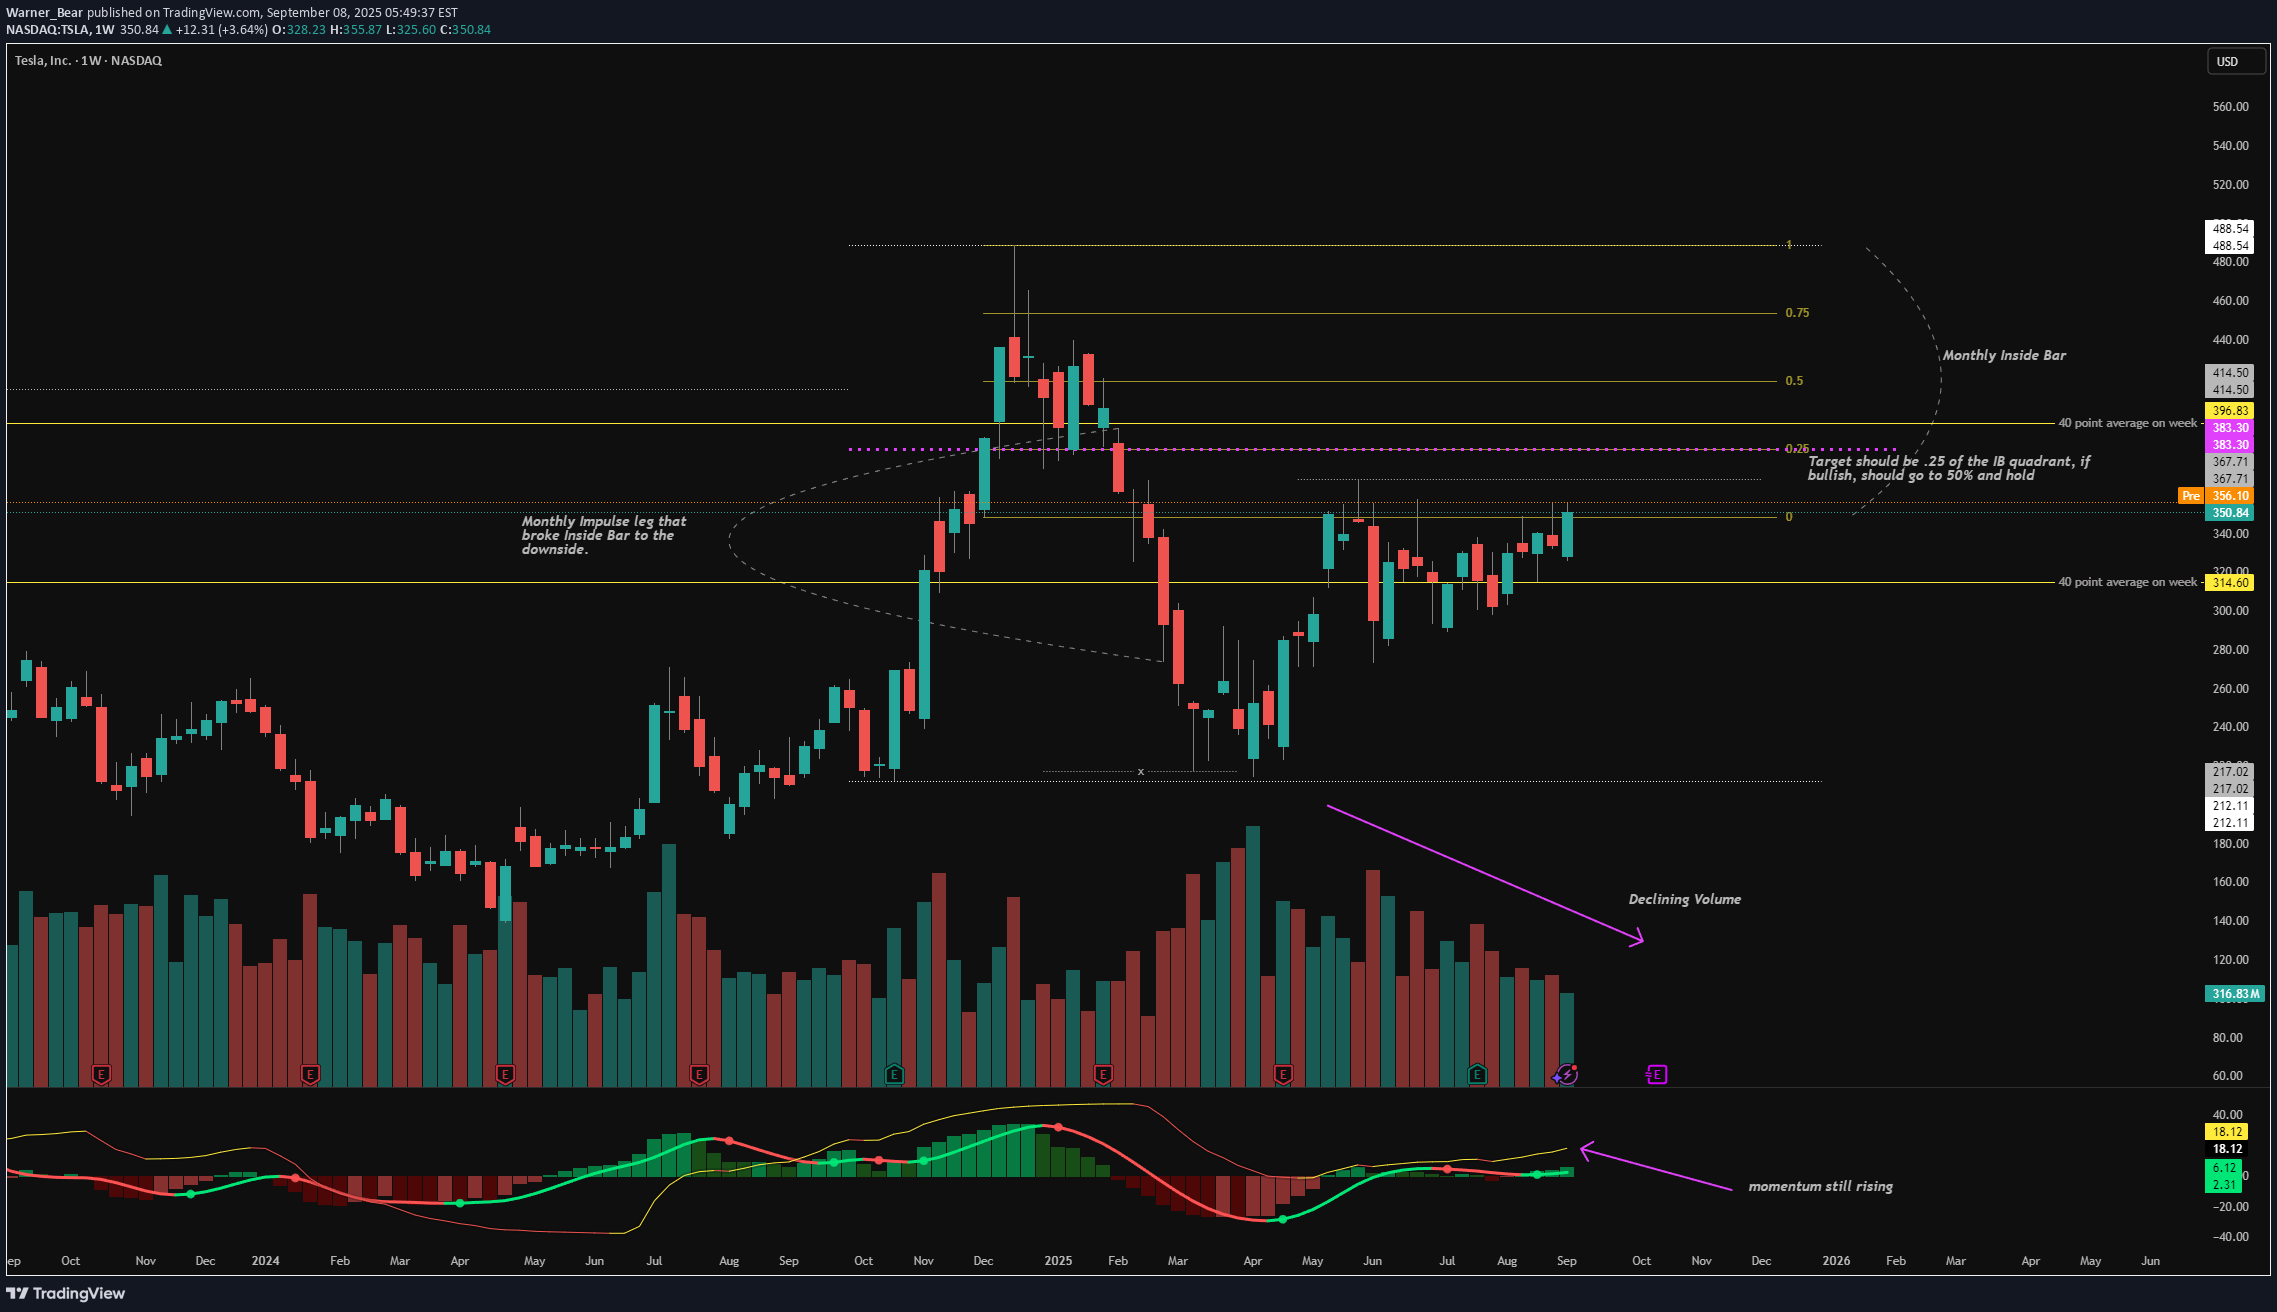
TSLA looks to be heading to the 25% of the Inside Bar on the monthly. Need to have strict risk management on this incase it falls through. Weekly looks good, with targets of 25% and 50% of the Inside Bar quadrant. TSLA also moves an average 40 points per week, so the upside looks more accurate then downside.
Warner_Bear
TSLA Descent 4-hr Outlook
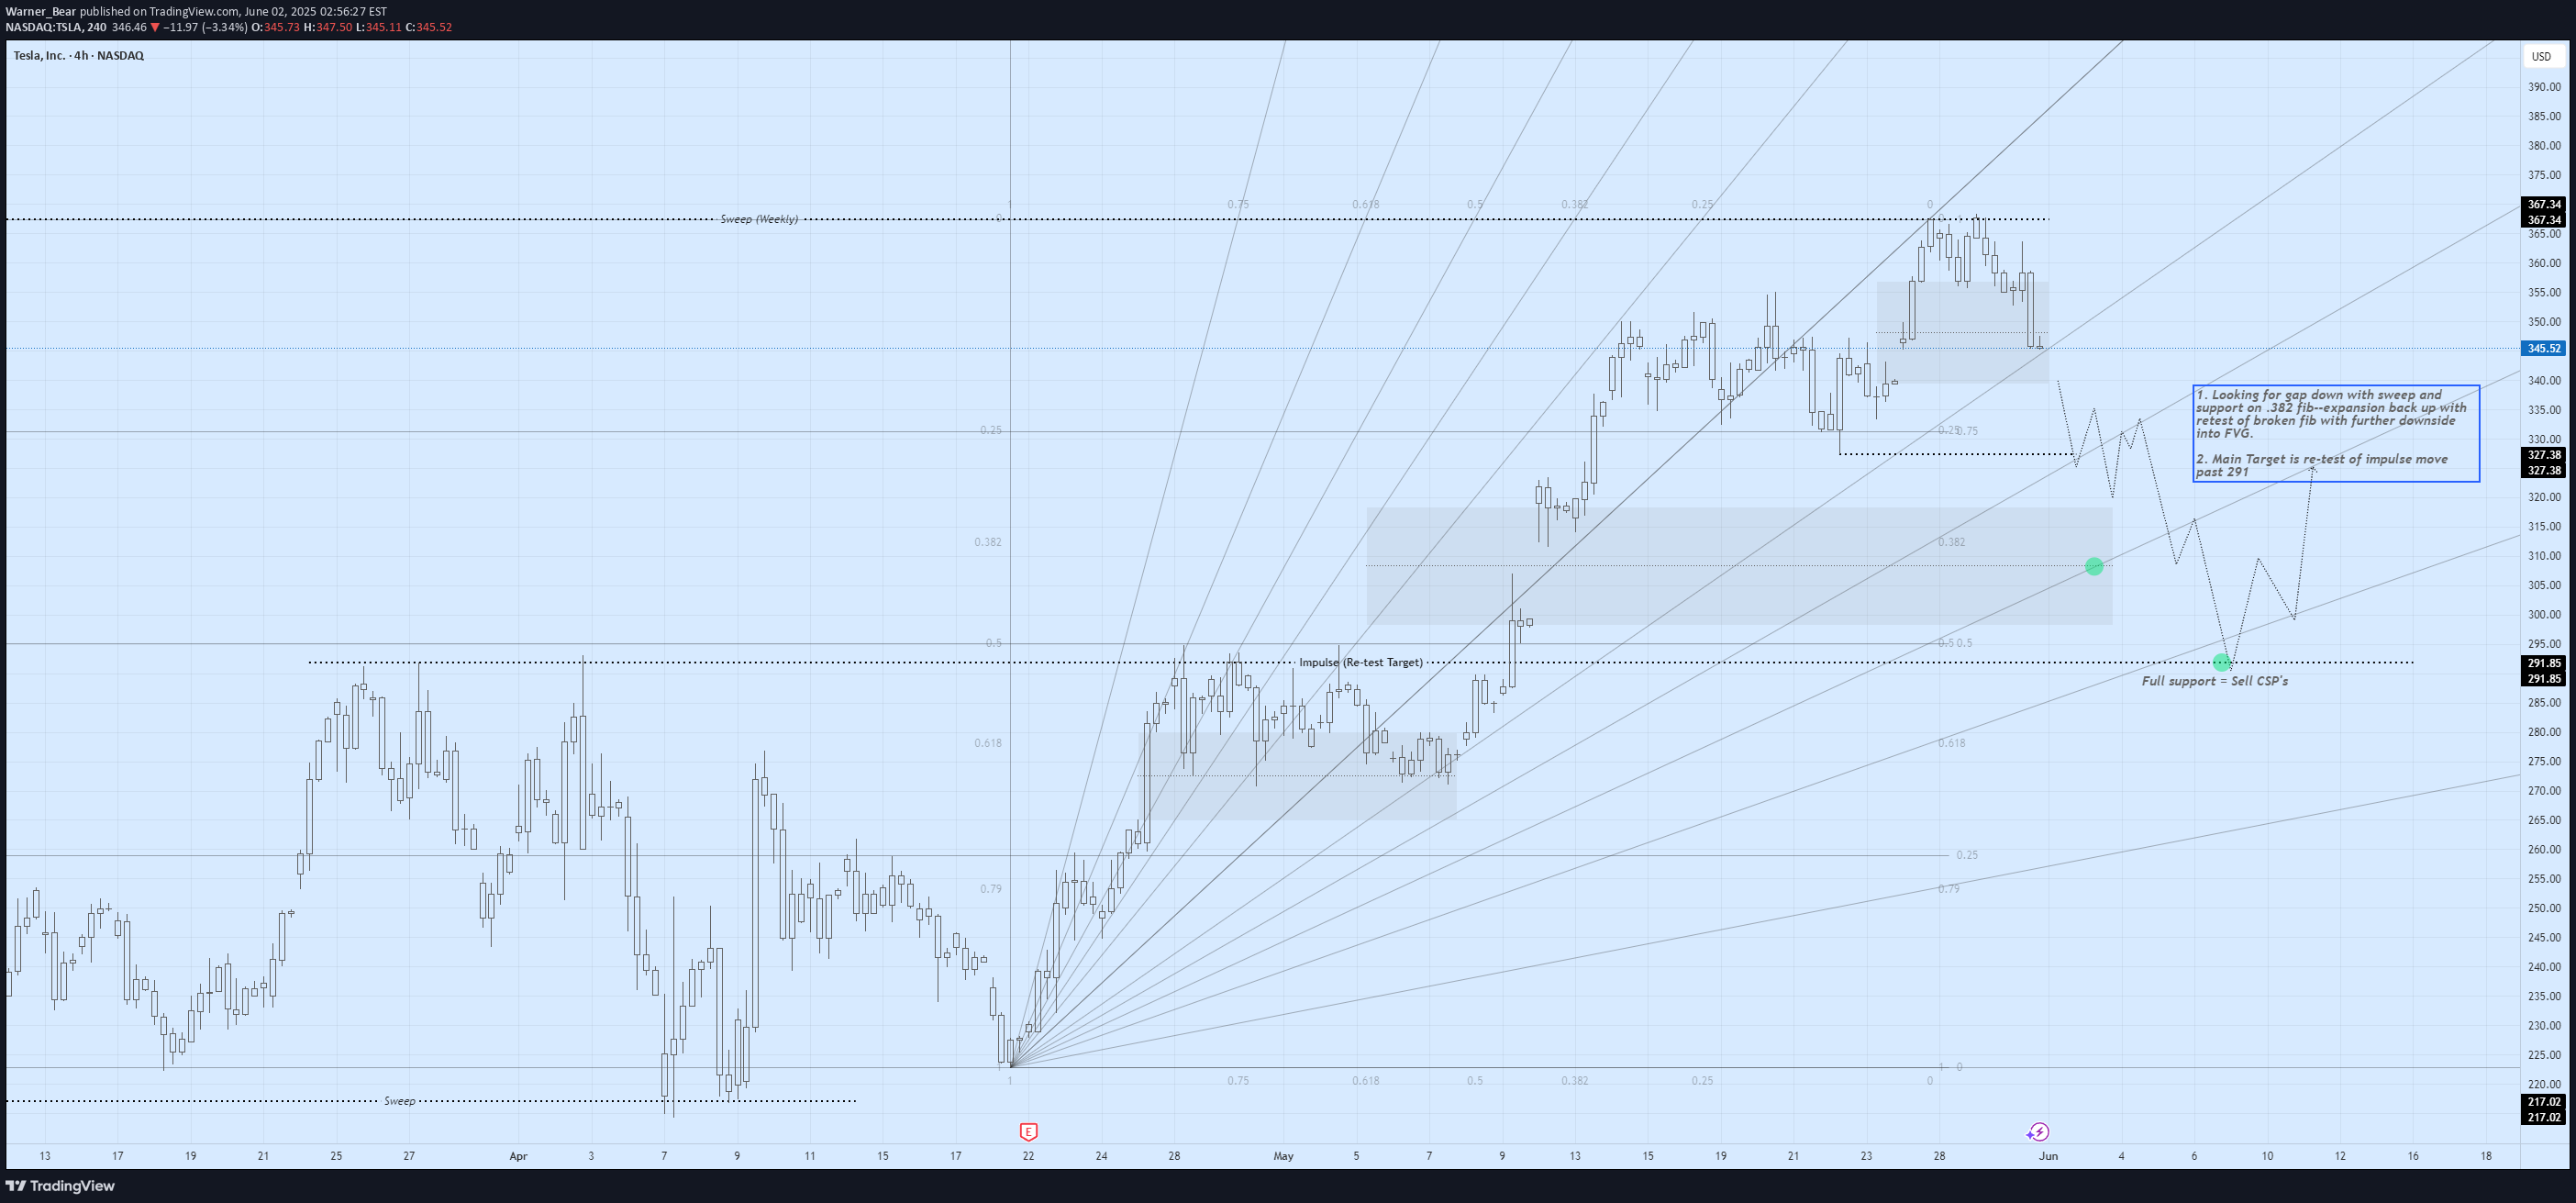
TSLA Descent! 1. Looking for gap down with sweep and support on .382 fib--expansion back up with retest of broken fib with further downside into FVG. 2. Main Target is re-test of impulse move (291 level). -- take into consideration TSLA moves 29 points weekly (avg). 3. Full support = selling CSP's 14+ days out.Beautiful break down of TSLA
Warner_Bear
NVDA 4-hr Outlook
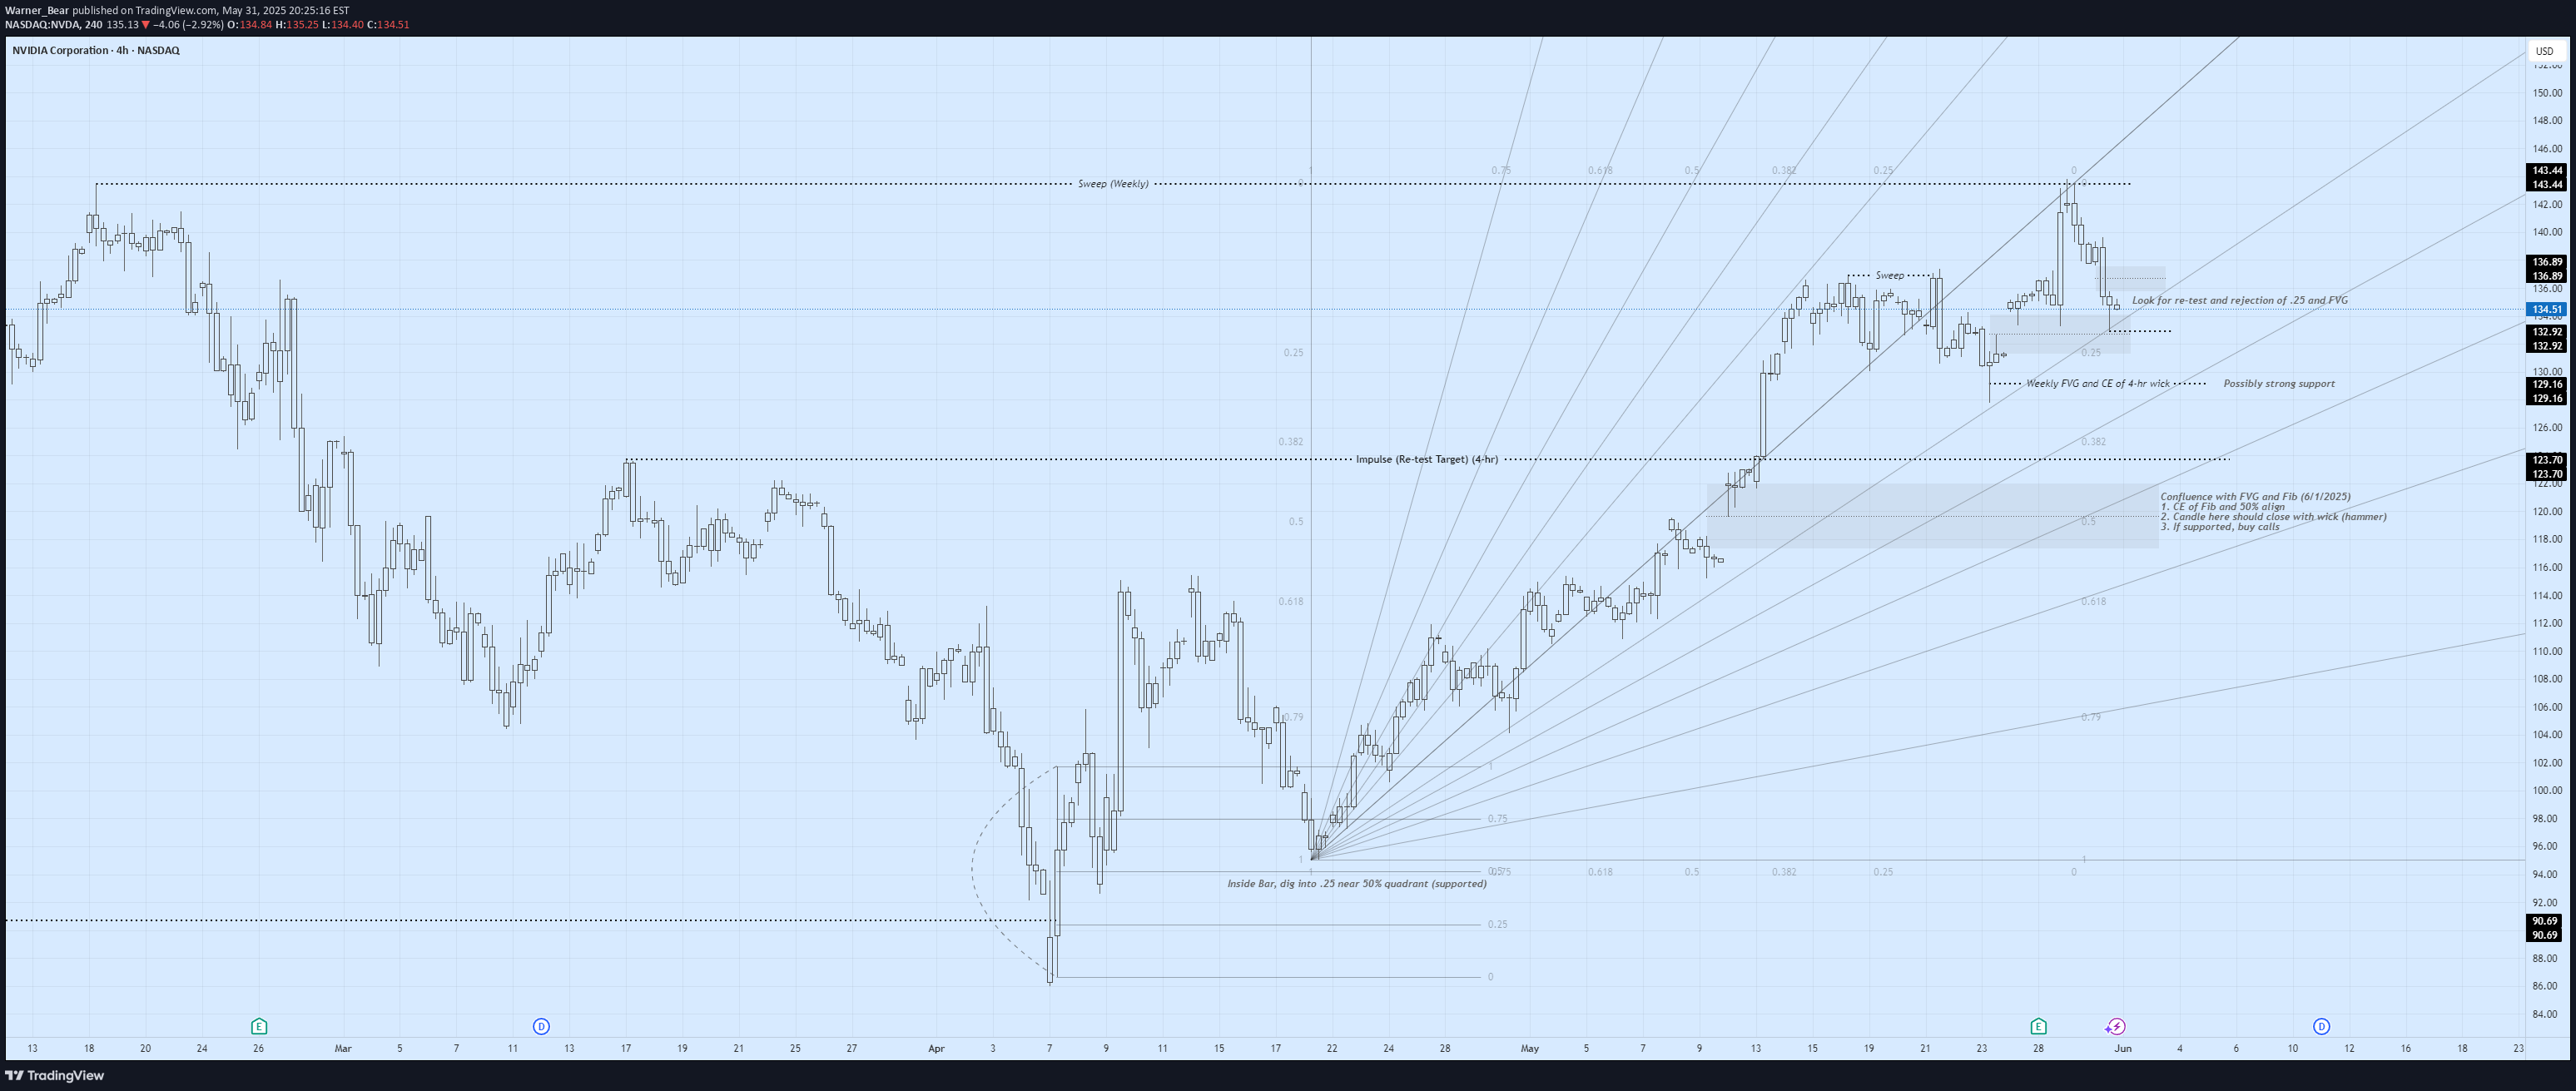
1.Swept Weekly High with draw back into 4-hr gap up. 2.If price breaks below here, my target becomes the re-test of the 4-hr break due to the impulse move through that high. a.WARNING: Need to watch for support on Weekly FVG and CE of 4-hr wick and support off .382 fib. b.If target breaks below, then I would like long puts or sell calls into re-test of break as it shows rejection on the .25 fib line. 3.As we re-test this area I would like to see full support into the .50 fib/FVG. a.Why? Confluence with FVG and Fib b.Want to see a hammer style candle indicating supportok, so we swept that previous high, now the falls starts.
Disclaimer
Any content and materials included in Sahmeto's website and official communication channels are a compilation of personal opinions and analyses and are not binding. They do not constitute any recommendation for buying, selling, entering or exiting the stock market and cryptocurrency market. Also, all news and analyses included in the website and channels are merely republished information from official and unofficial domestic and foreign sources, and it is obvious that users of the said content are responsible for following up and ensuring the authenticity and accuracy of the materials. Therefore, while disclaiming responsibility, it is declared that the responsibility for any decision-making, action, and potential profit and loss in the capital market and cryptocurrency market lies with the trader.