
VarghaVafa
@t_VarghaVafa

What symbols does the trader recommend buying?
Purchase History
پیام های تریدر
Filter
Signal Type
VarghaVafa

⚠️ ETH – Approaching Major Supply Zone Pair: ETH/USD Timeframe: 3D Structure: Order Blocks (OB) + Fair Value Gaps (FVG) Momentum: RSI nearing historical reaction levels 📊 What’s happening? ETH has rallied strongly into a multi-year supply zone between $4,200 – $4,500, overlapping with prior distribution phases. The zone aligns with a major Order Block (OB) from the last market top, making it a high-risk area for rejection. 🛑 Caution Zone: OB resistance: $4,200 – $4,500 RSI approaching overbought region on the 3D timeframe 📌 Bearish Signals to Watch: Bearish candle formations inside OB RSI bearish divergence Failure to close above $4,500 Bias: Possible short-term correction before any attempt at ATH retest. ✅ Bullish Confirmation: Strong volume breakout above $4,500 Retest of OB as support holding RSI maintaining bullish momentum without sharp divergence 🎯 Upside Targets: $4,868 (ATH) $5,200+ (extension target) Bias: Highly bullish if price closes and sustains above $4,500.
VarghaVafa
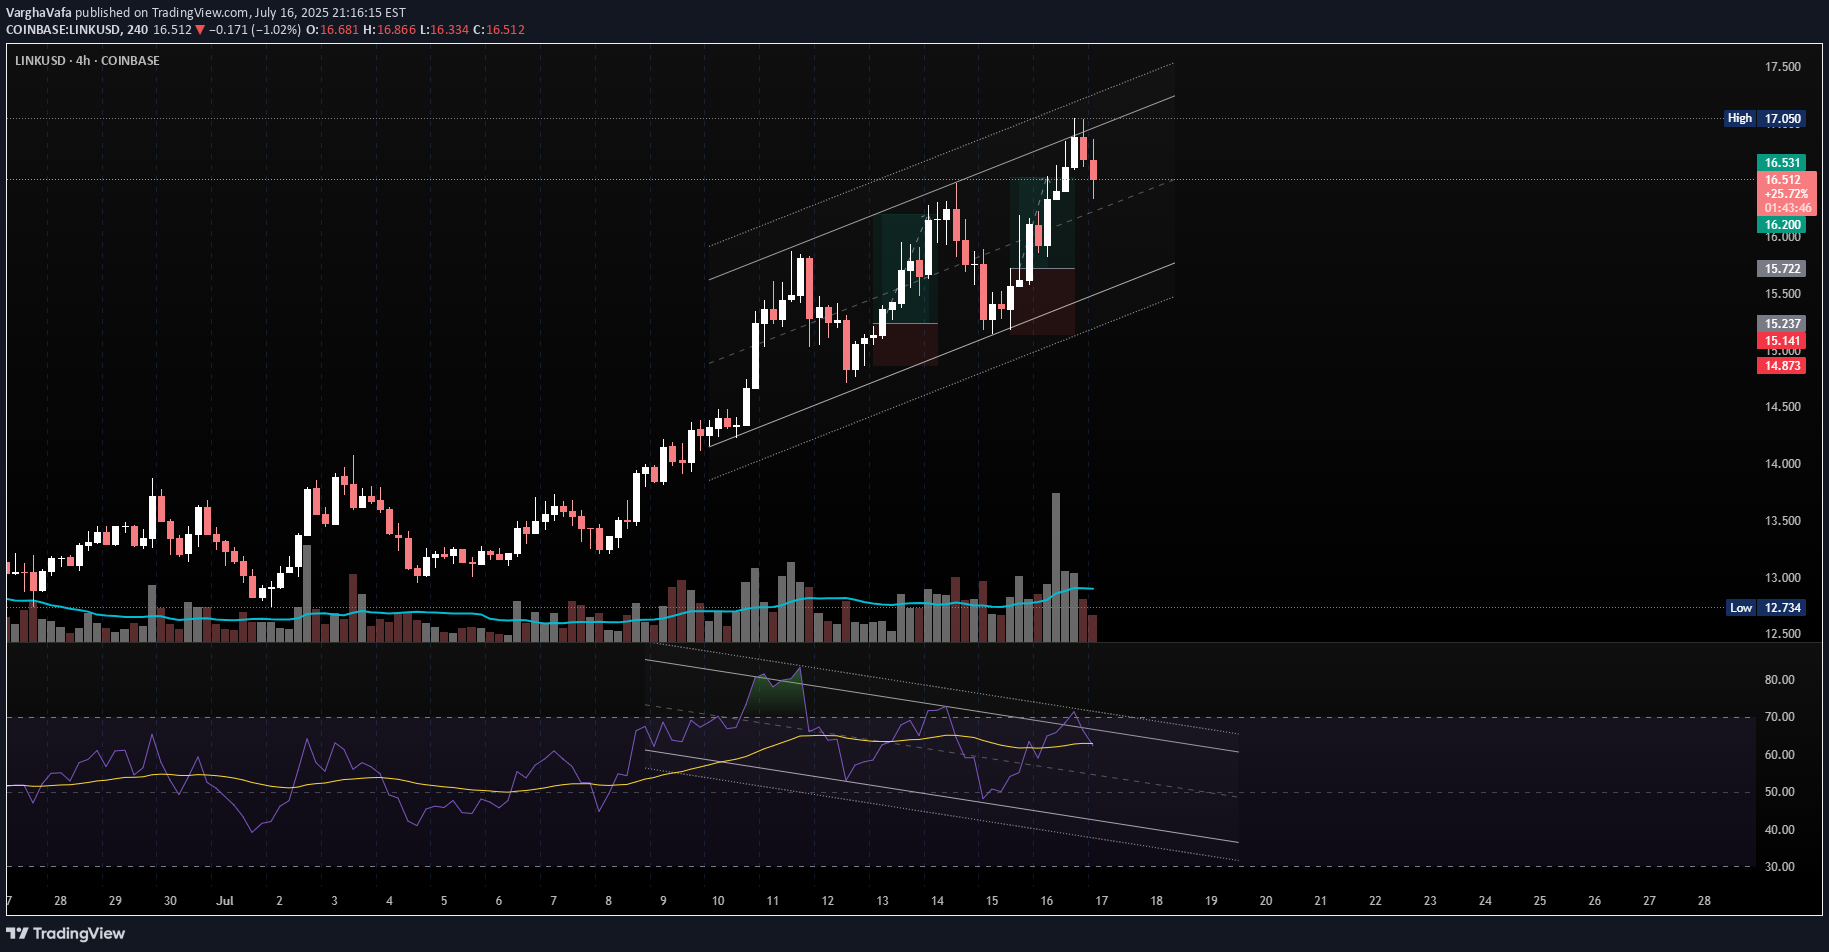
Structure: Ascending Channel Indicators: RSI Overbought, Bearish Divergence Forming 📌 Confirmation: Look for: A strong bearish candle or RSI breaking below 60 Volume divergence Bias: Short-term bearish correction, bullish structure intact as long as price holds the channel.
VarghaVafa
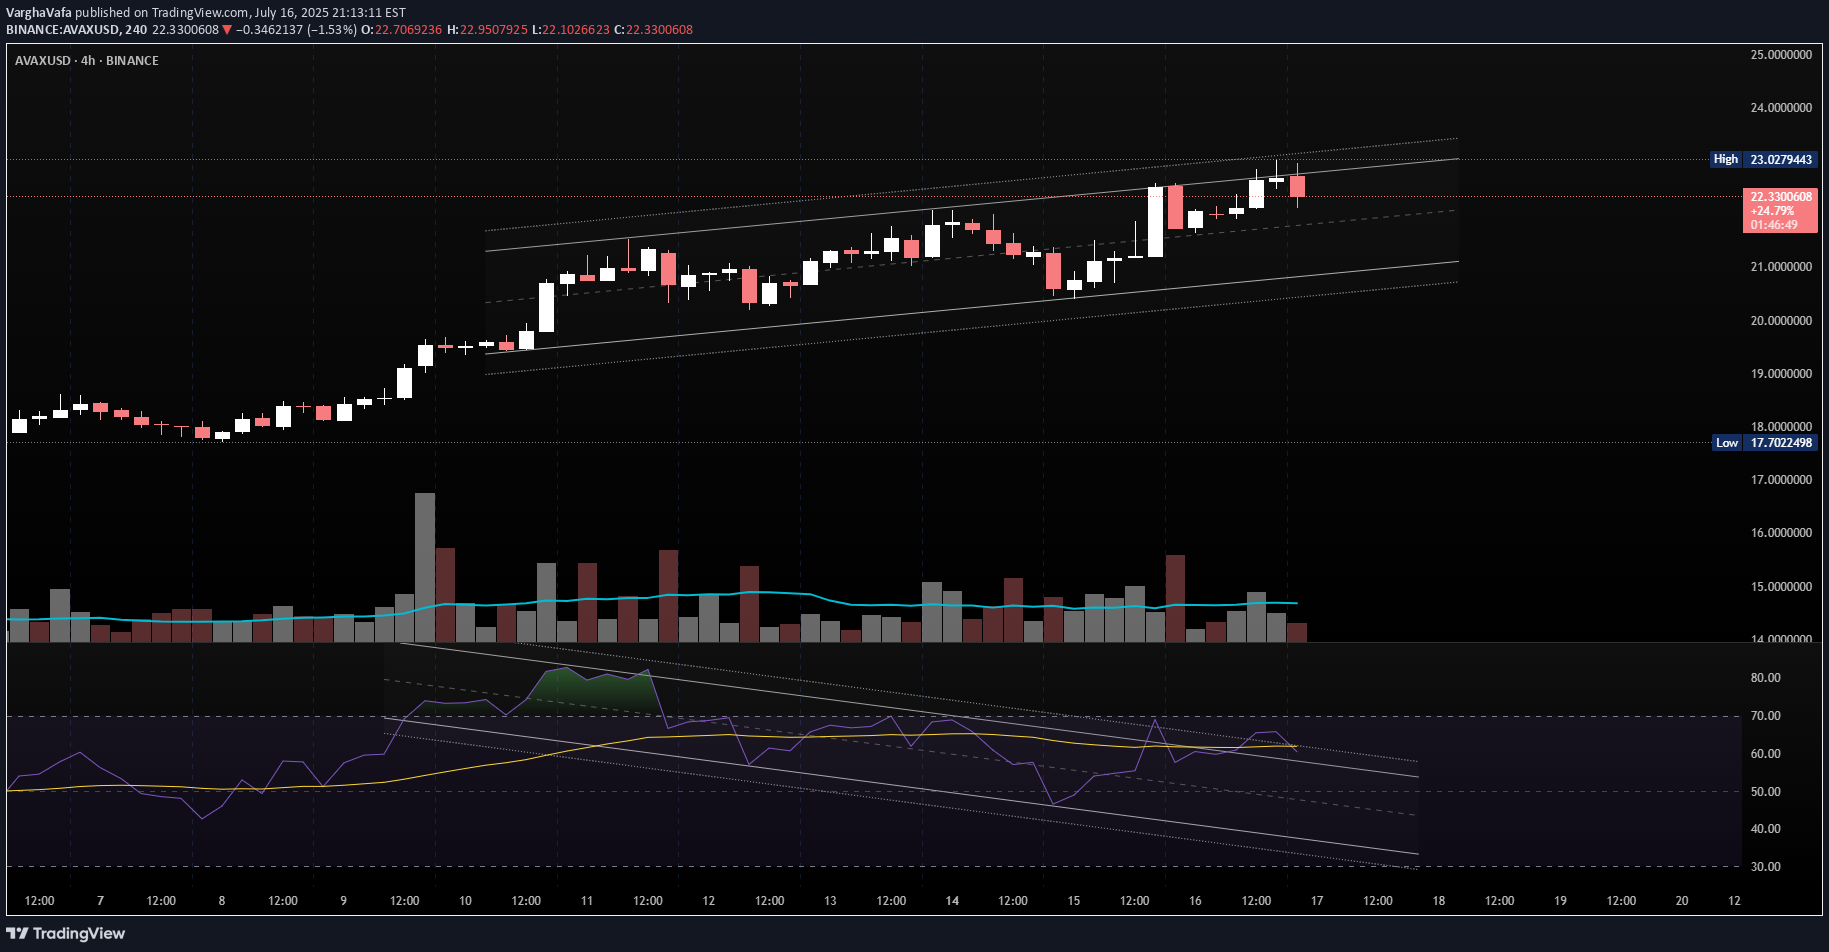
Structure: Ascending Channel Indicators: RSI Overbought, Bearish Divergence Forming 📌 Confirmation: Look for: A strong bearish candle or RSI breaking below 60 Volume divergence Bias: Short-term bearish correction, bullish structure intact as long as price holds the channel.
VarghaVafa
Structure: Ascending Channel Indicators: RSI Overbought, Bearish Divergence Forming 📌 Confirmation: Look for: A strong bearish candle or RSI breaking below 60 Volume divergence Bias: Short-term bearish correction, bullish structure intact as long as price holds the channel.
VarghaVafa
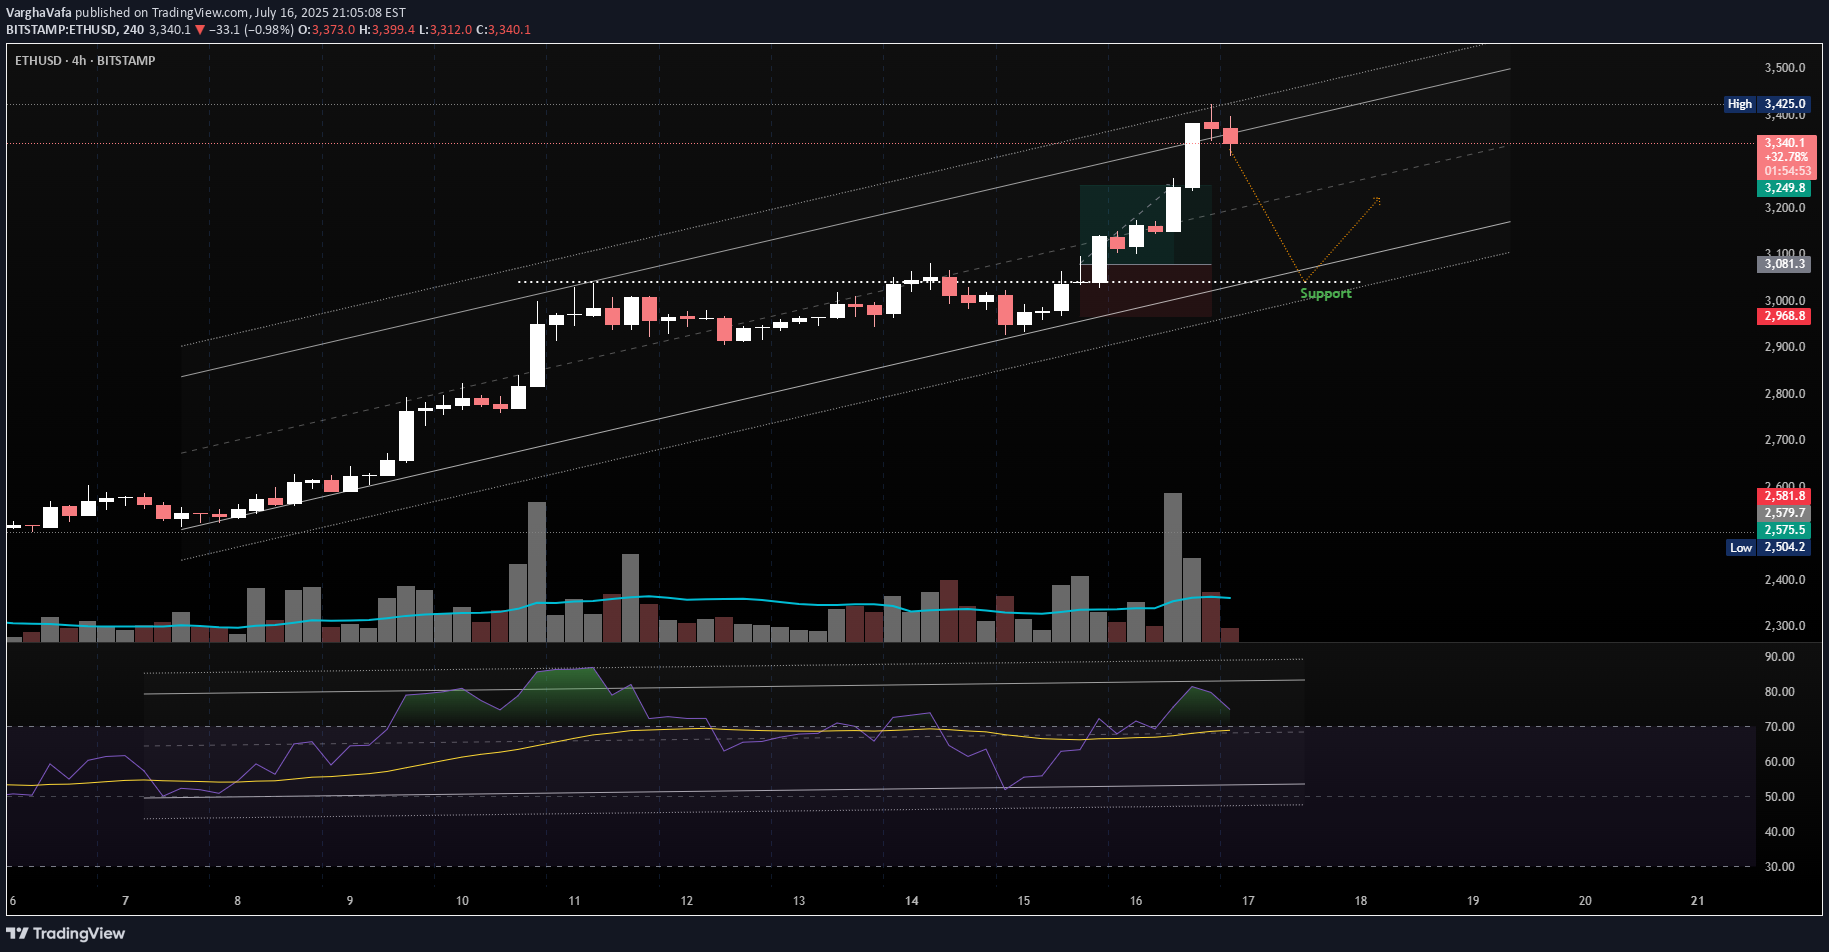
Pair: ETH/USD Timeframe: 4H Structure: Ascending Channel Indicators: RSI Overbought, Bearish Divergence Forming Volume: Spike into resistance 📉 What’s happening? Ethereum just tagged the top of its ascending channel, showing early signs of rejection. RSI is hovering near overbought, with weakening momentum on the last push. ⚠️ Caution Zone: $3,425 acting as upper resistance Price may retrace to midline or lower channel support ($3,250 → $3,050 range) 📌 Confirmation: Look for: A strong bearish candle or RSI breaking below 60 Volume divergence Bias: Short-term bearish correction, bullish structure intact as long as price holds the channel.
VarghaVafa
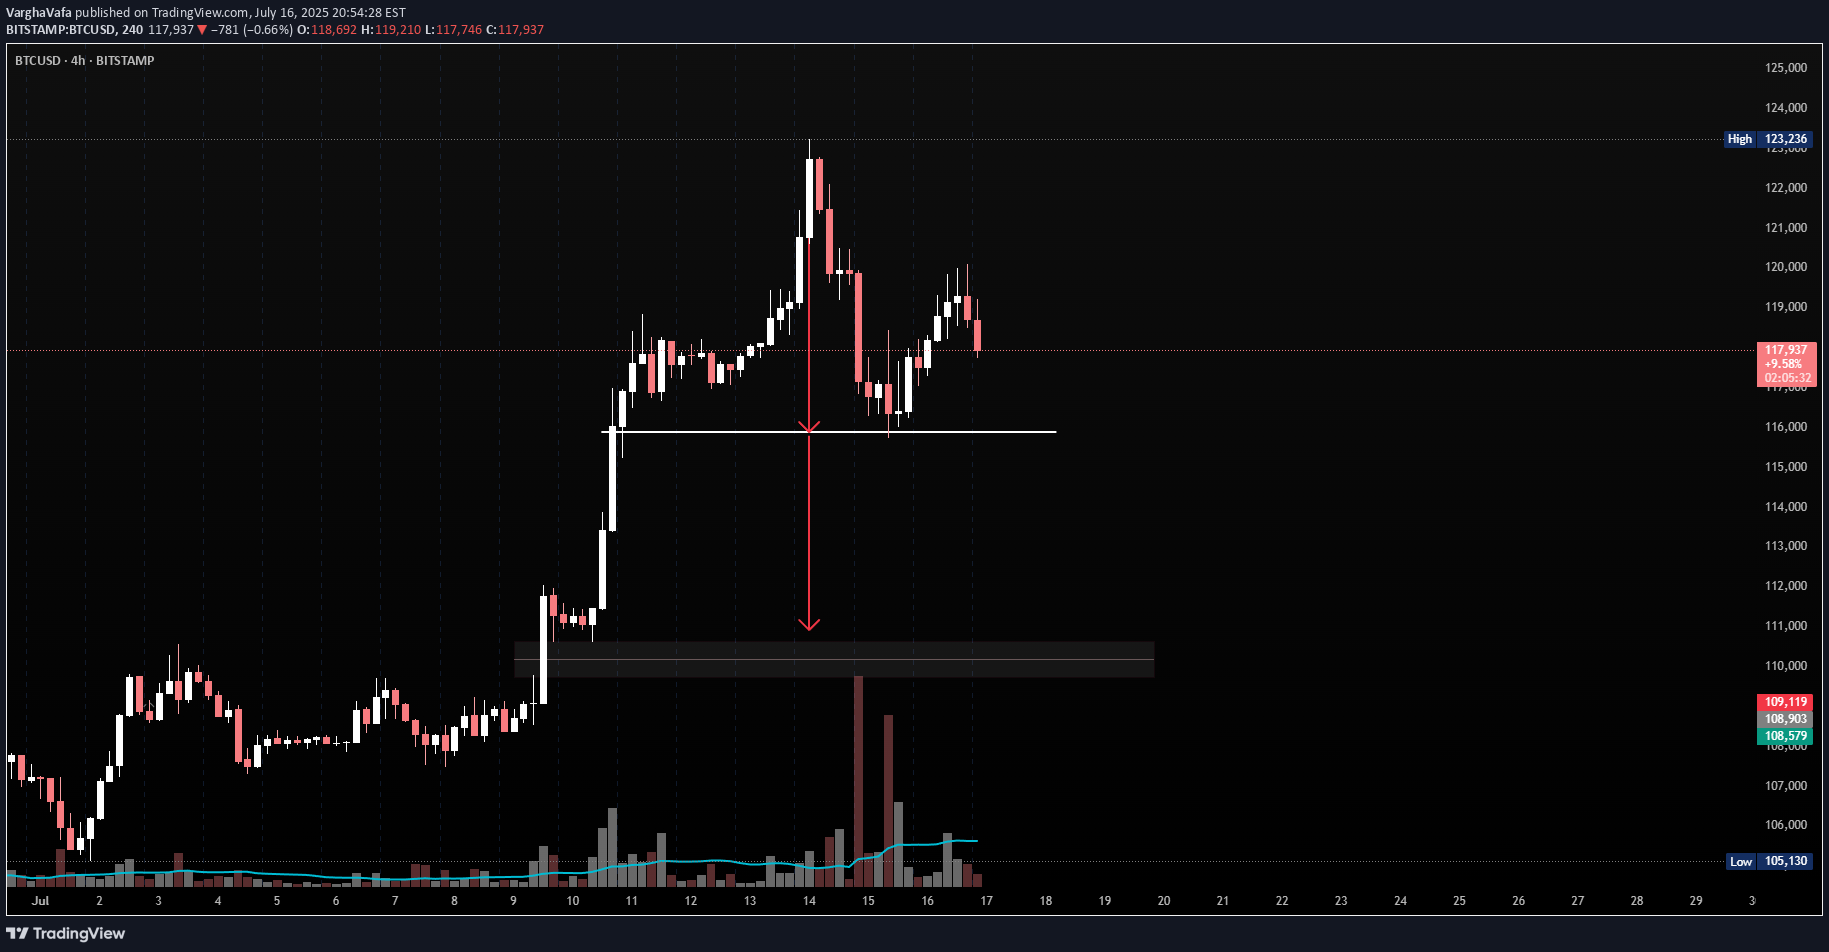
⚠️If and only if the price break below $115,000 ⚠️ BTCUSD – Potential Head & Shoulders Forming Pair: BTC/USD Timeframe: 4H Pattern in Focus: Head and Shoulders Key Neckline: ~$115,000 Confirmation Trigger: Only valid if price breaks below the neckline zone with strong volume 🧠 Idea Summary: Bitcoin has formed what appears to be a classic head and shoulders pattern. The right shoulder is completing, and the neckline is clearly respected. A break below $115K could confirm this bearish setup, with a measured move pointing toward the demand zone between $108K–$109K. 📌 Watch for: Volume spike on breakdown Retest of neckline turning into resistance Potential long setups only if price reclaims $119K+ Bias: Bearish if $115K breaks. Neutral until then.
VarghaVafa
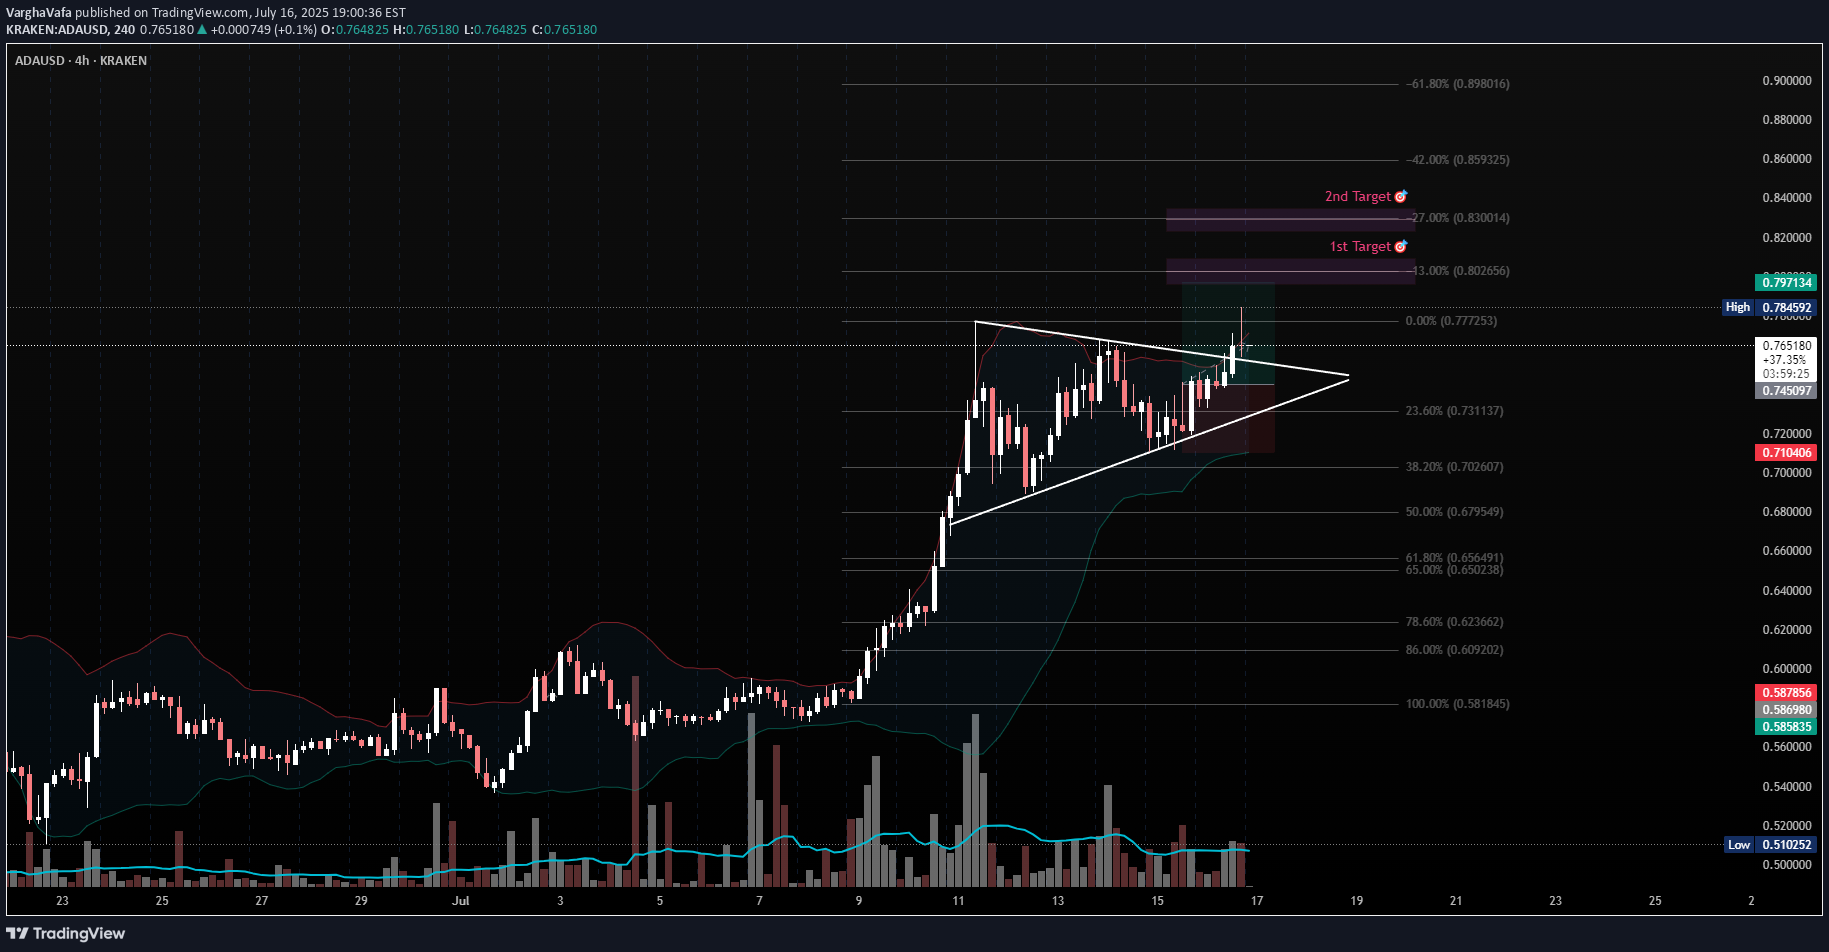
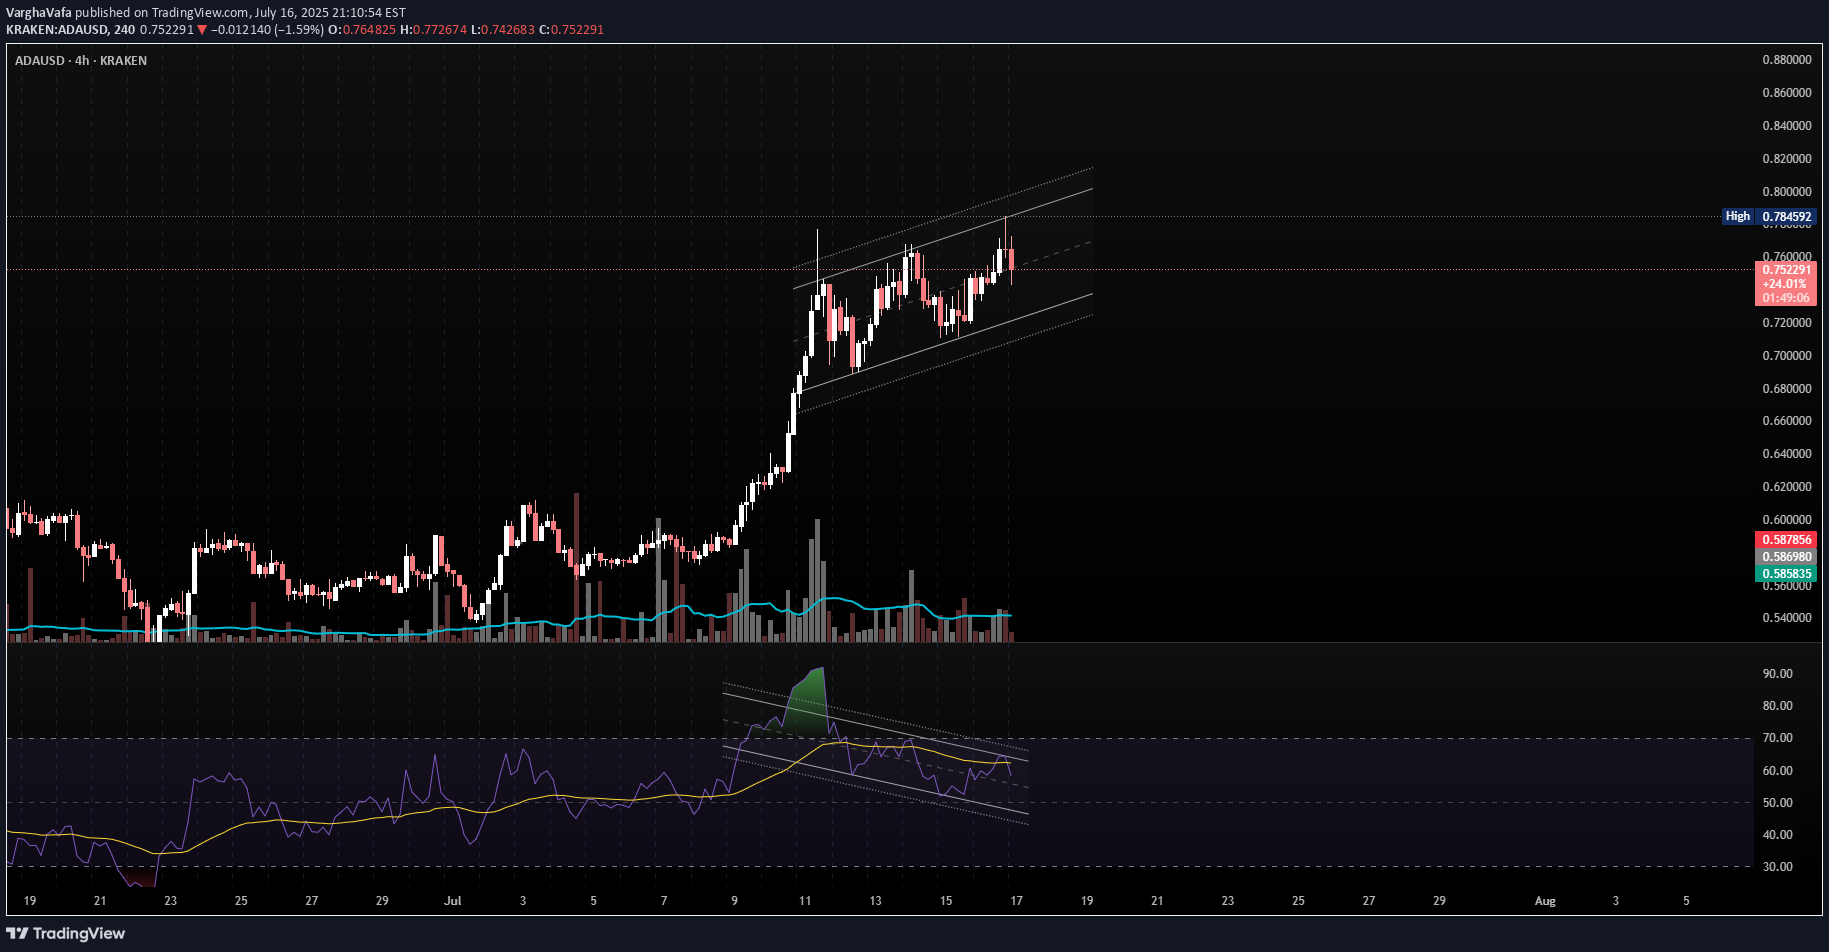
Pair: ADA/USD Timeframe: 4H Pattern: Ascending Triangle Breakout Level: ~$0.777 Entry: On breakout candle close above resistance Targets: 🎯 1st Target: $0.83 🎯 2nd Target: $0.86 Confluence: Bullish structure with higher lows pressing into horizontal resistance Breakout occurred with volume confirmation Fib extension aligns with target zones Bollinger Band expansion supports momentum continuation Bias: Bullish (continuation pattern) ⚠️ If price falls back below $0.745, watch for possible invalidation or retest of the triangle breakout.
VarghaVafa
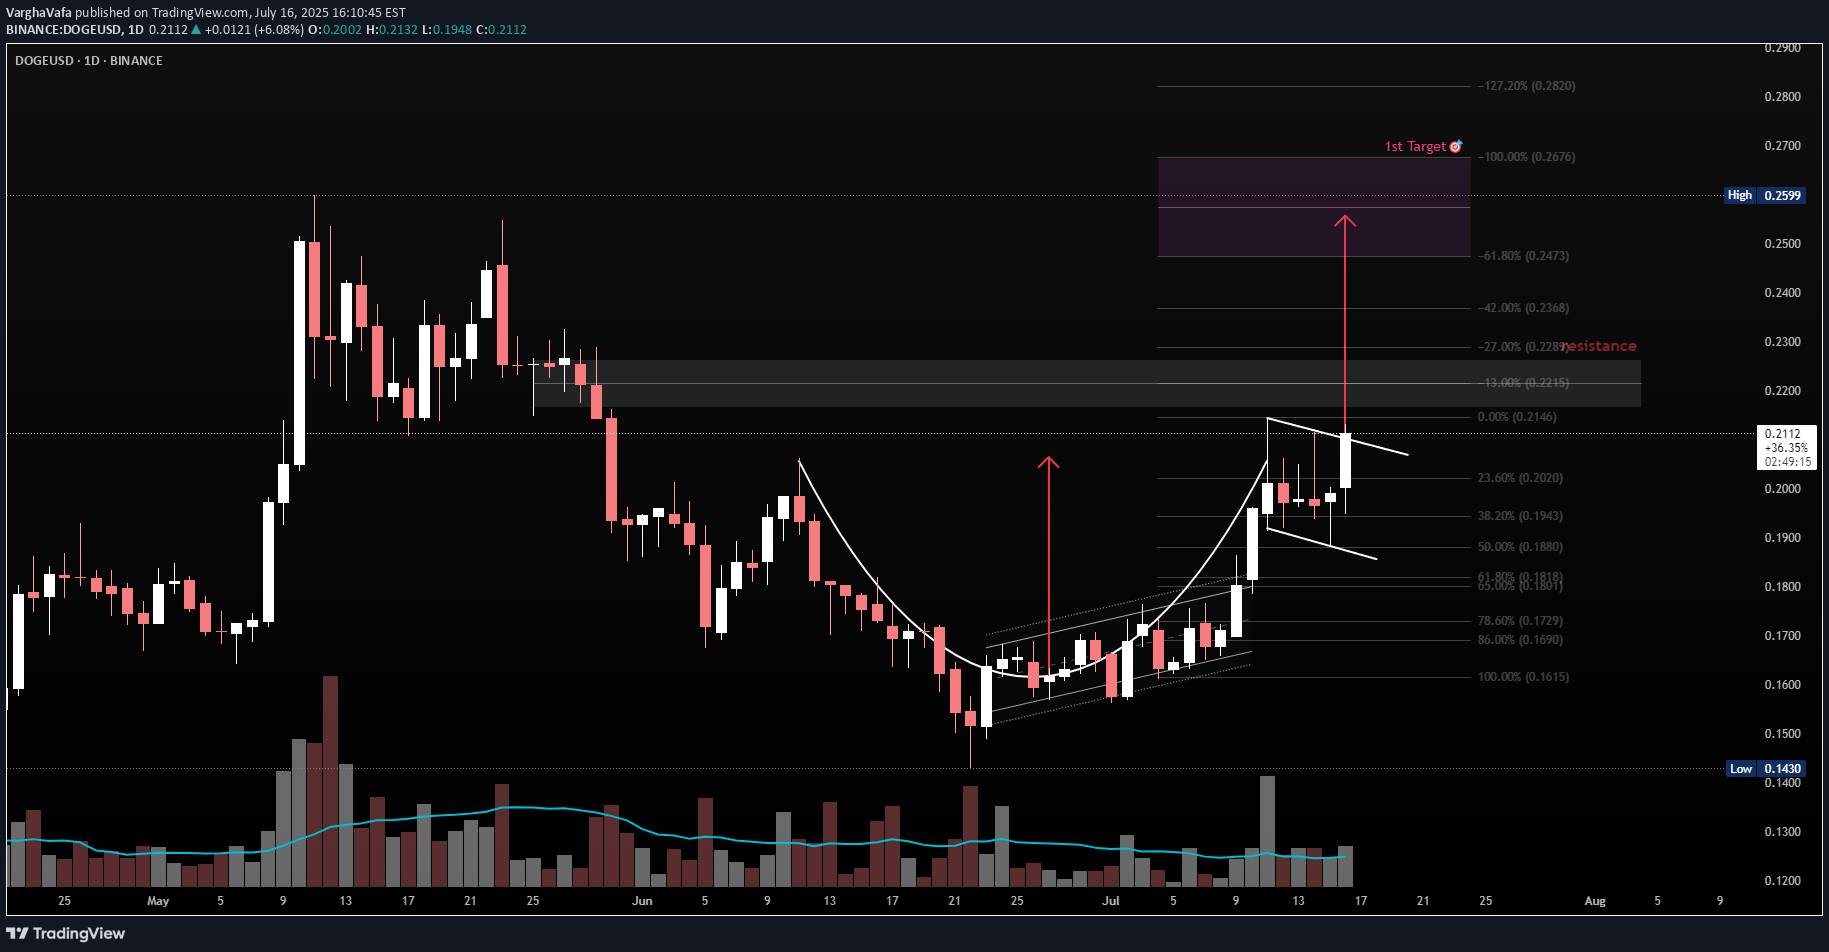
Pattern: Cup & Handle Timeframe: 1D Cup Range: $0.168 → $0.212 Handle: Forming as a descending bull flag Breakout Level: ~$0.2125 Measured Target: ~$0.256 Confluence: Clean rounded base (cup) Tight flag pullback (handle) Volume decrease during handle = healthy Prior resistance aligns with projected target zone Bias: Bullish (on breakout with volume confirmation) 📌 Watching for breakout above handle resistance with rising volume to confirm entry. Measured move aligns with historical supply zone. After break out from 0.216~0.226 Target Zone: 0.24~0.26
VarghaVafa
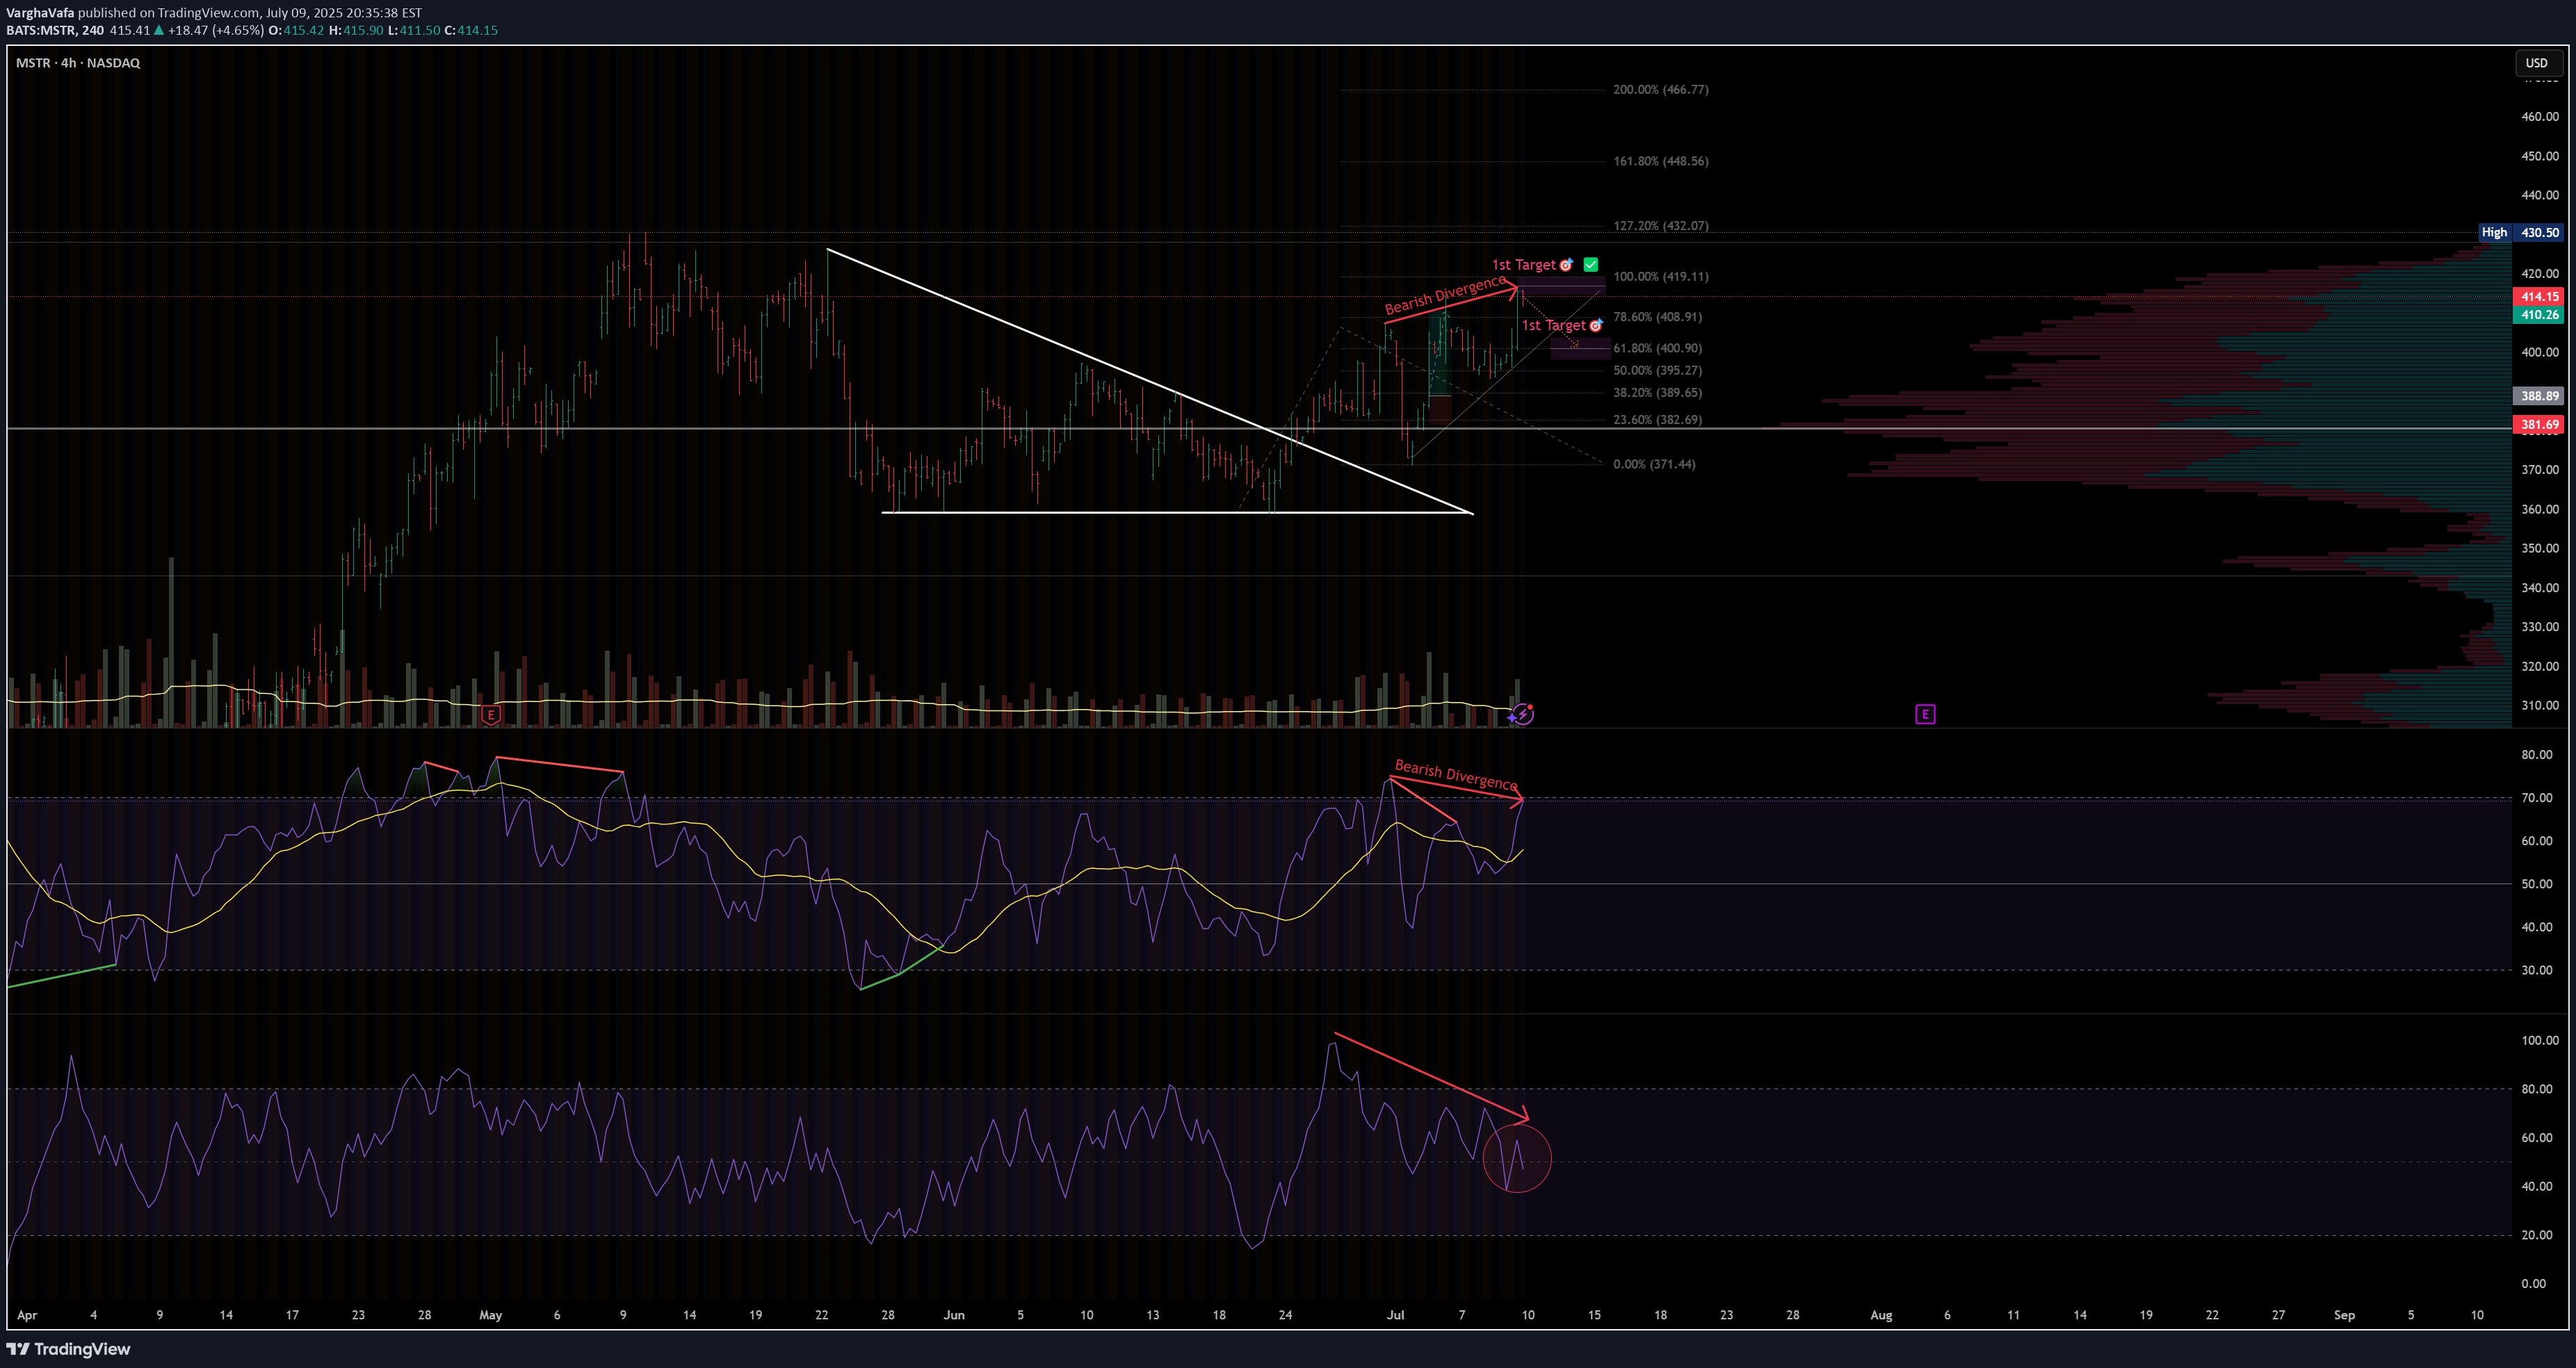
Setup Breakdown Price recently broke out from a falling wedge and hit both technical targets — first at ~$409 (78.6%) and then ~$419 (100%). However, momentum is weakening despite price hovering near the highs. We're now seeing early bearish divergence on multiple timeframes and oscillators, signaling potential reversal or pullback. ⚠️ Bearish Signals RSI Divergence Price made higher highs while RSI made lower highs — classic bearish divergence. Double confirmation Both RSI with MA and pure RSI show declining momentum. Volume drop Price is rising but volume is not following — another early warning sign. 🔻 Potential Breakdown Trigger If price closes below $407–405, that would break short-term structure and confirm the divergence risk. Watch for RSI to drop below 50 and volume to spike on red candles — that would likely accelerate the correction. 📉 Downside Zones to Watch $400 => 61.8% Fib retracement + consolidation base $395 => 50% Fib retracement $389 => 38.2% Fib retracement + prior breakout support ✅ Summary Divergence is still early but meaningful — momentum does not support current price highs. A breakdown from current levels could open a short window down to $386 or even $371 if confirmed. Watch RSI + volume + candle structure for confirmation before acting. Disclaimer: This is not financial advice. Always manage your own risk and follow your trading plan. #MSTR #BearishDivergence #RSI #Fibonacci #MomentumShift #VolumeAnalysis #TradingView #TechStocks #4HChart
VarghaVafa
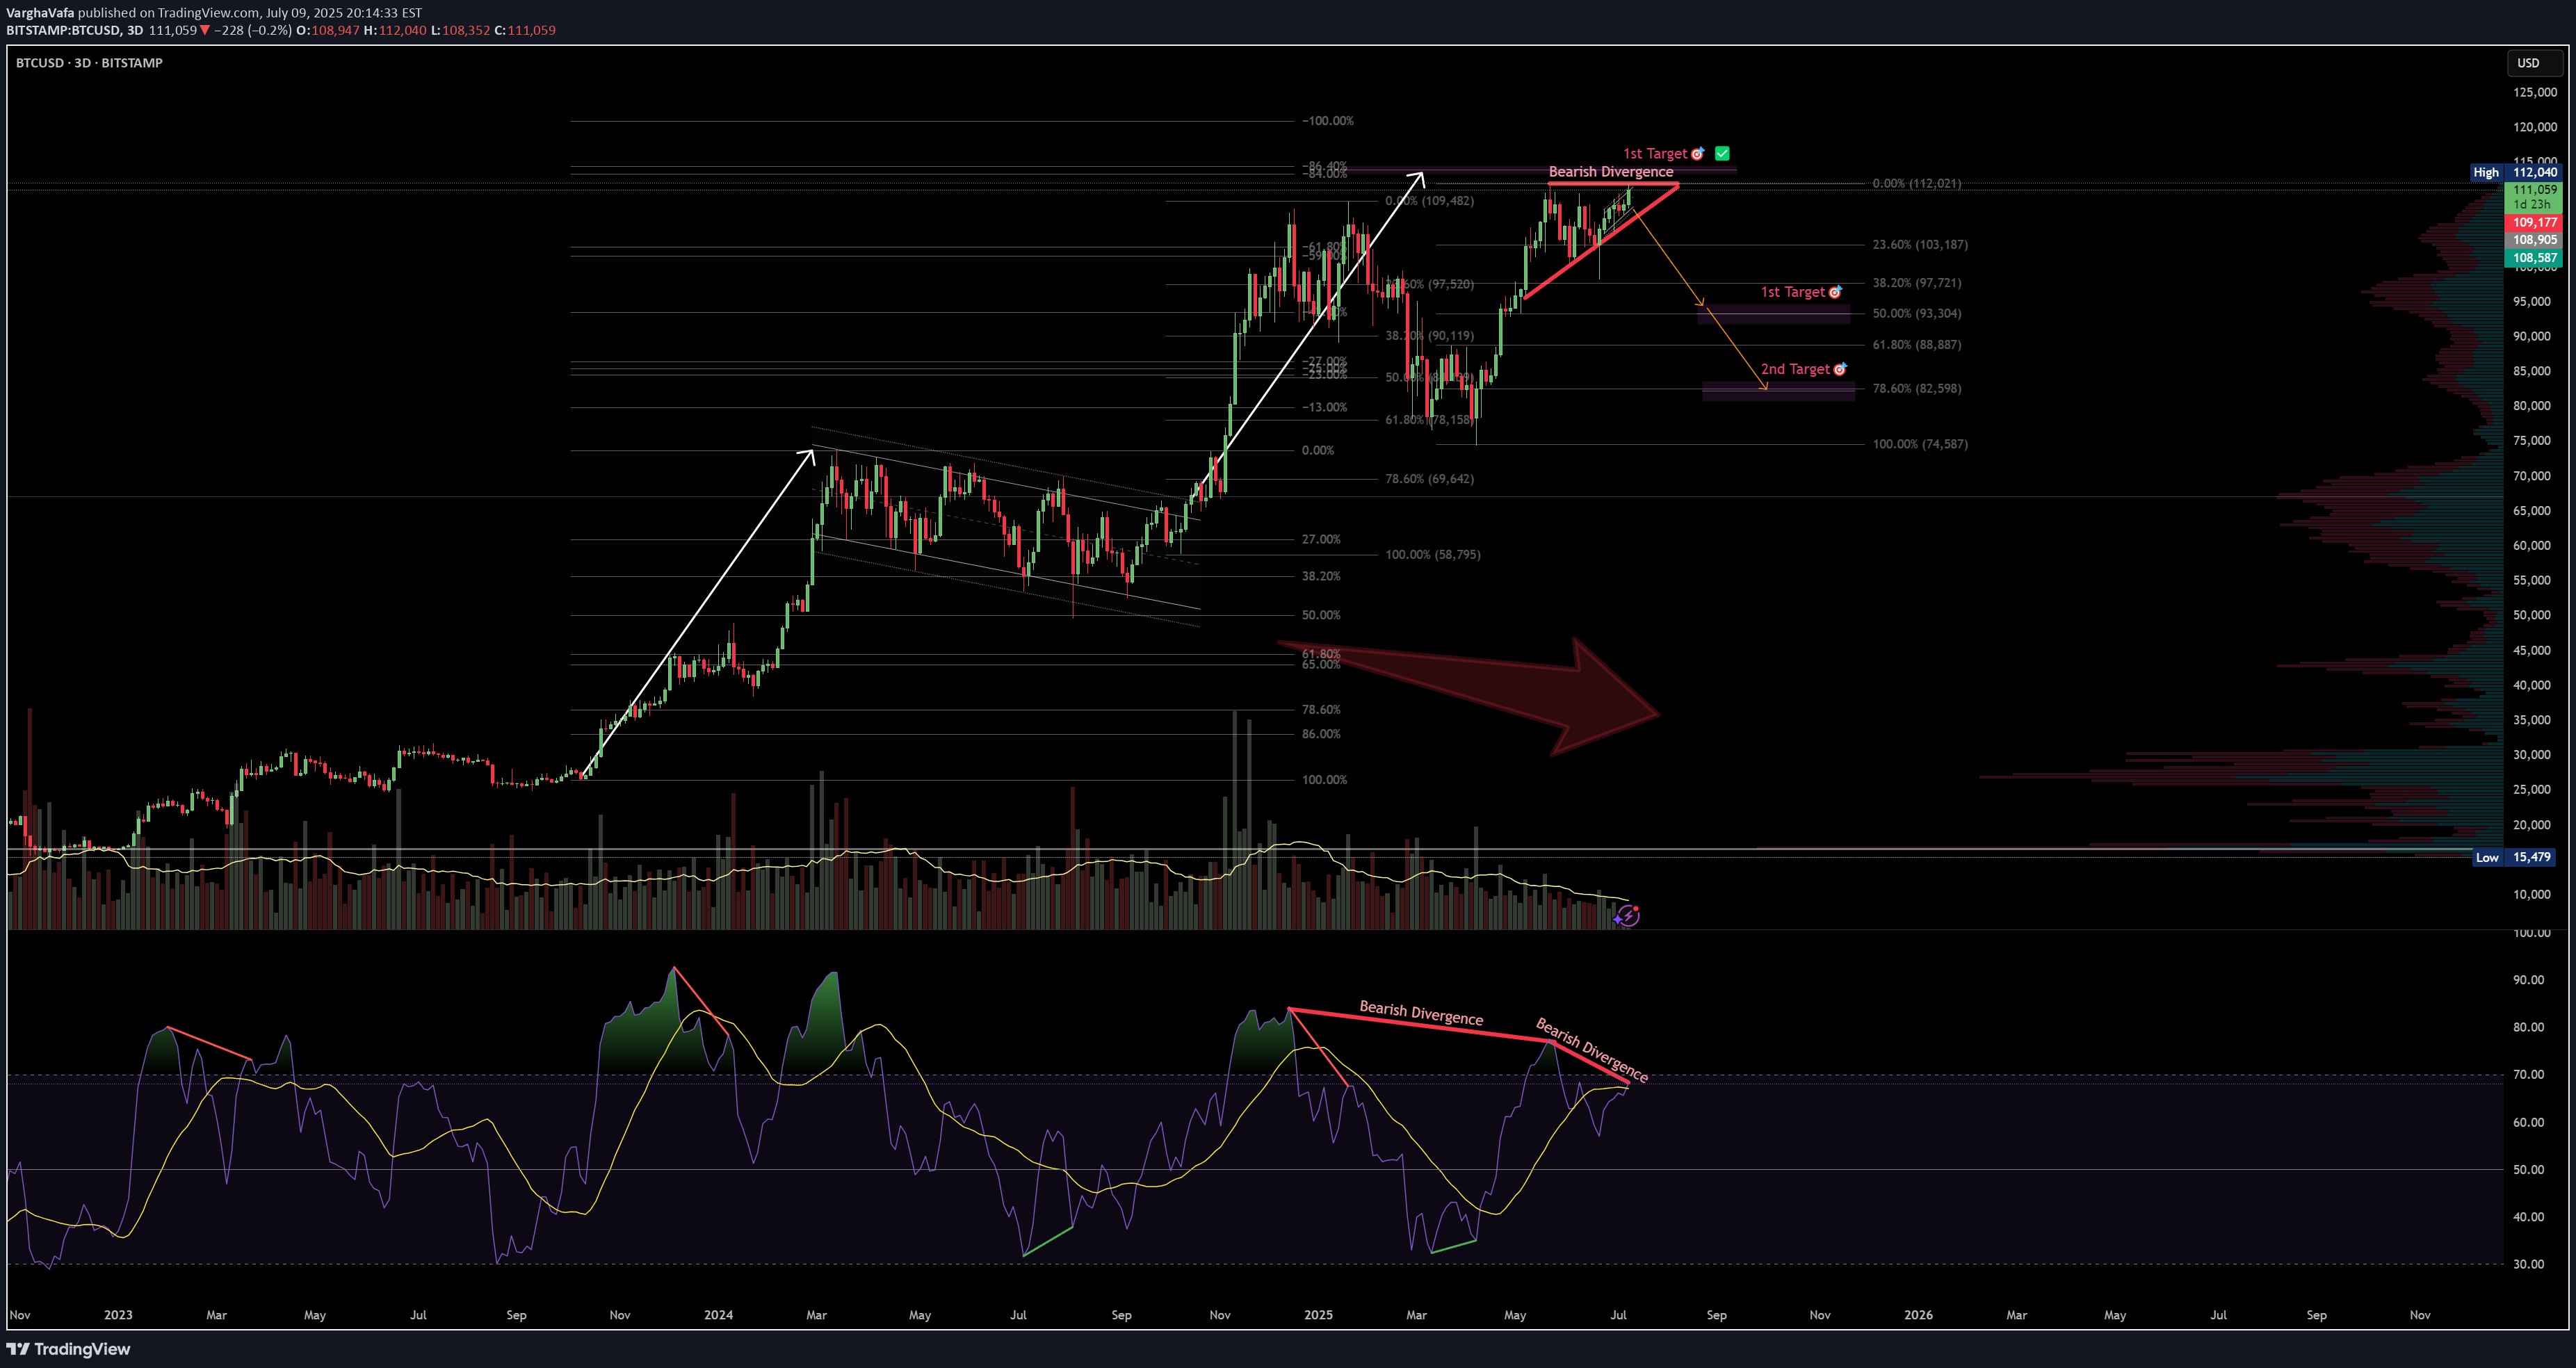
🧠 Setup OverviewBitcoin is showing signs of exhaustion after a parabolic rally:Bearish divergence is visible on the 3D RSI — price made higher highs while RSI made lower highs.Volume is shrinking with each push up, suggesting buyer momentum is fading.Price is pressing into all-time highs without conviction, signaling potential for a pullback.🔻 Downside TargetsTarget 🎯LevelWhy It MattersTarget 1$92,300 (50% Fib)Midpoint of last impulse + first strong demand area.Target 2$82,500 (61.8% Fib)Volume-profile support + key confluence zone.🔎 What Confirms the Setup?Breakdown below $108K structureDaily close below $105K with increasing volumeRSI losing midline support = momentum shift confirmed❌ InvalidationDaily close > $112K with strong volume = idea invalidWould suggest continuation toward blue-sky breakout✅ SummaryBearish divergence + volume drop = classic topping signalsRisk is well-defined, with Fib-backed targets offering clean R:RTrade cautiously — momentum is fading, not gone yet📛 Disclaimer: This is not financial advice. Do your own research and manage risk according to your plan.#Bitcoin #BTC #CryptoAnalysis #BearishDivergence #RSI #VolumeProfile #Fibonacci #TradingView
Disclaimer
Any content and materials included in Sahmeto's website and official communication channels are a compilation of personal opinions and analyses and are not binding. They do not constitute any recommendation for buying, selling, entering or exiting the stock market and cryptocurrency market. Also, all news and analyses included in the website and channels are merely republished information from official and unofficial domestic and foreign sources, and it is obvious that users of the said content are responsible for following up and ensuring the authenticity and accuracy of the materials. Therefore, while disclaiming responsibility, it is declared that the responsibility for any decision-making, action, and potential profit and loss in the capital market and cryptocurrency market lies with the trader.